DOI:
10.1039/C1RA00177A
(Paper)
RSC Adv., 2011,
1, 490-497
Mechanistic studies of photoinduced degradation of Orange G using LC/MS
Received
17th May 2011
, Accepted 24th June 2011
First published on 17th August 2011
1 Introduction
Azo dyes are the most commonly used class of dyes which are frequently used by many industries. The waste water effluents released by these industries is colored in the presence of these dyes and can block both sunlight and oxygen penetration, which are essential for aquatic life. Besides this, some dyes in particular can undergo anaerobic decoloration to potentially carcinogenic amines.1 Consequently there is a considerable need to treat these colored effluents before discharging them to various water bodies. Advanced oxidation processes (AOP's) employing heterogeneous catalysts have emerged as potential destructive technologies leading to the total removal of most of organic pollutants.2–4 Titanium dioxide mediated photocatalytic reactions have been extensively used in such work. However, the low photo-quantum efficiency of TiO2 which arises from the fast recombination of photogenerated electrons and holes besides the large band gap (Eg = 3.2 eV) is one of the major problems in using it as a catalyst. Various transition metals have been added to TiO2 catalyst to improve its response and also reduce the recombination of photogenerated electrons and photogenerated holes.5–7 In many cases composites of mixed oxides have been used to enhance the photocatalytic activity towards the degradation of pollutants.8–10 We have previously reported the use of TiO2/Cr composite as a potential catalyst for the degradation of methylene blue.11 In one of the recent studies, it was shown that TiO2 mixed with 20% α-Cr2O3, showed significantly modified textural properties presented in higher surface areas, larger porosities, and more homogeneous mesoporous structures. In addition, the incorporation of Cr3+ ions in the titania lattice enhanced the thermal stability of the anatase phase against transformation to rutile.12 Therefore, we have chosen the same composite to degrade an azo organic dye. However, the focus of this study was not aimed at the potentiality of the composite to degrade the dye, but rather to look at the mechanism of degradation using LC-MS/MS studies.
Limited information is available on the reaction mechanisms involved in the photocatalytic degradation of dyes and on the identification of major transient intermediates. The identification of these intermediates and the possible reaction pathways are an important aspect of these processes, especially in view of their practical applications.13,14 In this study, a titanium–chromium oxide composite was used to degrade Orange G (OG) dye in aqueous solutions. This particular dye was chosen because it has a variety of functional groups such as the sulfonate, aryl, hydroxyl and azo groups. The degraded products were analyzed by a variety of analytical techniques such as UV/Vis, HPLC-UV/Vis and LC-MS/MS. The aim of this work is to separate and characterize the various intermediates formed during the course of dye degradation and to correlate them. Suitable mechanistic pathways for Orange G degradation are also suggested.
2 Experimental
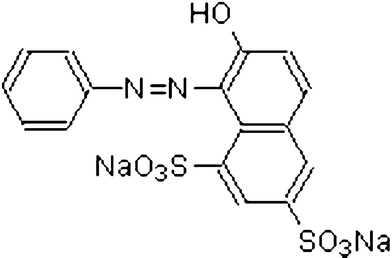
The azo dye, Orange G, was obtained from Sigma-Aldrich and used as such. The dye purity was >90% and was used as such. Physical characteristics of Orange G dye (OG) along with its structure are given in Table 1. Deionized water was used to make the dye solutions of desired concentrations. The catalyst composite of TiO2 + Cr2O3 containing 20% Cr2O3 used in this work was prepared and characterized as reported earlier.12,15
Table 1 Physical characteristics of Orange G dyea
|
http://stainsfile.info/StainsFile/dyes/dyes.htm.
|
| Common name |
Orange G |
| Suggested name |
Orange G |
| C.I. number |
16230 |
| C.I. name |
Acid orange 10 |
| Class |
Azo |
| Absorption maximum |
475 nm |
| Color |
Orange |
| Empirical formula |
C16H10N2O7S2Na2 |
| Formula weight |
452.386 |
| Structure |
|
2.1 Catalyst preparation and characterization
Titanium–chromium mixed oxide containing 20% molar Cr content was prepared by the sol–gel method as described elsewhere.12 In a typical experiment, 6.0 mL (1.76 × 10⁻² mol) of Ti[O(CH2)3CH3]4 was dissolved in 40 mL of 2-propanol followed by the addition of 0.20 mL concentrated HNO3. While stirring, a solution of 1.76 g (4.4 × 10⁻³ mol) of Cr(NO3)3·9H2O in 80 ml 2-propanol was added gradually to the titanium butoxide solution and the mixture was stirred for one hour. This was followed by the dropwise addition of 1.0 mL of deionized water for hydrolysis, and the mixture was stirred for 48 h until a green colloidal gel was formed. The solvent was then removed by evaporating it in a water bath at 75 °C. The solid product obtained was dried in an oven at 120 °C for 2 h followed by step wise calcinations at 500 °C for 5 h, resulting in a final product. The product was characterized by powder X-ray diffraction (XRD), FTIR spectroscopy, transmission electron microscopy (TEM) and nitrogen adsorption. The details are reported elsewhere.12
Orange G (OG) dye stock solution (1 × 10⁻³ M) was prepared in deionized water. A portion of the stock solution was diluted ten times to be used as a working solution. A series of working dye solutions with different amounts of catalyst were prepared. The above suspensions were stirred in the dark for one hour to attain the adsorption–desorption equilibrium for OG and dissolved oxygen on the surface of the catalyst. This was followed by illumination with UV light using a UV lamp (UVGL-58, J-129, Upland make). The instrument operates at 0.12 A with a UV output at 365 and 254 nm, however, the lamp was used in the 254 nm output mode for these studies. The light intensity was calculated to be 300 W m−2. During irradiation, the contents of the solution were agitated continuously so as to maintain a homogeneous environment. After a certain time interval, the cell was drawn away from the UV light and centrifuged, and the absorbance of the supernatant solution was monitored instantaneously on a spectrometer. Absorbance measurements were recorded in the range of 200–800 nm, and the maximum absorption wavelength (λmax = 475 nm) for the dye (OG) was used for the calibration curves and further concentration measurements. UV/Vis studies were done on a CARY UV/Vis spectrophotometer, using a 1 cm quartz cell. The optimum conditions for maximum degradation (70%) of the OG dye were as follows: [OG] = 1 × 10⁻⁴ M, catalyst amount = 45mg/250 mL and pH = 6.5. The reproducibility of the results was within 5%.
2.3 Product analysis and identification using LC-UV/Vis-MS studies
Chromatographic experiments with HPLC-UV/Vis system were carried out on a HP 1100 liquid chromatograph (Agilent, USA) using a binary solvent gradient pump and an automatic injector. The products of dye degradation were separated using an Agilent Zorbax® SB-C18 column 150 mm × 4.6 mm packed with 5 μm particles. The detection system was a diode array detector (Agilent, USA) with a detection range between 200–780 nm. The signal acquired from the detector was recorded by HP Chemstation® software. The mobile phase consisted of two solutions namely A and B. Solution A was made from 0.1 M ammonium acetate and acetic acid (pH 5.75), whereas solution B was acetonitrile. The gradient elution was from 5% to 95% in 30 min, the flow rate was 0.8 mL min−1 and the injection volume was 100 μL.
The gradient HPLC separation was coupled with LC/MSD trap 6310, ion trap mass spectrometer (Agilent technologies). The mass spectrometer was equipped with an electrospray ionization source and operated in positive polarity. The ESI conditions were as follows: capillary voltage: 3.5 kV, endplate offset was fixed at 500 V; skimmer at 40 V; trap drive at 53 V; the nebulizer pressure was 70 psi; drying gas flow was 12 L min−1 and the drying temperature was 350 °C. The mass range was from 50 to 700 m/z. Tandem MS experiments were conducted using the Auto MSn mode wherein helium gas was used as a collision gas.
3 Results and discussion
Preliminary experiments were carried out in the absence and presence of either UV light, TiO2, or the chromium mixed TiO2 catalyst alone. The results showed that neither UV light nor catalysts (TiO2 or Cr–TiO2) alone were sufficient for the degradation of OG dye. In the presence of UV light and the catalyst, an efficient time-dependent degradation of the dye was observed. In a comparative study, it was found that the OG dye was degraded to 15% in the presence of TiO2/UV, while the dye degraded to 70% in the presence of TiO2–Cr/UV in the same irradiation time (300 min).
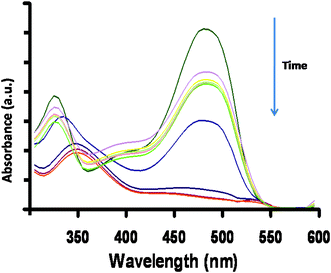
The UV-Vis spectrum of OG consists of two main peaks at 330 and 475 nm. The band at 330 nm arises from the π–π* transition related to the aromatic ring attached to the –N![[double bond, length as m-dash]](https://www.rsc.org/images/entities/char_e001.gif) N– group in the dye molecule, whereas the 475 nm band could be assigned to the n–π* transition of the –N
N– group in the dye molecule, whereas the 475 nm band could be assigned to the n–π* transition of the –N![[double bond, length as m-dash]](https://www.rsc.org/images/entities/char_e001.gif) N– group.16–18 During the degradation process, it was observed that the two characteristic absorption peaks at 330 and 475 nm decreased and almost disappeared during the course of the study. This shows that the chromophore and conjugated system were being destroyed. For degradation studies, the λmax of the dye (475 nm) was chosen for further investigations.
N– group.16–18 During the degradation process, it was observed that the two characteristic absorption peaks at 330 and 475 nm decreased and almost disappeared during the course of the study. This shows that the chromophore and conjugated system were being destroyed. For degradation studies, the λmax of the dye (475 nm) was chosen for further investigations.
3.2 Kinetic studies
The change in the absorption spectra of the dye solution was monitored at regular time intervals. It was noted that the absorption value of the dye became less with irradiation time as shown in Fig. 1. The decrease in concentration value of dye solution can be related in terms of the photodegradation efficiency (η) by using the following relationship:| |  | (1) |
where, C0 represents the initial concentration of the dye solution and C represents the concentration of the dye solution at time t.
The change in concentration value of the dye solution during its degradation was used to find out the reaction kinetics. The OG degradation fitted best to the following pseudo first-order kinetic equation which is given by:
| |  | (2) |
where
C0 is the initial concentration of OG,
C is the concentration of OG at time
t, and
kobs is the observed reaction rate constant (obtained from the slope of the line in the plot of ln(
C0/
C)
versus time).
Fig. 2 shows the best fit of
eqn (2) to the observed changes. In this study, the observed rate constant value was found to be 4.0 × 10
−3 min
−1 with a correlation coefficient value of 0.996.
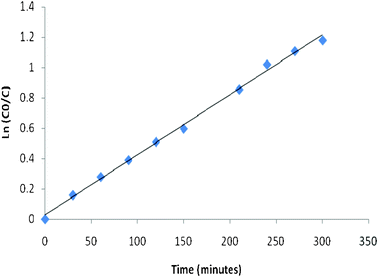 |
| | Fig. 2 Change in concentration of dye solution with time during the photocatalytic study. | |
3.3 Effect of pH
There are several factors which influence the effect of pH on dye degradation. These include the ionization state of the surface, particle size of the catalyst, nature of the dye and extent of the substrate adsorption on the catalyst surface.19 The degradation reactions were carried out at different pH conditions of 3.0, 4.0, 6.5, 10.0 and 11.0 for a period of 5 h. Fig. 3 shows the % degradation at various pH values. It can be seen from Fig. 3 that the dye degraded more at an acidic pH as compared to at a basic pH (e.g., at pH 3, % degradation of the dye was 40% as compared to only 18% at pH 11); similar behavior was reported in the literature.20 The dye is a fused polynuclear aromatic compound with an extensive π electron conjugation which can easily form a stable complex by donating electrons to the vacant d orbital of the mixed oxide. In other words, the OG dye acts as a strong Lewis base and can easily adsorb on the positively charged catalyst surface. The degradation decreased by further lowering the pH value (e.g., 50% at pH 4 and 30% at pH 3). This is because of the reason that at lower pH values, more H+ are available for adsorption to mask the surface of the catalyst thus preventing the photoexcitation of semiconductor particles, thereby reducing the generation of free radicals. On the other hand, % degradation was also less in basic media as compared to the natural pH of the dye solution as shown in Fig. 3. This can be explained on the basis that at high pH values, −OH ions will be preferably adsorbed on the catalyst surface thus reducing the overall efficiency of the catalyst. It was found that 70% of the OG dye could be degraded in 300 min in the presence of the mixed oxide catalyst as compared to merely 15% degradation in the presence of TiO2 alone.
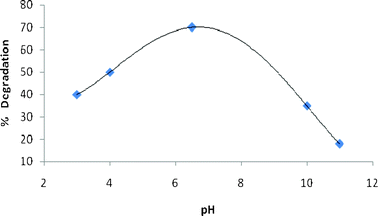 |
| | Fig. 3 Effect of pH on % degradation of Orange G (Orange G = 1 × 10⁻⁴ M, catalyst = 45 mg/250 mL, time of irradiation = 5 h). | |
3.4 LC-UV/Vis-MS studies for product analysis
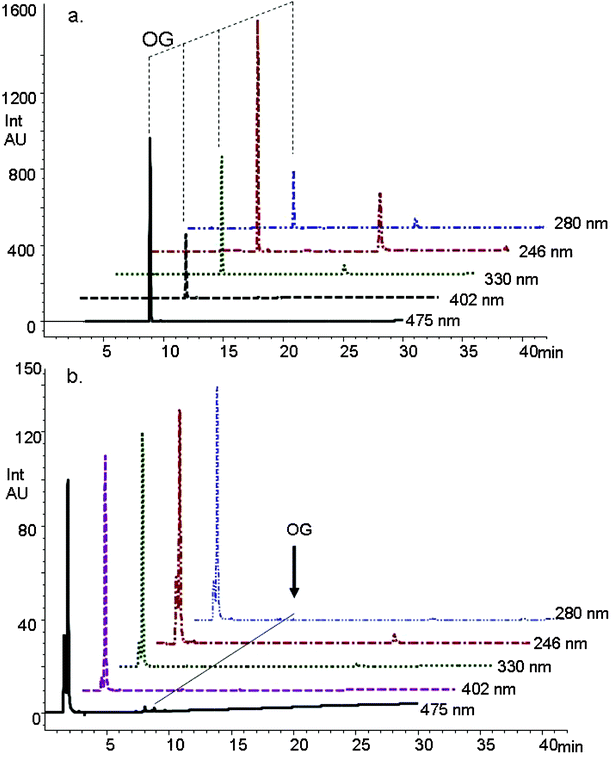
The chromatographic separation of the dye solution recorded initially and after 5 h of photocatalytic treatment was monitored simultaneously at different wavelengths and is shown in Fig. 4. This experimental data shows that at the end of a 300 min treatment with the composite and UV irradiation, the dye solution was drastically decolorized or degraded. Using photocatalytic degradation treatment of dye solutions not only provided decoloration, but also an appreciable degree of destruction in the dye molecule. The visible band of the OG dye at 475 nm as well as the UV bands at 330, 280, and 246 nm were observed to decrease, and at the same time a new band started to appear at lower retention times (Fig. 4). This indicated the destruction of the parent compound and appearance of new compounds that are structurally different from the parent compound.
The intensity of the parent dye molecule decreased substantially, however the intermediate products produced during the degradation process were very low in concentration and were beyond the detection limit of the UV/Vis diode array detector. In order to detect any new compounds formed during the degradation process, mass spectrometric analysis was conducted on the degraded dye. Characterization and identification of the detected intermediates by mass spectroscopic analysis was further carried out by tandem mass spectrometric measurements. Table 2 shows the retention time and the mass of each of the characterized intermediate products in addition to the mass fragments obtained during the MS/MS measurements. As an example, Fig. 5 shows the tandem mass spectrum of one of the degradation intermediate products, m/z 175. In this intermediate, the dye molecule has lost the two sodium sulfonate substituents and the N-phenyl substituted group as a result of the oxidation process.
 |
| | Fig. 5 Tandem mass spectrum of an intermediate ion m/z 175 which was isolated by HPLC. | |
| Structure no. |
Retention time |
Molecular weight |
MS/MS fragments |
| S1 |
2.2 |
269 |
187, 105 |
| S2 |
9.4 |
227 |
209, 168, 139, 100 |
| S3 |
4.5 |
170 |
111, 70 |
| S4 |
4.8 |
175 |
157, 139, 129, 101 |
| S5 |
5.1 |
202 |
184, 146, 123, 102, 88, 62 |
| S6 |
6.8 |
195 |
177, 151, 133, 107, 89 |
| S7 |
7.4 |
373 |
355, 337, 227, 210, 149, 134, 128, 114, 111 |
| S8 |
7.9 |
239 |
221, 195, 177, 151, 133, 109, 89 |
| S9 |
8.4 |
261 |
243, 219, 204, 172, 158, 130, 101 |
| S10 |
9.1 |
111 |
95, 85, 70, 57 |
| S11 |
9.6 |
283 |
265, 239, 221, 205, 195, 177, 151, 133, 121, 89 |
Various other possible intermediates that have been identified through MS/MS measurements were put together qualitatively to form a degradation pathway of the OG dye compound. The major identified intermediates were substituted phenols, aromatic hydroxyl amines, nitroso compounds as well as dicarboxylic aromatic acids. The products, depicted in the proposed degradation pathway (Fig. 6), arise from the indiscriminate attack of ˙OH radicals at various sites on the OG dye molecule. The target of the radical attack is primarily the electron rich π bonds of the azo group followed by sulfonate groups and to a lesser extent the partially deactivated aromatic rings.21–24 Oxidative cleavage of the N![[double bond, length as m-dash]](https://www.rsc.org/images/entities/char_e001.gif) N bond to hydroxyl amines has been observed in a variety of species (S2, S4, S7, S8, S9). Intermediates S1, S3, and S5 showed that ˙OH radical attack was possible at both nitrogen atoms of the azo group with concomitant elimination of a phenyl group. The central atom of the sulfonate functionality was also susceptible to ˙OH radical attack. In this case loss of H2SO4 (S7 → S9), –SO3Na (S9 → S2, OG → S1) and ˙ONa radicals (OG → S11) were detected.25 The detailed mechanism of these processes has been fully discussed in our previous report on the photolytic degradation of Amido Black using UV/H2O2.26
N bond to hydroxyl amines has been observed in a variety of species (S2, S4, S7, S8, S9). Intermediates S1, S3, and S5 showed that ˙OH radical attack was possible at both nitrogen atoms of the azo group with concomitant elimination of a phenyl group. The central atom of the sulfonate functionality was also susceptible to ˙OH radical attack. In this case loss of H2SO4 (S7 → S9), –SO3Na (S9 → S2, OG → S1) and ˙ONa radicals (OG → S11) were detected.25 The detailed mechanism of these processes has been fully discussed in our previous report on the photolytic degradation of Amido Black using UV/H2O2.26
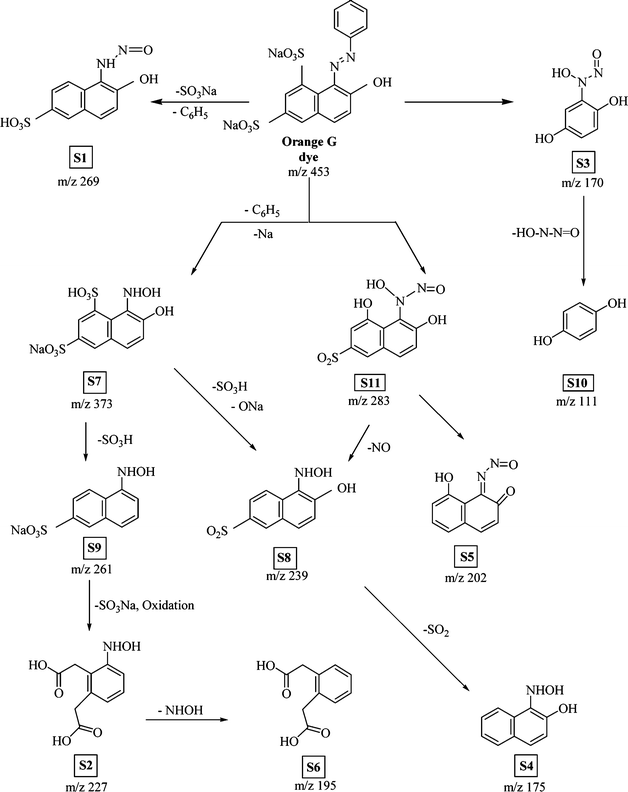 |
| | Fig. 6 Schematic diagram of various intermediate formations of Orange G dye as a result of photocatalytic degradation. | |
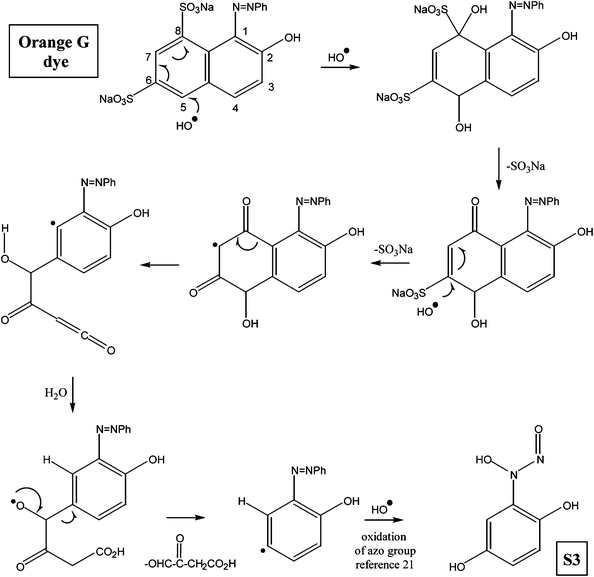
In two instances during the treatment of the OG dye molecule with TiO2/Cr2O3-UV, we observed that the naphthyl group of OG was partially oxidized to a dihydroxybenzene derivative (OG → S3) and to a dicarboxylic acid (S9 → S2). Although the ˙OH radical oxidation of fused aromatic rings to the aromatic carboxylic acids oxidations and phenols have been reported for other dyes, no mechanistic pathways have been suggested.11,24,27 In this paper we propose a process for ˙OH radical induced oxidation of naphthyl groups followed by degradation to simpler aromatic residues. In Scheme 1, the OG dye molecule is converted to substituted phenol S3. The degradation mechanism starts with the conjugate addition of ˙OH radical at C-5 to yield a carbon radical at C-6 which can be delocalized to C-8. The radical is then quenched by an ˙OH radical and the resulting α-hydroxysulfonate undergoes elimination to reveal an α,β-unsaturated carbonyl compound. The latter undergoes a further conjugate addition and elimination to form a stable diketyl radical. Fragmentation of the diketyl radical at C8–C9 yields a ketene, which reacts rapidly with water to form a carboxylic acid and an aromatic phenyl radical. Intramolecular ˙H radical abstraction by the phenyl radical followed by elimination of a glycolate residue and quenching by ˙OH, then affords dihydroxybenzene S3.
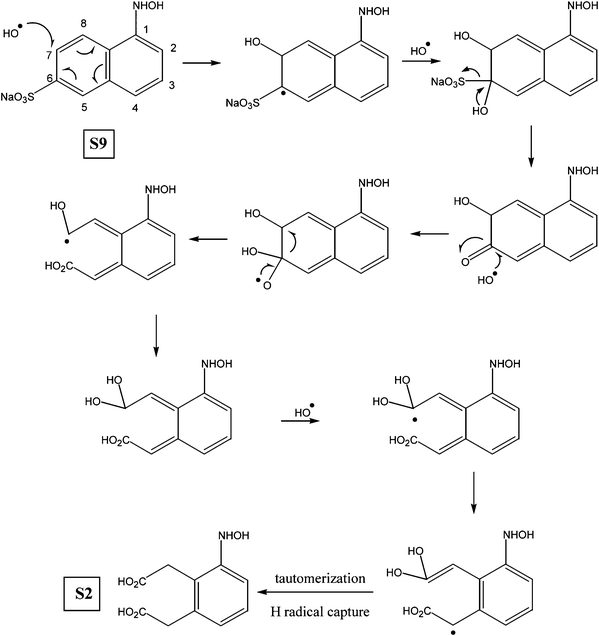
The mechanism for the oxidation of naphthalene S9 to S2, depicted in Scheme 2, follows a similar pattern of ˙OH radical attack, elimination and bond cleavage. However the initial ˙OH radical attack occurs at C7 of intermediate S9 to produce an α-hydroxy compound which is further oxidized and cleaved at C6–C7 to yield a dicarboxylic acid.
Apart from the fragments that have been identified, low mass derivatives such as formate, acetate, oxalate, SO42−, CO2, H2O, NH4+ and NO3− ions have also been reported in the literature for OG dye degradation process.28,29 However, the present investigation is merely focused on the formation of major intermediates and their probable reaction pathway.
4 Conclusion
The photodegradation of the Orange G dye in the presence of chromium–titanium mixed oxide followed the pseudo first-order kinetics with a degradation efficiency of 70% in 300 min. The degraded products were analyzed using liquid chromatography tandem mass spectrometry. The analysis revealed that the photocatalytic degradation of the dye molecule resulted in the formation of intermediate products such as substituted phenols, aromatic hydroxyl amine, nitroso compounds and dicarboxylic aromatic compounds. These products were proposed to be produced by desulfonation and hydroxylation of the aromatic ring and oxidative cleavage of the azo bond. The partial oxidization of OG molecule to a dihydroxybenzene and dicarboxylic acid intermediate was initiated by the ˙OH radical attack on the naphthyl group of the dye molecule.
Acknowledgements
The authors would like to thank the UAE University Scientific Research Affairs Unit for supporting this work through research project number 02-03-2-11/09.
References
- H. M. Pinheiro, E. Touraud and O. Thomas, Dyes Pigm., 2004, 61, 121–139 CrossRef CAS.
- Y. B. Xie and X. Z. Li, Mater. Chem. Phys., 2006, 95, 39–50 CrossRef CAS.
- Y. Zhiyong, H. Keppner, D. Laub, E. Mielczarski, J. Mielczarski, L. Kiwi-Minsker, A. Renken and J. Kiwi, Appl. Catal., B, 2008, 79, 63–71 CrossRef CAS.
- M. Bettinelli, V. Dallacasa, D. Falcomer, P. Fornasiero, V. Gombac, T. Montini, L. Romanò and A. Speghini, J. Hazard. Mater., 2007, 146, 529–534 CrossRef CAS.
- E. B. Gracien, J. Shen, X. Sun, D. Liu, M. Li, S. Yao and J. Sun, Thin Solid Films, 2007, 515, 5287–5297 CrossRef CAS.
- H. R. Pouretedal, A. Norozi, M. H. Keshavarz and A. Semnani, J. Hazard. Mater., 2009, 162, 674–681 CrossRef CAS.
- R. S. K. Wong, J. Feng, X. Hu and P. L. Yue, J. Environ. Sci. Health, Part A: Toxic/Hazard. Subst. Environ. Eng., 2005, 39, 2583–2595 CrossRef.
- J. Wang, J. Li, Y. Xie, C. Li, G. Han, L. Zhang, R. Xu and X. Zhang, J. Environ. Manage., 2010, 91, 677–684 CrossRef CAS.
- M. A. Rauf, S. B. Bukallah, A. Hamadi, A. Sulaiman and F. Hammadi, Chem. Eng. J., 2007, 129, 167–172 CrossRef CAS.
- Y. Zhu, S. Xu and D. Yi, React. Funct. Polym., 2010, 70, 282–287 CrossRef CAS.
- M. A. Rauf, M. A. Meetani, A. Khaleel and A. Ahmed, Chem. Eng. J., 2010, 157, 373–378 CrossRef CAS.
- A. Khaleel, I. Shehadi and M. Al-Shamisi, J. Non-Cryst. Solids, 2010, 356, 1282–1287 CrossRef CAS.
- M. Stylidi, D. I. Kondarides and X. E. Verykios, Appl. Catal., B, 2004, 47, 189–201 CrossRef CAS.
- K. Tanaka, K. Padermpole and T. Hisanaga, Water Res., 2000, 34, 327–333 CrossRef CAS.
-
M. Al-Shamsi, MSc thesis, UAE University, 2009.
- X.-R. Xu and X.-Z. Li, Sep. Purif. Technol., 2010, 72, 105–111 CrossRef CAS.
- J. Deng, J. Jiang, Y. Zhang, X. Lin, C. Du and Y. Xiong, Appl. Catal., B, 2008, 84, 468–473 CrossRef CAS.
- M. Muthukumar, M. T. Karuppiah and G. B. Raju, Sep. Purif. Technol., 2007, 55, 198–205 CrossRef CAS.
- M. A. Rauf and S. S. Ashraf, Chem. Eng. J., 2009, 151, 10–18 CrossRef CAS.
- S.A. Abo-Farha, J. Am. Sci., 2010, 6, 130–142 Search PubMed.
- M. Karkmaz, E. Puzenat, C. Guillard and J. M. Herrmann, Appl. Catal., B, 2004, 51, 183–194 CrossRef CAS.
- A. S. Özen, V. Aviyente, F. De Proft and P. Geerlings, J. Phys. Chem. A, 2004, 108, 5990–6000 CrossRef.
- T. Chen, Y. Zheng, J.-M. Lin and G. Chen, J. Am. Soc. Mass Spectrom., 2008, 19, 997–1003 CrossRef CAS.
- S. Erdemoglu, S. K. Aksu, F. SayIlkan, B. Izgi, M. Asiltürk, H. SayIlkan, F. Frimmel and S. Güçer, J. Hazard. Mater., 2008, 155, 469–476 CrossRef CAS.
- A. I. del Río, J. Fernández, J. Molina, J. Bonastre and F. Cases, Desalination, 2011, 273, 428–435 CrossRef.
- M. A. Meetani, S. M. Hisaindee, F. Abdullah, S. S. Ashraf and M. A. Rauf, Chemosphere, 2010, 80, 422–427 CrossRef CAS.
- P. Bansal, D. Singh and D. Sud, Sep. Purif. Technol., 2010, 72, 357–365 CrossRef CAS.
- I. K. Konstantinou and T. A. Albanis, Appl. Catal., B, 2004, 49, 1–14 CrossRef CAS.
- R. Vinu, S. U. Akki and G. Madras, J. Hazard. Mater., 2010, 176, 765–773 CrossRef CAS.
|
| This journal is © The Royal Society of Chemistry 2011 |
Click here to see how this site uses Cookies. View our privacy policy here. 
![[double bond, length as m-dash]](https://www.rsc.org/images/entities/char_e001.gif) N– group in the dye molecule, whereas the 475 nm band could be assigned to the n–π* transition of the –N
N– group in the dye molecule, whereas the 475 nm band could be assigned to the n–π* transition of the –N![[double bond, length as m-dash]](https://www.rsc.org/images/entities/char_e001.gif) N– group.16–18 During the degradation process, it was observed that the two characteristic absorption peaks at 330 and 475 nm decreased and almost disappeared during the course of the study. This shows that the chromophore and conjugated system were being destroyed. For degradation studies, the λmax of the dye (475 nm) was chosen for further investigations.
N– group.16–18 During the degradation process, it was observed that the two characteristic absorption peaks at 330 and 475 nm decreased and almost disappeared during the course of the study. This shows that the chromophore and conjugated system were being destroyed. For degradation studies, the λmax of the dye (475 nm) was chosen for further investigations.




![[double bond, length as m-dash]](https://www.rsc.org/images/entities/char_e001.gif) N bond to hydroxyl amines has been observed in a variety of species (S2, S4, S7, S8, S9). Intermediates S1, S3, and S5 showed that ˙OH radical attack was possible at both nitrogen atoms of the azo group with concomitant elimination of a phenyl group. The central atom of the sulfonate functionality was also susceptible to ˙OH radical attack. In this case loss of H2SO4 (S7 → S9), –SO3Na (S9 → S2, OG → S1) and ˙ONa radicals (OG → S11) were detected.25 The detailed mechanism of these processes has been fully discussed in our previous report on the photolytic degradation of Amido Black using UV/H2O2.26
N bond to hydroxyl amines has been observed in a variety of species (S2, S4, S7, S8, S9). Intermediates S1, S3, and S5 showed that ˙OH radical attack was possible at both nitrogen atoms of the azo group with concomitant elimination of a phenyl group. The central atom of the sulfonate functionality was also susceptible to ˙OH radical attack. In this case loss of H2SO4 (S7 → S9), –SO3Na (S9 → S2, OG → S1) and ˙ONa radicals (OG → S11) were detected.25 The detailed mechanism of these processes has been fully discussed in our previous report on the photolytic degradation of Amido Black using UV/H2O2.26
