DOI:
10.1039/C1RA00233C
(Paper)
RSC Adv., 2011,
1, 458-467
Morphology-controlled synthesis and efficient photocatalytic performances of a new promising photocatalyst Sr0.25H1.5Ta2O6·H2O
Received
27th May 2011
, Accepted 31st May 2011
First published on 10th August 2011
Abstract
A new photocatalyst Sr0.25H1.5Ta2O6·H2O (HST) with high surface area was successfully prepared by a facile and mild hydrothermal reaction using Ta2O5·nH2O as a precursor. TEM images revealed that their different morphologies, from nanoplate to nanopolyhedron, were formed under different pH values of the reactive solutions. The formation mechanism of HST was also studied and proposed. Growth of HST nanocrystallites followed a reaction-crystallization model. By analyzing the results of XRD, DRS, XPS, electrochemistry and theoretical calculation, the crystal and electronic structural characterizations of HST was established. Compared with isostructural Sr0.4H1.2Nb2O6·H2O (HSN), the Ta 5d orbitals were the main contribution to the bottom of the conduction band of HST, inducing the energy level more negative while the top of valence band, which was dominated by O 2p states, remained almost unchanged. Due to the more suitable electronic band structure and various morphologies, the photocatalyst showed superior photocatalytic activities for water splitting to generate H2 and for degrading benzene as compared with HSN. The rate of H2 evolution and the conversion ratio of benzene were 81 times and 4 times higher than that of TiO2 (Degussa P25), respectively. The proposed mechanisms for photocatalytic reactions based on the experimental results were discussed.
1. Introduction
Photocatalysis has been considered a promising method to provide solutions for many of the energy and environmental challenges facing the modern world because it provides a simple way to use light to induce chemical transformations.1–3 To accomplish effective photocatalytic water splitting and degradation of organic pollutants, photocatalysts with high activities are indispensable. To date, a series of impressive photocatalysts, which can be generally classified into two categories, have been reported to be active for photocatalytic reaction: organic semiconductors, such as C3N4, poly(azomethine),4,5 and conventional inorganic semiconductors, such as TiO2, niobates, tantalates, and so on.6–9 A lot of effort has been dedicated to explore the high energy crystal facet, such as the TiO2 (001) facet,10–12 and modify the catalysts, such as metal or nonmetal-doped catalysts and loaded co-catalysts.13–15 This interest is due to the fact that these photocatalysts present some disadvantages such as limited activity, high charge carrier recombination rates and rigorous syntheses conditions. Thus, designing and seeking novel photocatalyst with high activity is still a central challenge so far.
Since the layered K4Nb6O17 was reported,16 numerous studies have focused on the niobate and tantalate photocatalysts due to their unique structure and high performance for photocatalytic reaction.17–20 Particularly, in terms of quantum efficiency (QE) the record holder is NiO/NaTaO3![[thin space (1/6-em)]](https://www.rsc.org/images/entities/char_2009.gif) :
:![[thin space (1/6-em)]](https://www.rsc.org/images/entities/char_2009.gif) La, with a QE of 56% for water splitting.21 Due to the limited precursors, they are traditionally synthesized by high-temperature solid-state reactions which often require 1000 °C or above because the starting materials Nb2O5 and Ta2O5 are very stable materials and the solid–solid diffusion is the rate-limiting step in their formation.22–27 Although some nanostructured niobates and tantalates with various morphologies have been prepared via soft-chemical routes using the oxide, alkoxide, and chloride, etc. as a precursor,28–31 the synthesized processes suffer from the limitations of rigorous reaction conditions, high cost, tedious procedures, and non-stoichiometric reactions. In our previous reports, we found for the first time that a series of niobates could be prepared by a novel, economic, and simple method employing Nb2O5·nH2O as a precursor.32,33 Because of the similar physicochemical properties between tantalum and niobium, it can be predicted that this method should also work well for the preparation of nanocrystalline tantalates with various morphologies from Ta2O5·nH2O.
La, with a QE of 56% for water splitting.21 Due to the limited precursors, they are traditionally synthesized by high-temperature solid-state reactions which often require 1000 °C or above because the starting materials Nb2O5 and Ta2O5 are very stable materials and the solid–solid diffusion is the rate-limiting step in their formation.22–27 Although some nanostructured niobates and tantalates with various morphologies have been prepared via soft-chemical routes using the oxide, alkoxide, and chloride, etc. as a precursor,28–31 the synthesized processes suffer from the limitations of rigorous reaction conditions, high cost, tedious procedures, and non-stoichiometric reactions. In our previous reports, we found for the first time that a series of niobates could be prepared by a novel, economic, and simple method employing Nb2O5·nH2O as a precursor.32,33 Because of the similar physicochemical properties between tantalum and niobium, it can be predicted that this method should also work well for the preparation of nanocrystalline tantalates with various morphologies from Ta2O5·nH2O.
In view of the unique properties of metastable phase materials which are difficult to prepare under facile and mild reaction conditions, it is necessary to discuss the structure and the various performances of this relatively stable photocatalyst. In the present work, a new relatively stable photocatalyst would be investigated in detail. (i) New metastable phase tantalates with various morphologies are prepared by a new method and the growth mechanism has been proposed; (ii) the electronic band structure of the catalyst is investigated from experimental and theoretical analysis and compared with isostructural niobate; (iii) the photocatalytic activities on both the water splitting and the degradation of organic pollutants have also been evaluated compared with TiO2 and niobate. These studies can not only enrich our understanding of photocatalysis, but can also give us guidance in the search for a highly efficient photocatalyst.
Herein, a new metastable phase photocatalyst Sr0.25H1.5Ta2O6·H2O (HST), which is prepared by high-temperature solid state and proton-exchange methods traditionally, was successfully prepared by a facile and mild hydrothermal reaction using Ta2O5·nH2O as a precursor. The different morphologies of HST, from nanoplate to nanopolyhedron, were formed under different pH values of the reactive solutions. Furthermore, the electronic structural characterization of HST was determined by density functional theory (DFT). Due to the suitable electronic band structure and various morphologies, HST showed superior photocatalytic activities for water splitting to generate H2 and for degrading benzene as compared with isostructural HSN. They were also much higher than those of TiO2 (Degussa P25). The formation and photocatalytic mechanisms of HST were studied and proposed based on the experimental and theoretical results.
2. Experimental
2.1 Preparation of samples
Analytical grade commercial Ta2O5, Sr(NO3)2, HF acid (40%), and NH3 (aq., 25%) were used as starting materials without further purification. In a typical procedure, Ta2O5·nH2O was prepared by dissolving Ta2O5 in HF acid, and then NH3 (aq.) was added to this Ta–F solution until the pH value of the solution was no less than 9. After centrifuging and washing, Ta2O5·nH2O was obtained. The Ta2O5·nH2O and Sr(NO3)2 in a molar ratio of Ta5+![[thin space (1/6-em)]](https://www.rsc.org/images/entities/char_2009.gif) :
:![[thin space (1/6-em)]](https://www.rsc.org/images/entities/char_2009.gif) Sr2+ = 2
Sr2+ = 2![[thin space (1/6-em)]](https://www.rsc.org/images/entities/char_2009.gif) :
:![[thin space (1/6-em)]](https://www.rsc.org/images/entities/char_2009.gif) 1 were dispersed into 70 mL deionized water, and the resultant mixture was transferred to a 100 mL Teflon-lined stainless steel autoclave. After that, the pH values were adjusted with 4 mol L−1NaOH under vigorous stirring. The autoclave was sealed and heated in an oven at 200 °C for different times under autogenous pressure. After the autoclave was air-cooled to room temperature naturally, the products were centrifuged, washed with deionized water and dried at 60 °C in an oven. The products prepared under different pH values were defined as HST-n (n is the pH value), such as HST-6, HST-8, and so on.
1 were dispersed into 70 mL deionized water, and the resultant mixture was transferred to a 100 mL Teflon-lined stainless steel autoclave. After that, the pH values were adjusted with 4 mol L−1NaOH under vigorous stirring. The autoclave was sealed and heated in an oven at 200 °C for different times under autogenous pressure. After the autoclave was air-cooled to room temperature naturally, the products were centrifuged, washed with deionized water and dried at 60 °C in an oven. The products prepared under different pH values were defined as HST-n (n is the pH value), such as HST-6, HST-8, and so on.
Caution: hydrofluoric acid is extremely corrosive and a contact poison, and it should be handled with extreme care! Hydrofluoric acid solution is stored in Teflon containers in use.
2.2 Characterizations
The as-prepared samples were characterized by powder X-ray diffraction (XRD) on a Bruker D8 Advance X-ray diffractometer operated at 40 kV and 40 mA with Ni-filtered Cu Kα irradiation (λ = 1.5406 Å). Le Bail profile analysis in the Rietica program was used to refine XRD data calibrated against an internal standard (NaCl). The Brunauer–Emmett–Teller (BET) surface area was measured with an ASAP2020M apparatus (Micromeritics Instrument Corp.). X-ray photoelectron spectroscopy (XPS) measurements were performed on a PHI Quantum 2000 XPS system with a monochromatic Al Kα source and a charge neutralizer. Transmission electron microscopy (TEM) images were recorded using a JEOL model JEM 2010 EX microscope at an accelerating voltage of 200 kV. UV–vis diffuse reflectance spectra (UV-vis DRS) were obtained by using a UV-vis spectrophotometer (Varian Cary 500) and the data were converted to Kubelka–Munk (KM) functions. Barium sulfate was used as a referent. Electron spin resonance (ESR) signals of spin-trapped paramagnetic species with 5,5-dimethyl-1-pyrroline N-oxide (DMPO) were recorded with a Brucker A300 spectrometer. A 200 W mercury Xe lamp (Hamamatsu Corp., L9566-02) with a set of cutoff filters and an emission at 254 nm was used as a light source (the light intensity of the mercury Xe lamp at 254 nm is 5.0 mW cm−2. The distance between the lamp and the sensor is 10 cm.).
2.3 Electrochemistry measurement
The working electrode was prepared on indium-tin oxide (ITO) glasses, which were cleaned by sonication in chloroform, acetone and ethanol for 30 min, respectively. The glass was then rinsed with millipore water and kept in isopropanol for 24 h. 50 mg of powder was mixed with 2 mL dimethylformamide under sonication for 30 min to get a slurry. The slurry was spreading onto ITO glass whose side part was previously protected using Scotch tape. After air drying, the electrode was fired at 350 °C for 30 min in air to improve adhesion. A copper wire was connected to the side part of the ITO glass using a conductive tape. Uncoated parts of the electrode were isolated with epoxy resin, and the exposed area of the electrode was 0.25 cm2. Electrochemical measurements were performed in a conventional three electrode cell, using a Pt plate and a saturated Ag/AgCl electrode as counter electrode and reference electrode, respectively. The working electrodes were immersed in a 0.2 M Na2SO4 aqueous solution (pH 6.6) without additive for 30 s before measurement was carried out. For Mott–Schottky experiments, the potential ranged from 0 to 1.0 V (vs.Ag/AgCl), and the perturbation signal was 20 mV with the frequency from 2.5 to 1.2 kHz.
2.4 Theoretical calculations
To study the electronic structure of HST, the density functional theory (DFT) calculations based on the linear combination of atomic orbital (LCAO) were carried out to obtain the information about the band structures and density of states (DOSs). In the calculations, the standard 6-31G basis set was employed for the oxygen atoms. For Sr and Ta atoms, a (5s5p/3s3p) and a (2s2p4d/2s2p2d) basis set with the Hay and Wadt's relativistic effective core potentials (RECPs) were adopted, in which 28 and 68 electrons were incorporated into pseudopotentials, respectively.34,35 To obtain a good prediction of band gap, Becke's three-parameter hybrid functional (B3LYP) were adopted in the calculation, and a supercell consisting of a (2 × 2 × 1) unit cell was employed. In addition, the hydrogen atoms and crystal water were not considered in the calculations since the positions of hydrogen atoms were unresolved experimentally, and accordingly a neutralizing background-charge was introduced into the stage. All band-structures and DOSs were performed using the CRYSTAL program.36
2.5 Evaluation of photocatalytic activity
The procedures for the photocatalytic splitting of pure water were performed in a closed gas-recirculation system and an inner irradiation quartz reaction cell with a 125 W high pressure Hg lamp (the light intensity of the high-pressure Hg lamp at 365 and 254 nm is 3.5 and 2.0 mw cm−2, respectively. The distance between the lamp and the sensor is 1 cm.). Briefly, the reaction was carried out in pure water (50 mg catalyst, 170 mL H2O). The amount of H2 evolved was analyzed with an on-line gas chromatograph (GC112A, Shanghai Precision Scientific Instrument Co, Ltd, TCD, N2carrier).
The photocatalytic oxidation of benzene into carbon dioxide was measured with a fixed bed tubular quartz reactor operated in a single-pass mode. The catalyst (0.3 g, 50–70 mesh) was loaded in the reactor surrounded by four 4 W UV-lamps with a wavelength centered at 254 nm (Philips, TUV 4W/G4 T5, The light intensity at 254 nm is ca. 2.0 mW cm−2). Benzene diluted in a pure oxygen stream was used as the test reactant stream. The flow rate of the reactant stream was kept at 20 mL min−1. The concentrations of benzene and carbon dioxide were simultaneously determined by the flame ionization detector (FID) and thermal conductivity detector (TCD), respectively, with an online gas chromatograph (Agilent 6890N).
The photocatalytic degradation of methyl orange (MO) in an aqueous solution was measured with a quartz tube surrounded by three 4 W UV lamps (Philips, TUV 4W/G4T5). Reaction suspensions were prepared by adding the powder (80 mg) to 160 mL MO solution (20 mg L−1). The suspensions were stirred in the dark for 120 min to ensure adsorption–desorption equilibrium prior to irradiation. All the reaction processes are in presence of O2 flow (20 mL min−1). During irradiation, 3 mL of the suspension was removed at given time intervals for subsequent MO concentration analysis following centrifugation. The MO concentration was analyzed using an UV-vis spectrophotometer (Varian Cary 50).
3. Results and discussion
3.1 Crystal structure
Fig. 1 showed the XRD patterns of the samples prepared at 200 °C under different pH values. When the pH value was 6, the product was an amorphous sample. Upon increasing the pH values, the crystalloid phases appeared and the crystallinity increased. At pH 8–12, the patterns of the as-prepared samples matched well with the Sr0.25H1.5Ta2O6·H2O (HST) (JCPDS: 77–1170, space groupFd-3m). HST was isostructural with Sr0.4H1.2Nb2O6·H2O (HSN), and both samples crystallized in an cubic symmetry.33 No other crystalline by-products were found in the patterns, indicating that the products may be pure Sr0.25H1.5Ta2O6·H2O. The crystallographic structure of HST was a three-dimensional framework built by corner-shared octahedral TaO6 units (Fig. 2). In the TaO6 unit, the metallic atom was surrounded by six oxygen atoms placed at the apex of an octahedron. The Sr atom surrounded by eight oxygen atoms was located at the cavity constructed by TaO6 units. Meanwhile, there were two unique crystallographic O in HST, one bonded to Ta and the other belonging to crystal water or dodecahedral SrO8 unit in the cavities. The lattice parameters of HST, calculated from the Rietveld refinement of the XRD pattern (Fig. 3), were a = b = c = 1.0539 nm. These values differ slightly from the reported values for Sr0.25H1.5Ta2O6·H2O (1.0554 nm),37 which may be attributed to the nanocrystalline nature of HST.28 The average crystallite sizes calculated from the Scherrer equation and the BET surface areas of all samples were shown in Table 1. The average crystallite sizes for samples prepared under different pH values ranged from 18.4 to 52.6 nm. This result would be in good agreement with that from TEM images. At the same time, with increasing the pH values, the BET surface area was decreased and the average pore width was enlarged.
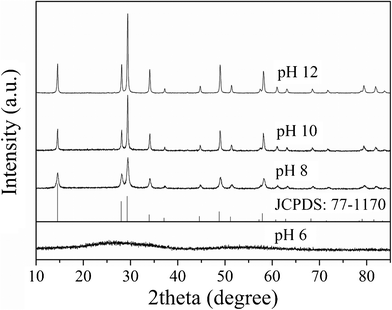 |
| | Fig. 1
XRD patterns of the samples prepared at 200 °C for 48 h under different pH values. | |
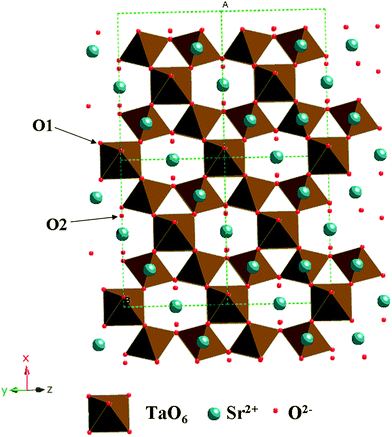 |
| | Fig. 2 Schematic structure of Sr0.25H1.5Ta2O6·H2O. | |
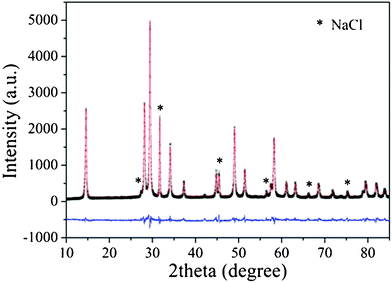 |
| | Fig. 3 Experimental XRD pattern (black), calculated pattern (red), and difference curve (blue) of Sr0.25H1.5Ta2O6·H2O (NaCl as an internal standard). | |
Table 1 Crystallite size, surface area, and pore structure of HST samples prepared under different pH values
| pH value |
Crystallite size/nm |
BET surface area/m2 g−1 |
BJH Desorption average pore width/nm |
Pore structure |
| 8 |
18.4 |
34.9 |
12.6 |
Accumulated porous structure |
| 10 |
34.4 |
24.7 |
21.9 |
| 12 |
52.6 |
21.5 |
31.5 |
3.2 Surface chemical state
XPS measurements were carried out to further investigate the surface chemical states of the as-prepared HST and the results of the typical sample HST-8 were showed in Fig. 4. The XPS survey spectrum, as presented in Fig. 4a, confirmed the existence of Sr, Ta, and O in the sample. No obvious peaks for impurities, except for C, have been observed for all samples. The C element was ascribed to the adventitious hydrocarbon from the XPS instrument itself. The XPS spectra of other samples were similar. As shown in Fig. 4b, the curves of Sr 3d region could be deconvoluted into two peaks for Sr 3d5/2 and Sr 3d3/2, located at around 132.8 eV and 134.6 eV respectively. The spin orbit separation (Δ) of the 3d was 1.8 eV and the ratio of the two peak areas was 3![[thin space (1/6-em)]](https://www.rsc.org/images/entities/char_2009.gif) :
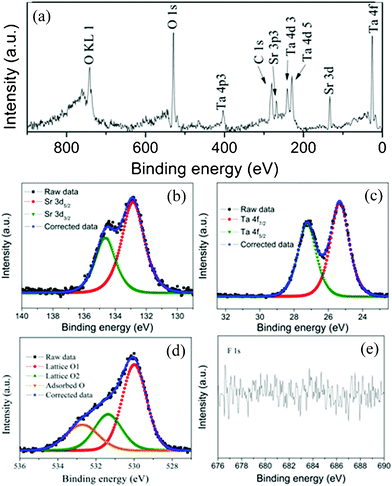
:![[thin space (1/6-em)]](https://www.rsc.org/images/entities/char_2009.gif) 2. These results demonstrated that the chemical state of Sr on the sample is Sr2+. Observation of the Ta 4f spectrum (Fig. 4c), the spin orbit separation of Ta 4f was 1.9 eV and the Ta 4f7/2 core level peak appeared at 25.3 eV, showed that the oxidation state of the Ta element was the same as that of Sr2Ta2O7.38 No other peaks from other valences of Ta were detected. The O 1s XPS spectrum of HST-8 showed a fit to three curve peaks located at 530.0, 531.4, and 532.7 eV, respectively. Two lower binding energy (BE) peaks corresponded to the O 1s core level of the O2− anions in the HST crystal lattice. In these two peaks, the former O was the one bonded to Ta and the latter O belonged to crystal water or dodecahedral SrO8 unit in the cavities built by the corner-shared octahedral TaO6 units. The highest BE peak was attributed to surface adsorbed oxygen, such as hydroxyl species. The result indicated that the catalyst might have an abundance of surface OH groups. The surface OH groups play an important role in the photocatalytic oxidation process since they can react with photogenerated holes to form hydroxyl radicals when excited by UV light.39Fig. 4e showed the high-resolution XPS spectra of the F 1s region, taken on the surface of HST-8. No signal for F 1s was observed. It indicated the F− anion can be thoroughly removed during the preparation process.
2. These results demonstrated that the chemical state of Sr on the sample is Sr2+. Observation of the Ta 4f spectrum (Fig. 4c), the spin orbit separation of Ta 4f was 1.9 eV and the Ta 4f7/2 core level peak appeared at 25.3 eV, showed that the oxidation state of the Ta element was the same as that of Sr2Ta2O7.38 No other peaks from other valences of Ta were detected. The O 1s XPS spectrum of HST-8 showed a fit to three curve peaks located at 530.0, 531.4, and 532.7 eV, respectively. Two lower binding energy (BE) peaks corresponded to the O 1s core level of the O2− anions in the HST crystal lattice. In these two peaks, the former O was the one bonded to Ta and the latter O belonged to crystal water or dodecahedral SrO8 unit in the cavities built by the corner-shared octahedral TaO6 units. The highest BE peak was attributed to surface adsorbed oxygen, such as hydroxyl species. The result indicated that the catalyst might have an abundance of surface OH groups. The surface OH groups play an important role in the photocatalytic oxidation process since they can react with photogenerated holes to form hydroxyl radicals when excited by UV light.39Fig. 4e showed the high-resolution XPS spectra of the F 1s region, taken on the surface of HST-8. No signal for F 1s was observed. It indicated the F− anion can be thoroughly removed during the preparation process.
3.3 Morphology analysis and growth mechanism
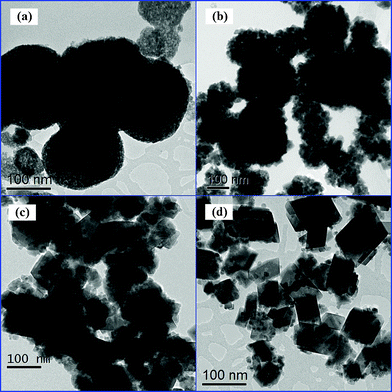
The morphologies of the samples prepared under different pH values were characterized by TEM. Fig. 5a indicated that the product synthesized under pH 6 was composed of numerous nanospheres with an average diameter of ca. 70–150 nm. The nanosphere was an amorphous sphere and the wormhole-like mesoporous structure was observed in HST-6. Upon increasing the pH values, the morphologies of the HST samples changed from nanoplate to nanopolyhedron. It can be observed from the high-magnification TEM images of the products (Fig. 6b) that the nanosphere of HST-8 consisted of nanoplates with sizes of about 10–30 nm, which was in accord with the XRD (see Table 1). At pH 10, the nanoplates started to grow and formed the nanopolyhedra. Simultaneously, the nanosphere was destroyed. However, when the pH value increased to 12, the nanoplates were nearly transformed into the nanopolyhedra. The different particle sizes of HST may be the reason for the different surface areas. When the pH value was no less than 8, the products exhibited high crystallization. HRTEM images clearly displayed the resolved lattice fringes of 0.61 nm, which corresponds to the (111) crystallographic plane of cubic Sr0.25H1.5Ta2O6·H2O structure.
 |
| | Fig. 5
TEM images of the HST samples prepared at 200 °C for 48 h under different pH values: 6 (a), 8 (b), 10 (c), and 12 (d). | |
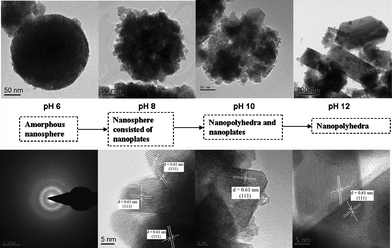 |
| | Fig. 6 High-magnification TEM images of the HST samples prepared at 200 °C for 48 h under different pH values. | |
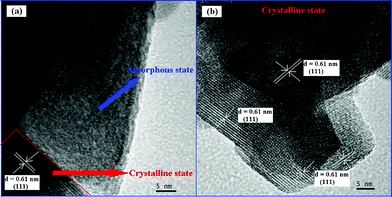
For a complete view of the formation of HST and their growth mechanism, the time-dependent evolutions of their morphologies were elucidated by TEM. The TEM images in Fig. 7a represented that the sample prepared under pH 8 for 24 h was composed of amorphous precursor and crystalline HST. However, when the pH value was adjusted to 10 (Fig. 7b), the sample was a highly crystalline HST and abundant nanoplates with sizes of about 20 nm were formed. It indicated that the effect of the pH value may be similar with that of the time in the synthetic process. Based on the experimental results, we proposed a possible growth mechanism for the formation of HST with different morphologies. Since the precursor used in our synthesis was Ta2O5·nH2O and the different morphologies were formed under different pH values, it indicated that HST may be formed by a reaction-crystallization (RC) process.40 Due to the similar property, the Ta2O5·nH2O dissolved into aqueous solution may be the same as Nb2O5·nH2O under hydrothermal treatment. In this process, the Ta2O5·nH2O reacted with OH− to form water-soluble HxTa6O19(8−x)− (x = 1, 2, or 3) in solution (eqn (1)). Then the unreacted Ta2O5·nH2O may serve as the sites where the heterogeneous nucleation of nanocrystalline Sr0.25H1.5Ta2O6·H2O was formed for the reaction between Sr2+ and HxTa6O19(8−x)− (eqn (2)). The whole reaction process can be briefly expressed as follows:
| | | 3Ta2O5·nH2O + (8−x)OH− → HxTa6O19(8−x)− + (4+3n−x)H2O | (1) |
| | | HxTa6O19(8−x)− + 0.75Sr2+ + (8.5−x)H2O → 3Sr0.25H1.5Ta2O6·H2O + (6.5−x)OH− | (2) |
It was obvious that OH− was crucial for the formation of nanocrystalline Sr0.25H1.5Ta2O6·H2O. In the weak acidic system (pH 6), the HxTa6O19(8−x)− can't be formed and the product may still be the Ta2O5·nH2O. In a low OH− concentration (pH 8), because the eqn (1) was a rate-determining step, the morphology of HST-8 prepared for 48 h was nanoplate and the HST-8 prepared for 24 h was still consisted of amorphous precursor. Upon increasing the pH value, there were more OH− species in the system which would enhance the reaction rate of eqn (1). The total reaction rate would be controlled by eqn (2) and the crystallization process. At the same time, highly alkaline conditions would also make Ta2O5·nH2O quickly dissolve and the quantity of nuclei decrease. These processes would definitely increase the crystallite sizes. Therefore, the morphology of HST was changed from nanoplate to nanopolyhedron with increasing the pH values.
 |
| | Fig. 7
TEM images of the HST samples prepared at 200 °C for 24 h under different pH values: 8 (a) and 10 (b). | |
3.4 Electronic structure
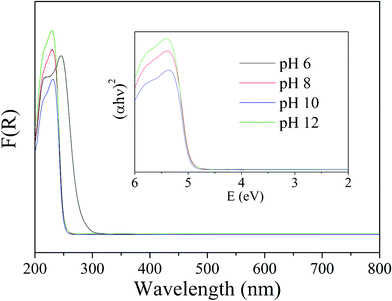
Fig. 8 showed the UV-vis DRS for the samples prepared under different pH values. It could be seen that the samples had a steep absorption edge in the UV region, indicating a band gap transition, from valence band to conduction band. The absorption edges of the samples prepared under different pH values were remarkable different. The absorption edge of HST-6 was located at about 280 nm. It was the same as that of Ta2O5·nH2O, which reaffirms HST-6 was the precursor Ta2O5·nH2O. The absorption edges of the samples prepared under other pH values were located at about 254 nm, corresponding to a band gap of ~4.9 eV estimated from the Kubelka–Munk function versus the energy of the light absorbed. The wide gap of HST might be a drawback. However, it is not a serious problem for driving by a bactericidal lamp (emission wavelength 254 nm). In addition, our other experiments have also shown that HST can be easily modified by doping metal or nonmetal into the crystal lattice, making the photoabsorption edge of the catalyst red shift to longer wavelength, even to the visible light region.
 |
| | Fig. 8
UV-vis
DRS of the samples prepared under different pH values. | |
In order to understand the intrinsic electronic properties of HST, Mott–Sckottky measurements were also performed in darkness using impedance techniques. Reversed sigmoidal plots were observed with an overall shape that is consistent with that of typical n-type semiconductors.41 The flatband potential of HSN estimated by typical Mott–Sckottky plots at various frequencies (Fig. 9a) was −1.0 V vs.SHE. Fig. 9b showed the band structures of HST, HSN and TiO2 derived from DRS and electrochemical measure. The edge energy of the conduction band (ECB) of sample HST was much higher than that of HSN33 and TiO2.42 However, the potential of the valence band (VB) estimated to be 3.80 eV was the same as that of HSN, much lower than that of TiO2 (2.91 eV). It indicated that the HST thermodynamically enabled photocatalytic water splitting into H2 (0 eV) and O2 (1.23 eV). Moreover, the higher energy levels of valence band edges allowed the photogenerated holes to be kinetically more favorable to produce active OH˙ radicals. And the HST might show higher photocatalytic activities on photocatalytic oxidation as compared with TiO2.
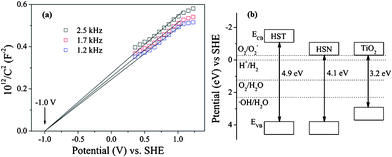 |
| | Fig. 9 Typical Mott–Schottky plots (a) and band structure (b) of HST. | |
To further investigate the electronic structure for Sr0.25H1.5Ta2O6·H2O, theoretical calculations based on the hybrid DFT method were carried out. The calculated band structure was displayed in Fig. 10a and it can be seen clearly that a direct band gap was found at Γ point. The predicted band gap of HST (4.53 eV) was smaller than the experimental value (4.9 eV) due to the inherent deficiency of the DFT method,43 although a portion of Hartree–Fock (HF) exchange (50%)44 was introduced into the B3LYP functional. According to the DOS shown in Fig. 10b, the localized bands appearing in the range between −8 and 0.0 eV were mainly derived from O 2p states, and some obvious components of the Ta atom also can be found in the same region, indicating the covalent interaction between Ta and O atoms. For the conduction band, it was dominated by the 5d state of the Ta atom. Comparing with HSN, the electronic structure of the HST was analogous to the HSN with the valence band (VB) maximum originated from O 2p, since both of them have the same crystal structure. The band gap of HST was ca. 0.7 eV larger than that of HSN judging from the difference between the potential of the Ta 5d and Nb 4d.45 It was in good agreement with the above-mentioned experimental results.
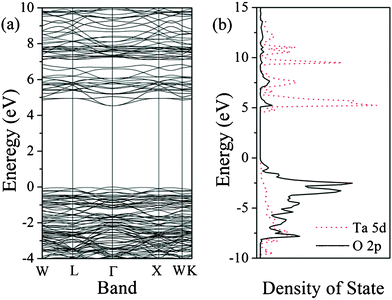 |
| | Fig. 10 Band structure (a) and density of state (b) of sample HST (the top of the valence band was set to zero in the figures). | |
3.5 Photocatalytic properties
HST and HSN exhibit the same crystal structure and similar electronic structure. In our previous reports, HSN exhibited a good photocatalytic performance both in the water splitting and the environmental photocatalysis. Moreover, the conduction band of HST was more negative than that of HSN. Therefore, the HST samples might be used as a good candidate for photocatalytic redox reactions. The photocatalytic activities of the samples without co-catalyst were evaluated by the pure water splitting into H2 under high-pressure Hg lamp irradiations, the results have been compared with that obtained over HSN and TiO2 (Degussa P25) (Fig. 11). At the beginning, the exhibited activity is low, probably due to a catalyst activation process. After the induction period, HST showed higher activity and no noticeable loss of activity was observed during the whole reaction process. The photocatalytic activities of HST samples showed strong dependency on the pH value. A reduction in the efficiency was observed with the increase of the pH value and the decrease of the surface area. It may be due to the mobility of electrons on the nanoplate was much faster than that on the nanopolyhedron. The highest activity was obtained on the sample prepared under pH 8, which shows H2 evolved rate of 480.1 μmol h−1 gcatalyst−1. This value was much higher than that of HSN (91.9 μmol h−1 gcatalyst−1) and TiO2 (5.9 μmol h−1 gcatalyst−1). Since the number of absorbed photons for HST should be smaller than that of HSN and TiO2 under the same experimental condition, and the specific surface areas of HSN and P25 (TiO2) were much higher than that of HST, the higher photocatalytic activity for water splitting observed over HST may be ascribed to its electronic structure, i.e. the composition of the conduction band. Due to the nitrogen as the carrier gas, the evolution of oxygen can't be monitored in this system. The crystal structure and the chemical surface state of HST after photocatalytic splitting of water were also checked by XRD and high-resolution XPS, which showed no observable change after the reaction (Fig. 12). It indicated that HST possesses high chemical stability.
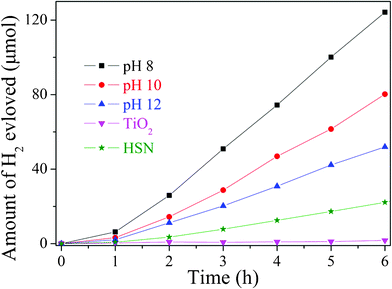 |
| | Fig. 11 Photocatalytic activities of HST, HSN and TiO2 without any co-catalyst (50 mg catalyst, 125 W high-pressure Hg lamp, 170 mL H2O). | |
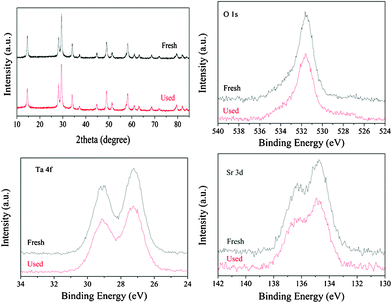 |
| | Fig. 12 Comparison of XRD and high-resolution XPS of HST before and after reaction of water splitting. | |
The turnover number (TON), which is usually introduced to determine if the reaction was one photocatalytic reaction, is defined by the number of reacted molecules to that of an active site.46 However, it is difficult to determine the number of active site for heterogeneous photocatalysts. Here the total amount of the catalyst was adopted as the number of active sites to ensure the reliability of the evaluation.47 For H2 evolution over HST-8, the TON, calculated by eqn (3), was estimated to 4.8 after 10 h of reaction time, while it was only 0.62 and 0.009 for the reaction over HSN and TiO2, respectively. The result further proved that HST sample exhibited much higher photocatalytic activity than HSN sample and TiO2.48
| |  | (3) |
Considering the valence band of HST with strong oxidizing potential, it seemed that HST could also be used to decompose organic contaminants. To confirm this assumption, the photocatalytic degradations of benzene and MO were carried out and the results were shown in Fig. 13. Although the initial benzene concentration was 120 ppm in the reaction system, the catalysts with the different surface areas showed the different adsorption properties for benzene, resulting in the different equilibrium concentrations of benzene. The sample HST-8 exhibited high photocatalytic activity on degrading benzene. The conversion ratio of benzene was about 16% and the production of CO2 was about 100 ppm after the reaction was steady. The mineralization ratio of benzene reached about 95.8%. Commercial TiO2 (Degussa P25), a so-called standard photocatalyst, was also used for comparison and showed only 4% benzene converted and ca. 25 ppm CO2 produced. It indicated that the benzene reaction rate and CO2 production rate of sample HST-8 was 4 times higher than those of TiO2. Furthermore, the photocatalytic activity of TiO2 showed a decreasing trend, which was ascribed to the fact that the photocatalytic active sites were blocked by stable intermediates on the surface of TiO2 during the reaction.49,50 Due to the lower surface area of sample HST-8, their different activity may be explained by the different oxidizing capabilities of holes (h+). Meanwhile, the photocatalytic decomposition of MO over sample HST-8 was also investigated. As shown in Fig. 13b, the adsorption peak of MO at around 464 nm underwent a fairly large decrease with irradiation time increasing and no new absorption peaks appeared. Furthermore, after UV irradiation for 3 h, the total organic carbon (TOC) value of the final solution was determined to be 2.2 ppm, which is about 8.0 ppm less than the calculated value of the initial MO solution (10.2 ppm). It confirmed the mineralization of MO on the sample HST-8.
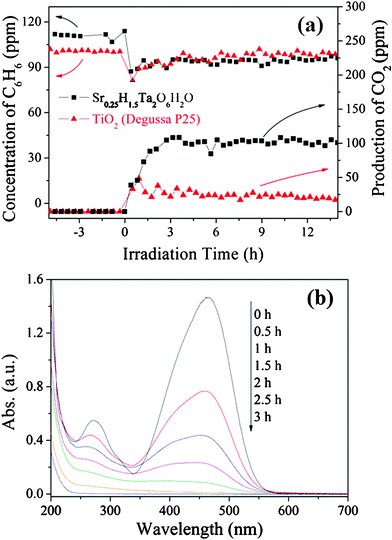 |
| | Fig. 13 Photocatalytic degradation of benzene (a) and MO (b) over HST-8. | |
3.6 Photocatalytic mechanism
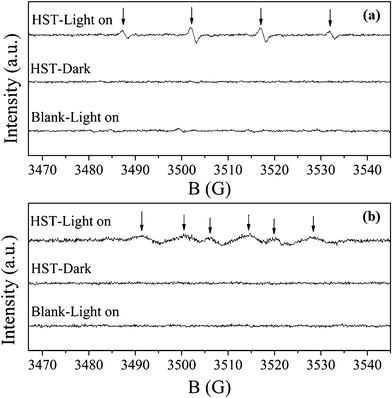
On the basis of the above analysis, HST showed high photocatalytic activities not only for the water splitting to produce H2 but also for the degradation of the organic contaminants. It was interesting to determine the active species in the photocatalytic reaction process. In the previous reports,51,52˙OH, ˙O2− and h+ were commonly suggested as the primary active species in the photocatalytic redox reactions. So, the generation of ˙OH and ˙O2− radicals were examined by ESR spin-trapped with DMPO technique. Quartet characteristic peaks of DMPO–˙OH with intensity 1![[thin space (1/6-em)]](https://www.rsc.org/images/entities/char_2009.gif) :
:![[thin space (1/6-em)]](https://www.rsc.org/images/entities/char_2009.gif) 2
2![[thin space (1/6-em)]](https://www.rsc.org/images/entities/char_2009.gif) :
:![[thin space (1/6-em)]](https://www.rsc.org/images/entities/char_2009.gif) 2
2![[thin space (1/6-em)]](https://www.rsc.org/images/entities/char_2009.gif) :
:![[thin space (1/6-em)]](https://www.rsc.org/images/entities/char_2009.gif) 1 were obviously observed under the UV light irradiation as shown in Fig. 14a, while sextet characteristic peaks of DMPO–˙O2− adduct were also observed in methanol dispersion (Fig. 14b). No signals can be detected without irradiation or catalyst. That revealed the ˙OH and ˙O2− radicals were produced over HST-8 under UV light irradiation. It further confirmed the results derived from the electronic band structure of HST.
1 were obviously observed under the UV light irradiation as shown in Fig. 14a, while sextet characteristic peaks of DMPO–˙O2− adduct were also observed in methanol dispersion (Fig. 14b). No signals can be detected without irradiation or catalyst. That revealed the ˙OH and ˙O2− radicals were produced over HST-8 under UV light irradiation. It further confirmed the results derived from the electronic band structure of HST.
 |
| | Fig. 14
ESR spectra observed for HST-8. The active species are ˙OH (a) and ˙O2− (b) irradiated for 80 s. | |
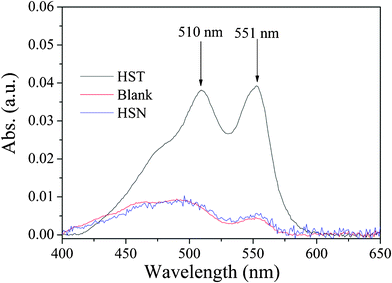
The produced H2O2 in the reaction system was determined by a photometric method using peroxidase (POD).53 This method is based on the POD-catalyzed oxidation by H2O2 of N,N-diethyl-p-phenylenediamine (DPD). The sequence of reaction leads to the formation of the radical cation, DPD+, which forms a fairly stable color, with one absorption maxima at 510 nm and one at 551 nm. The results were shown in Fig. 15. Obviously, there were two absorption peaks, one at ca. 510 and the other at ca. 551 nm, indicated that H2O2 was generated over HST suspension. However, these two peaks were very weak when the reaction was carried out in the absence of catalyst. It is interesting to note that no H2O2 was determined for the reaction carried out over HSN although ˙OH radical was produced over HSN. Analogically, we may conclude that the H2O2 of HST suspension was actually obtained from the ˙O2− radical but not ˙OH radical because the production of H2O2 may come from ˙O2− or ˙OH radical.
Based on the experimental results, the possible mechanism for photocatalytic H2 evolution over HST was proposed, and was illustrated in Fig. 16a. The typical electron-hole (e−–h+) pair on the HST under UV light irradiation was generated at the conduction band and valence band, respectively. The photogenerated electrons of the conduction band made H+ form H2 in the absence of dissolved oxygen. Meanwhile, the photogenerated holes would also react with OH− to produce O2. In addition, the formation of O2 could trap the electron, through the formation of ˙O2− radicals, to transform into H2O2. Therefore, the production of H2 and the formation of H2O2 were a competition process.
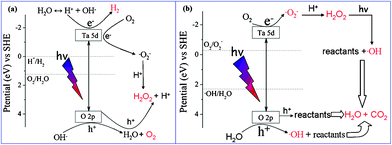 |
| | Fig. 16 Mechanisms of photocatalytic redox reaction over HST. | |
The mechanism of the photocatalytically degraded organic pollutant was similar with that of the photocatalytic reduction process. Because the EVB of HST (3.8 V) was more positive than E0 (˙OH/H2O) (2.3 V vs.SHE) and the ECB of HST (−1.1 V) was more negative than E0 (O2/O2−) (−0.28 V vs.SHE), the ˙OH and ˙O2− radicals were originated from the reaction of photogenerated holes with the surface OH groups (or adsorbed H2O) and the reaction of photoinduced electrons with the absorbed O2, respectively, in the oxygen enrichment system. Then the ˙O2− combined with H+ to yield H2O2 which would be decomposed into ˙OH radicals under UV light irradiation. Subsequently, photocatalytic degradation of organic pollutant would start from the forming ˙OH radical attack. Furthermore, the reactants may also be destroyed by photogenerated holes with strong oxidative ability. In summary, the photocatalytic oxidation reaction over HST may proceed mainly via˙OH and h+ instead of ˙O2−oxidation.
4. Conclusions
A new n-type and direct-bandgap semiconductor photocatalyst Sr0.25H1.5Ta2O6·H2O with high surface area was successfully prepared by a simple, facile, and mild hydrothermal reaction using Ta2O5·nH2O as a precursor. Their different morphologies, from nanoplate to nanopolyhedron, were formed under different pH values of the reactive solutions and the growth mechanism of the nanocrystallites was contributed to the reaction-crystallization model. This method not only offers a simple route for the preparation of metastable phase tantalate, like Sr0.25H1.5Ta2O6·H2O, but also could be applicable to other functional materials traditionally prepared by high temperature solid-state processes and tedious processes. Due to the more suitable electronic band structure, the photocatalyst showed superior photocatalytic activity for water splitting to generate H2 and for degrading benzene under UV light irradiation as compared with TiO2 (Degussa P25). The proposed mechanisms for photocatalytic reactions based on the experimental results were in good agreement with the energy band structure.
Acknowledgements
The work was supported by the National Natural Science Foundation of China (20777011, 90922022), Basic Research Program of China (973 Program: 2007CB613306) and Program for Changjiang Scholars and Innovative Research Team in University (PCSIRT0818).
References
- M. A. Fox and M. T. Dulay, Chem. Rev., 1993, 93, 341–357 CrossRef CAS.
- D. Zhang, G. Li and J. C. Yu, J. Mater. Chem., 2010, 20, 4529–4536 RSC.
- X. Chen, S. Shen, L. Guo and S. S. Mao, Chem. Rev., 2010, 110, 6503–6570 CrossRef CAS.
- X. Wang, K. Maeda, A. Thomas, K. Takanabe, G. Xin, J. M. Carlsson, K. Domen and M. Antonietti, Nat. Mater., 2009, 8, 76–80 CrossRef CAS.
- M. G. Schwab, M. Hamburger, X. Feng, J. Shu, H. W. Spiess, X. Wang, M. Antonietti and K. Mullen, Chem. Commun., 2010, 46, 8932–8934 RSC.
- M. Kitano, M. Matsuoka, M. Ueshima and M. Anpo, Appl. Catal., A, 2007, 325, 1–14 CrossRef CAS.
- M. D. Hernandez-Alonso, F. Fresno, S. Suarez and J. M. Coronado, Energy Environ. Sci., 2009, 2, 1231–1257 CAS.
- S.-I. In, M. G. Nielsen, P. C. K. Vesborg, Y. Hou, B. L. Abrams, T. R. Henriksen, O. Hansen and I. Chorkendorff, Chem. Commun., 2011, 47, 2613–2615 RSC.
- T. Shibata, G. Takanashi, T. Nakamura, K. Fukuda, Y. Ebina and T. Sasaki, Energy Environ. Sci., 2011, 4, 535–542 CAS.
- Z. Jiang, Q. Kuang, Z. Xie and L. Zheng, Adv. Funct. Mater., 2010, 20, 3634–3645 CrossRef CAS.
- H. G. Yang, C. H. Sun, S. Z. Qiao, J. Zou, G. Liu, S. C. Smith, H. M. Cheng and G. Q. Lu, Nature, 2008, 453, 638–641 CrossRef CAS.
- X. Han, Q. Kuang, M. Jin, Z. Xie and L. Zheng, J. Am. Chem. Soc., 2009, 131, 3152–3153 CrossRef CAS.
- K. Maeda, A. Xiong, T. Yoshinaga, T. Ikeda, N. Sakamoto, T. Hisatomi, M. Takashima, D. Lu, M. Kanehara, T. Setoyama, T. Teranishi and K. Domen, Angew. Chem., Int. Ed., 2010, 49, 4096–4099 CAS.
- G. Liu, L. Wang, H. Yang, H. Cheng and G. Lu, J. Mater. Chem., 2010, 20, 831–843 RSC.
- S. Bingham and W. A. Daoud, J. Mater. Chem., 2011, 21, 2041–2050 RSC.
- K. Domen, A. Kudo, M. Shibata, A. Tanaka, K. I. Maruya and T. Onishi, Chem. Commun., 1986, 1706–1707 Search PubMed.
- K. I. Katsumata, C. E. J. Cordonier, T. Shichi and A. Fujishima, J. Am. Chem. Soc., 2009, 131, 3856–3857 CrossRef CAS.
- M. Higashi, R. Abe, T. Takata and K. Domen, Chem. Mater., 2009, 21, 1543–1549 CrossRef CAS.
- H. Kato and A. Kudo, J. Phys. Chem. B, 2001, 105, 4285–4292 CrossRef CAS.
- X. Li and J. Zang, J. Phys. Chem. C, 2009, 113, 19411–19418 CAS.
- H. Kato, K. Asakura and A. Kudo, J. Am. Chem.
Soc., 2003, 125, 3082–3089 CrossRef CAS.
- Y. Miseki, H. Kato and A. Kudo, Energy Environ. Sci., 2009, 2, 306–314 CAS.
- C. Xu, L. Zhen, R. Yang and Z. Wang, J. Am. Chem. Soc., 2007, 129, 15444–15445 CrossRef CAS.
- F. E. Osterloh, Chem. Mater., 2008, 20, 35–54 CrossRef CAS.
- Z. G. Zou, J. H. Ye, K. Sayama and H. Arakawa, Nature, 2001, 414, 625–627 CrossRef CAS.
- A. Iwase, H. Kato and A. Kudo, ChemSusChem, 2009, 2, 873–877 CrossRef CAS.
- X. Li, N. Kikugawa and J. Ye, Chem.–Eur. J., 2009, 15, 3538–3545 CrossRef CAS.
- L. Z. Zhang, I. Djerdj, M. Cao, M. Antonietti and M. Niederberger, Adv. Mater., 2007, 19, 2083–2086 CrossRef CAS.
- L. Zhang, G. Garnweitner, I. Djerdj, M. Antonietti and M. Niederberger, Chem.–Asian J., 2008, 3, 746–752 CrossRef.
- S. Ikeda, M. Fubuki, Y. K. Takahara and M. Matsumura, Appl. Catal., A, 2006, 300, 186–190 CrossRef CAS.
- H. Zhu, Z. Zheng, X. Gao, Y. Huang, Z. Yan, J. Zou, H. Yin, Q. Zou, S. H. Kable, J. Zhao, Y. Xi, W. N. Martens and R. L. Frost, J. Am. Chem. Soc., 2006, 128, 2373–2384 CrossRef CAS.
- S. Liang, L. Wu, J. Bi, W. Wang, J. Gao, Z. Li and X. Fu, Chem. Commun., 2010, 46, 1446–1448 RSC.
- S. Liang, X. Wang, Y. Chen, J. Zhu, Y. Zhang, X. Wang, Z. Li and L. Wu, Nanoscale, 2010, 2, 2262–2268 RSC.
- S. Dall'Olio, R. Dovesi and R. Resta, Phys. Rev. B: Condens. Matter, 1997, 56, 10105–10114 CrossRef CAS.
- S. Piskunov, E. Heifets, R. I. Eglitis and G. Borstel, Comput. Mater. Sci., 2004, 29, 165–178 CrossRef CAS.
-
V. R. Saunders, R. Dovesi, C. Roetti, M. Causa, N. M. Harrison, R. Orlando, and C. M. Zicovich-Wilson, CRYSTAL98 User’s Manual, University of Torino, Torino, 1998 Search PubMed.
- D. Groult, C. Michel and B. Raveau, J. Inorg. Nucl. Chem., 1975, 37, 2203–2205 CrossRef CAS.
- V. V. Atuchin, J. C. Grivel and Z. Zhang, Chem. Phys., 2009, 360, 74–78 CrossRef CAS.
- X. Fu, X. Wang, Z. Ding, D. Y. C. Leung, Z. Zhang, J. Long, W. Zhang, Z. Li and X. Fu, Appl. Catal., B, 2009, 91, 67–72 CrossRef CAS.
- J. Yu, J. C. Yu, W. Ho, L. Wu and X. Wang, J. Am. Chem. Soc., 2004, 126, 3422–3423 CrossRef CAS.
- X. Yang, A. Wolcott, G. Wang, A. Sobo, R. C. Fitzmorris, F. Qian, J. Z. Zhang and Y. Li, Nano Lett., 2009, 9, 2331–2336 CrossRef CAS.
- Y. Xu and M. A. A. Schoonen, Am. Mineral., 2000, 85, 543–556 CAS.
- Z. Li, H. Dong, Y. Zhang, T. Dong, X. Wang, J. Li and X. Fu, J. Phys. Chem. C, 2008, 112, 16046–16051 CAS.
- Y. Zhang, W. Lin, Y. Li, K. Ding and J. Li, J. Phys. Chem. B, 2005, 109, 19270–19277 CrossRef CAS.
- Y. Hosogi, Y. Shimodaira, H. Kato, H. Kobayashi and A. Kudo, Chem. Mater., 2008, 20, 1299–1307 CrossRef CAS.
- N. Serpone, A. Salinaro, A. Emeline and V. Ryabchuk, J. Photochem. Photobiol., A, 2000, 130, 83–94 CrossRef CAS.
- A. Kudo and Y. Miseki, Chem. Soc. Rev., 2009, 38, 253–278 RSC.
- J. Tang, Z. Zou and J. Ye, J. Phys. Chem. B, 2003, 107, 14265–14269 CrossRef CAS.
- J. Huang, X. Wang, Y. Hou, X. Chen, L. Wu and X. Fu, Environ. Sci. Technol., 2008, 42, 7387–7391 CrossRef CAS.
- Y. Hou, X. Wang, L. Wu, Z. Ding and X. Fu, Environ. Sci. Technol., 2006, 40, 5799–5803 CrossRef CAS.
- C. Chen, W. Ma and J. Zhao, Chem. Soc. Rev., 2010, 39, 4206–4219 RSC.
- A. Fujishima, X. Zhang and D. A. Tryk, Surf. Sci. Rep., 2008, 63, 515–582 CrossRef CAS.
- H. Bader, V. Sturzenegger and J. Hoigné, Water Res., 1988, 22, 1109–1115 CrossRef CAS.
|
| This journal is © The Royal Society of Chemistry 2011 |
Click here to see how this site uses Cookies. View our privacy policy here. ![[thin space (1/6-em)]](https://www.rsc.org/images/entities/char_2009.gif) :
:![[thin space (1/6-em)]](https://www.rsc.org/images/entities/char_2009.gif) La, with a QE of 56% for water splitting.21 Due to the limited precursors, they are traditionally synthesized by high-temperature solid-state reactions which often require 1000 °C or above because the starting materials Nb2O5 and Ta2O5 are very stable materials and the solid–solid diffusion is the rate-limiting step in their formation.22–27 Although some nanostructured niobates and tantalates with various morphologies have been prepared via soft-chemical routes using the oxide, alkoxide, and chloride, etc. as a precursor,28–31 the synthesized processes suffer from the limitations of rigorous reaction conditions, high cost, tedious procedures, and non-stoichiometric reactions. In our previous reports, we found for the first time that a series of niobates could be prepared by a novel, economic, and simple method employing Nb2O5·nH2O as a precursor.32,33 Because of the similar physicochemical properties between tantalum and niobium, it can be predicted that this method should also work well for the preparation of nanocrystalline tantalates with various morphologies from Ta2O5·nH2O.
La, with a QE of 56% for water splitting.21 Due to the limited precursors, they are traditionally synthesized by high-temperature solid-state reactions which often require 1000 °C or above because the starting materials Nb2O5 and Ta2O5 are very stable materials and the solid–solid diffusion is the rate-limiting step in their formation.22–27 Although some nanostructured niobates and tantalates with various morphologies have been prepared via soft-chemical routes using the oxide, alkoxide, and chloride, etc. as a precursor,28–31 the synthesized processes suffer from the limitations of rigorous reaction conditions, high cost, tedious procedures, and non-stoichiometric reactions. In our previous reports, we found for the first time that a series of niobates could be prepared by a novel, economic, and simple method employing Nb2O5·nH2O as a precursor.32,33 Because of the similar physicochemical properties between tantalum and niobium, it can be predicted that this method should also work well for the preparation of nanocrystalline tantalates with various morphologies from Ta2O5·nH2O.![[thin space (1/6-em)]](https://www.rsc.org/images/entities/char_2009.gif) :
:![[thin space (1/6-em)]](https://www.rsc.org/images/entities/char_2009.gif) Sr2+ = 2
Sr2+ = 2![[thin space (1/6-em)]](https://www.rsc.org/images/entities/char_2009.gif) :
:![[thin space (1/6-em)]](https://www.rsc.org/images/entities/char_2009.gif) 1 were dispersed into 70 mL deionized water, and the resultant mixture was transferred to a 100 mL Teflon-lined stainless steel autoclave. After that, the pH values were adjusted with 4 mol L−1NaOH under vigorous stirring. The autoclave was sealed and heated in an oven at 200 °C for different times under autogenous pressure. After the autoclave was air-cooled to room temperature naturally, the products were centrifuged, washed with deionized water and dried at 60 °C in an oven. The products prepared under different pH values were defined as HST-n (n is the pH value), such as HST-6, HST-8, and so on.
1 were dispersed into 70 mL deionized water, and the resultant mixture was transferred to a 100 mL Teflon-lined stainless steel autoclave. After that, the pH values were adjusted with 4 mol L−1NaOH under vigorous stirring. The autoclave was sealed and heated in an oven at 200 °C for different times under autogenous pressure. After the autoclave was air-cooled to room temperature naturally, the products were centrifuged, washed with deionized water and dried at 60 °C in an oven. The products prepared under different pH values were defined as HST-n (n is the pH value), such as HST-6, HST-8, and so on.


![[thin space (1/6-em)]](https://www.rsc.org/images/entities/char_2009.gif) :
:![[thin space (1/6-em)]](https://www.rsc.org/images/entities/char_2009.gif) 2. These results demonstrated that the chemical state of Sr on the sample is Sr2+. Observation of the Ta 4f spectrum (Fig. 4c), the spin orbit separation of Ta 4f was 1.9 eV and the Ta 4f7/2 core level peak appeared at 25.3 eV, showed that the oxidation state of the Ta element was the same as that of Sr2Ta2O7.38 No other peaks from other valences of Ta were detected. The O 1s XPS spectrum of HST-8 showed a fit to three curve peaks located at 530.0, 531.4, and 532.7 eV, respectively. Two lower binding energy (BE) peaks corresponded to the O 1s core level of the O2− anions in the HST crystal lattice. In these two peaks, the former O was the one bonded to Ta and the latter O belonged to crystal water or dodecahedral SrO8 unit in the cavities built by the corner-shared octahedral TaO6 units. The highest BE peak was attributed to surface adsorbed oxygen, such as hydroxyl species. The result indicated that the catalyst might have an abundance of surface OH groups. The surface OH groups play an important role in the photocatalytic oxidation process since they can react with photogenerated holes to form hydroxyl radicals when excited by UV light.39Fig. 4e showed the high-resolution XPS spectra of the F 1s region, taken on the surface of HST-8. No signal for F 1s was observed. It indicated the F− anion can be thoroughly removed during the preparation process.
2. These results demonstrated that the chemical state of Sr on the sample is Sr2+. Observation of the Ta 4f spectrum (Fig. 4c), the spin orbit separation of Ta 4f was 1.9 eV and the Ta 4f7/2 core level peak appeared at 25.3 eV, showed that the oxidation state of the Ta element was the same as that of Sr2Ta2O7.38 No other peaks from other valences of Ta were detected. The O 1s XPS spectrum of HST-8 showed a fit to three curve peaks located at 530.0, 531.4, and 532.7 eV, respectively. Two lower binding energy (BE) peaks corresponded to the O 1s core level of the O2− anions in the HST crystal lattice. In these two peaks, the former O was the one bonded to Ta and the latter O belonged to crystal water or dodecahedral SrO8 unit in the cavities built by the corner-shared octahedral TaO6 units. The highest BE peak was attributed to surface adsorbed oxygen, such as hydroxyl species. The result indicated that the catalyst might have an abundance of surface OH groups. The surface OH groups play an important role in the photocatalytic oxidation process since they can react with photogenerated holes to form hydroxyl radicals when excited by UV light.39Fig. 4e showed the high-resolution XPS spectra of the F 1s region, taken on the surface of HST-8. No signal for F 1s was observed. It indicated the F− anion can be thoroughly removed during the preparation process.


![[thin space (1/6-em)]](https://www.rsc.org/images/entities/char_2009.gif) :
:![[thin space (1/6-em)]](https://www.rsc.org/images/entities/char_2009.gif) 2
2![[thin space (1/6-em)]](https://www.rsc.org/images/entities/char_2009.gif) :
:![[thin space (1/6-em)]](https://www.rsc.org/images/entities/char_2009.gif) 2
2![[thin space (1/6-em)]](https://www.rsc.org/images/entities/char_2009.gif) :
:![[thin space (1/6-em)]](https://www.rsc.org/images/entities/char_2009.gif) 1 were obviously observed under the UV light irradiation as shown in Fig. 14a, while sextet characteristic peaks of DMPO–˙O2− adduct were also observed in methanol dispersion (Fig. 14b). No signals can be detected without irradiation or catalyst. That revealed the ˙OH and ˙O2− radicals were produced over HST-8 under UV light irradiation. It further confirmed the results derived from the electronic band structure of HST.
1 were obviously observed under the UV light irradiation as shown in Fig. 14a, while sextet characteristic peaks of DMPO–˙O2− adduct were also observed in methanol dispersion (Fig. 14b). No signals can be detected without irradiation or catalyst. That revealed the ˙OH and ˙O2− radicals were produced over HST-8 under UV light irradiation. It further confirmed the results derived from the electronic band structure of HST.

