Synthesis of a new nanocrystalline titanium aluminum fluoride phase by reaction of Ti2AlC with hydrofluoric acid†
Michael
Naguib
ab,
Volker
Presser
ab,
Nina
Lane
a,
Darin
Tallman
a,
Yury
Gogotsi
ab,
Jun
Lu
c,
Lars
Hultman
c and
Michel W.
Barsoum
*a
aDepartment of Materials Science & Engineering, Drexel University, Philadelphia, PA 19104, USA. E-mail: barsoumw@drexel.edu
bA. J. Drexel Nanotechnology Institute, Drexel University, Philadelphia, PA 19104, USA
cThin Film Physics Division, Department of Physics (IFM), Linköping University, S-583 31, Linköping, Sweden
First published on 6th October 2011
Abstract
A new nanocrystalline phase of titanium aluminum fluoride, with a stoichiometry of Ti2AlF9—exact stoichiometry measured herein is Ti2.1Al0.9F9,—was synthesized by the fluorination of Ti2AlC in anhydrous hydrofluoric acid at 55 °C for 2 h. The results from X-ray diffraction, scanning and high-resolution transmission electron microscopy and selected area diffraction, together with crystal structure solution via simulated annealing, confirmed the formation of a nanocrystalline material with a trigonal structure belonging to the R3 space group. The structure can also be viewed as being comprised of corner-sharing octahedra that are arranged in a distorted simple cubic arrangement. Thermogravimetric analysis, in argon, indicates that this phase is stable up to ≈ 850 °C. Density functional theory calculations estimate the band gap to be ≈ 5 eV and the bulk modulus to be ≈ 109 GPa.
1. Introduction
Many properties of metal fluorides differ from related metal oxides or carbides, because of their high Lewis acidities, low refractive indices (1.33–1.60), and a wide wavelength window for light transmission (100–15 000 nm). Metal fluorides find widespread applications as catalysts, optical coatings, transparent ceramics, and high energy-density electrodes in Li ion batteries.1–4 With the prominent exception of CaF2—the principal source of HF—all other metal fluorides do not (or no longer) occur in sufficient abundance in nature—especially not the important aluminum flux agent cryolite (Na3AlF6).3 However, unlike many metal oxides and carbides,5 the synthesis of metal fluorides can usually be carried out at low or even room temperature, which in turn offers unique synthesis routes with relatively low expenditure of energy.6 In particular, aluminum fluoride (AlF3) attracted interest not only because of its use for Al production2 and the glass industry,7 but also as an anti-caries agent in dentistry.8 The most common Ti-ternary fluoride is potassium fluorotitanate, K2TiF6, which is used as a flux agent during the forging of Al or Ti.9The main motivation of this study was to evaluate the reactivity of Ti2AlC with anhydrous HF. The former is a member of the so-called MAX phase family of ternary carbides and nitrides governed by the general formula Mn + 1AXn, where n = 1, 2, or 3, M is an early transition metal, A is an A-group element (mostly groups 13 and 14), and X is carbon and/or nitrogen.10 The MAX phases are layered hexagonal nanolaminates (space groupP63/mmc) with two formula units per unit cell. In the crystal structure, near close-packed M-atom layers are interleaved with layers of group A elements with the X atoms filling the octahedral sites between the M atoms. The MAX phases have attracted much attention recently because some of them combine some of the best attributes of ceramics and metals. Most notably, Ti2AlC has excellent oxidation resistance, high elastic moduli and strengths, chemical stability, excellent thermal shock resistance, good machinability and a high ratio of fracture toughness to strength.11 As shown in recent studies,12,13 the layered structure of the MAX phases makes them highly susceptible to selective etching and with the large number of MAX phases with various chemical compositions in mind, this offers the possibility of templated synthesis of a large variety of new compounds.
In this study we report, to the best of our knowledge, for the first time on a new trigonal, nanocrystalline ternary titanium aluminum fluoride phase with an approximate chemistry of Ti2.1Al0.9F9. We exemplify HF treatment on Ti2AlC as one common member of the vast MAX phase family to illustrate the potential of metal fluoride synthesis viaHF treatment.
2. Experimental
To synthesize this new phase, 10 g Ti2AlC powder (−325 mesh with average particle size of 17 μm, >92 wt% purity, 3-ONE-2, Voorhees, USA) was fluorinated using 37 g of anhydrous hydrofluoric acid, HF (HF![[thin space (1/6-em)]](https://www.rsc.org/images/entities/char_2009.gif) :
:![[thin space (1/6-em)]](https://www.rsc.org/images/entities/char_2009.gif) Ti2AlC ∼27
Ti2AlC ∼27![[thin space (1/6-em)]](https://www.rsc.org/images/entities/char_2009.gif) :
:![[thin space (1/6-em)]](https://www.rsc.org/images/entities/char_2009.gif) 1 molar ratio) at 55 °C for 2 h. The temperature of 55 °C was determined to be the onset temperature for the reaction and was determined by carefully increasing the temperature from room temperature and monitoring gas formation (the fluorination was done by F2ChemTech, Allentown-PA, USA). Fourier transform infrared spectroscopy—FTIR—(Perkin Elmer Spectrum 100 FTIR, Shelton-CT, USA) was used to analyze the gaseous reaction products during the fluorination reaction. The resultant material was characterized by X-ray diffraction (XRD) using a powder diffractometer (Siemens D500, Bruker AXS, Karlsruhe, Germany) operating with Cu-Kα radiation (step scan 0.02°, 1 s per step). Si powder (99 wt% purity, Alfa Aesar, Ward Hill, USA) was used as an internal standard.
1 molar ratio) at 55 °C for 2 h. The temperature of 55 °C was determined to be the onset temperature for the reaction and was determined by carefully increasing the temperature from room temperature and monitoring gas formation (the fluorination was done by F2ChemTech, Allentown-PA, USA). Fourier transform infrared spectroscopy—FTIR—(Perkin Elmer Spectrum 100 FTIR, Shelton-CT, USA) was used to analyze the gaseous reaction products during the fluorination reaction. The resultant material was characterized by X-ray diffraction (XRD) using a powder diffractometer (Siemens D500, Bruker AXS, Karlsruhe, Germany) operating with Cu-Kα radiation (step scan 0.02°, 1 s per step). Si powder (99 wt% purity, Alfa Aesar, Ward Hill, USA) was used as an internal standard.
A scanning electron microscope, SEM, (Supra 50VP, Zeiss, Oberkochen, Germany) equipped with an energy-dispersive spectrometer, (EDS; Oxford Inca X-Sight, Oxfordshire, UK) was used to investigate chemical composition and the morphology of the particles formed after the reaction. Differential scanning calorimetry (DSC) analysis was carried out on powder samples in a simultaneous thermogravimetric analysis TGA/DSC unit (Netzsch STA 449C Jupiter, Selb, Germany) in ultrahigh pure Ar (200 ml min−1) in a platinum crucible. The sample was heated at 10 °C min−1 to 1200 °C and held at that temperature for 10 min before cooling to room temperature.
Transmission electron microscopy, TEM, (FEI, Tecnai G2 TF20UT FEG, The Netherlands) operating at 200 kV was used for high-resolution imaging and selected area electron diffraction (SAED). A multi-scan CCD digital camera was used to capture the images. Elemental analysis in the TEM was carried out using an ultra-thin window X-ray energy dispersive spectrometer. The TEM samples were prepared by depositing flakes, suspended in isopropanol, on a lacey-carbon coated copper grid (200 mesh).
The crystal structure was determined using TOPAS4 (Bruker AXS, Karlsruhe, Germany). Based on the fundamental parameter approach (FPA),14 the instrumental parameters (e.g., broadening, offset) were derived from measurements of a Si reference. From the diffractograms, the peak positions and intensities were extracted via whole-pattern fitting with the Pawley method15 yielding results in agreement with the LeBail method.16 Based on the space group identified from indexing, the derived unit cell dimensions and peak intensities were used for structure solutions, based on whole-profile fitting simulated annealing.17
Ab initio calculations, based on density functional theory (DFT), were performed using the Perdew–Burke–Eruzerhof (PBE) generalized gradient approximation (GGA),18 with a plane wave cutoff of 400 eV and a 9 × 9 × 9 Γ-centered k-point grid, as implemented in the VASP software. For Ti, the semi-core 3p states were treated as valence electrons. To represent the Ti and Al positions, a unit cell—with one out of the three Al/Ti positions [(⅓, ⅔, z), (0, 0, z + ⅓), or (⅔, ⅓, z − ⅓)] filled with an Al atom—was used. Computations of the electronic properties and structural parameters were carried out with calculations of the total density of states (DOS) and energy minimization through the relaxation of atomic positions and c/a ratio for a range of fixed volumes. The equilibrium volume and bulk moduli were obtained with the modified Morse equation of state fit of the total energy as a function of volume.19
3. Results and discussion
The XRD patterns (Fig. 1a–b) show a significant diminution of Ti2AlC-related Bragg peaks after HF treatment and the formation of another crystalline phase. To the best of our knowledge, the powder diffraction pattern of that phase has never been reported before and neither XRD databases (PDF-2/ICSD) nor the thoroughly searched literature yielded a match. Comparison with literature data shows that the peaks do not match the peaks of TiF2, TiF3, TiF4, AlF320–24 or TiOF2.25 It is thus reasonable to conclude that it is a new phase, with an unknown crystal structure.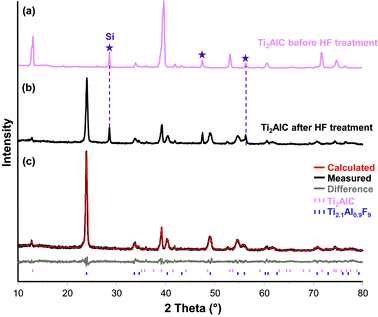 | ||
| Fig. 1 X-Ray pattern of Ti2AlC (a) before and, (b) after HF treatment. After fluorination, low intensity peaks belonging to not completely reacted carbide can be seen. Note the peak broadening of the new phase compared to the precursor or the Si reference. (c) Measured and calculated diffraction patterns of Ti2.1Al0.9F9 with <10 wt% residual Ti2AlC. The lowest line shows the difference between the calculated and measured intensities. | ||
Compared to either the MAX phase precursor or the Si reference, significant peak broadening was observed for this new phase. Deconvolution of the XRD pattern did not indicate the presence of residual strains.26 The broadening of the Bragg reflections can, thus, be explained by a finite domain size; as discussed later, the nanocrystalline nature of this new compound was confirmed by TEM. The broadening corresponds to an average coherence length, or domain size, of ≈ 15 nm calculated from the integral breadth.27
Pawley fitting based on 21 hkl reflections in the angular 2θ range, between 10 and 80° (3501 data points), yielded a profile value of Rwp = 11.14, Rexp = 8.86, and a goodness of fit, GOF, = 1.26 (Table 1; for definitions see ref. 28). The structure was solved via simulated annealing (cf.ref. 29) with 3 degrees of freedom (x, y, z) for all atoms. When the final calculated powder pattern and the measured diffractograms were compared (Fig. 1c) the agreement between them was found to be excellent.
| Parameter | Value |
|---|---|
| GOF | 1.42 |
| R exp | 8.88 |
| R′exp | 12.77 |
| R wp | 11.14 |
| R′wp | 17.22 |
| R p | 8.51 |
| R′p | 18.51 |
| DB | 1.36 |
As no additional data (e.g., from nuclear magnetic resonance spectroscopy) was available, and despite their great likelihood, not even MF6 octahedra were assumed at the start of the simulation. All atoms were moved individually starting from 0, 0, 0 = x, y, z. Using more than 1 atom per element (i.e., 1 × Ti, 1 × Al, and 1 × F per unit cell) led to converging atomic positions overlapping on a level smaller than their radii. This is why all further refinement was carried out using a 15 parameter model (3 fractional indexes, 6 Ti/Al–F distances and 6 bond angles) of restrained TiF6 octahedra, which were within ±2.8% of the unrestrained fit. The results are presented in Fig. 2 and Tables 2–4. The x and y coordinates of the Ti and Al atoms converged on special positions (0.3334 and 0.6657) and were set to ⅓ and ⅔, respectively. Fitting other ternary fluorides, such as ABF6 (ref. 1, 30, 31), did not yield as good an agreement between calculated and measured patterns.
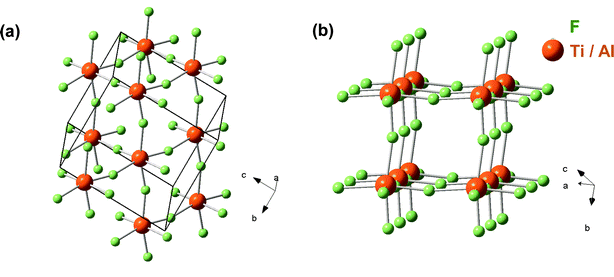 | ||
| Fig. 2 Unit cell of Ti2AlF9 (a) and the cellular MF-sublattice (b). Note that Ti and Al atoms occupy the same positions in the structure. | ||
| Formula | Ti2AlC | Ti2.1Al0.9F9 | |
|---|---|---|---|
| Formula weight (g mol−1) | 134.753 | 295.817 | |
| Space group | P63/mmc | R3 | |
| Crystal system | Hexagonal | Trigonal | |
| a/(Å) | 2.968 | 5.3190 | 5.42* |
| c/(Å) | 13.224 | 6.2609 | 6.71* |
| c/a | 4.45 | 1.18 | 1.24* |
| V (Å3) | 100.88 | 153.40 | 171.31* |
| Bulk modulus (GPa) | 18640 | – | 109* |
| Formula units per unit cell | 2 | 6 | |
| Calc. density (g cm−3) | 4.2 | 3.4 | 3.04* |
| Lin. absorption μ (cm−1) | 640.1 | 239.9 | |
| Atom | SOF | x/a | y/b | z/c | U (Å2) |
|---|---|---|---|---|---|
| F1 | 1 | −0.18975 | 0.18975 | −0.08888 | 1.783 |
| Ti1 | 0.71 | 1/3 | 2/3 | 0.43142 | 0.879 |
| Al1 | 0.29 | 1/3 | 2/3 | 0.43142 | 0.614 |
| Atom 1 | Atom 2 | Distance 1–2 (Å) | Atom 3 | Distance 1–3 (Å) | Angle 2–1–3 (°) |
|---|---|---|---|---|---|
| F1 | Ti1|Al1 | 1.7664 | Ti1|Al1 | 1.9738 | 166.16 |
| Ti1|Al1 | 1.7664 | F1 | 2.2912 | 49.57 | |
| Ti1|Al1 | 1.7664 | F1 | 2.2912 | 49.57 | |
| Ti1|Al1 | 1.9738 | F1 | 2.2912 | 140.09 | |
| Ti1|Al1 | 1.9738 | F1 | 2.2912 | 140.09 | |
| F1 | 2.2912 | F1 | 2.2912 | 60.00 | |
| Ti1|Al1 | F1 | 1.7664 | F1 | 1.7664 | 80.87 |
| F1 | 1.7664 | F1 | 1.7664 | 80.87 | |
| F1 | 1.7664 | F1 | 1.9738 | 88.63 | |
| F1 | 1.7664 | F1 | 1.9738 | 88.63 | |
| F1 | 1.7664 | F1 | 1.9738 | 166.16 | |
| F1 | 1.7664 | F1 | 1.7664 | 80.87 | |
| F1 | 1.7664 | F1 | 1.9738 | 88.63 | |
| F1 | 1.7664 | F1 | 1.9738 | 166.16 | |
| F1 | 1.7664 | F1 | 1.9738 | 88.63 | |
| F1 | 1.7664 | F1 | 1.9738 | 166.16 | |
| F1 | 1.7664 | F1 | 1.9738 | 88.63 | |
| F1 | 1.7664 | F1 | 1.9738 | 88.63 | |
| F1 | 1.9738 | F1 | 1.9738 | 100.18 | |
| F1 | 1.9738 | F1 | 1.9738 | 100.18 | |
| F1 | 1.9738 | F1 | 1.9738 | 100.18 |
The virtual starting temperature for the simulated annealing (not to be confused with sample temperature; cf.ref. 29) was 100 K. Not surprisingly, the atoms were observed to quickly move in a fashion that formed distorted MF6 octahedra, where M was either Ti or Al. A good GOF was only obtained after the atomic fractional positions of Al and Ti converged, that is, excluding either Ti or Al to be present in the inter-octahedral positions in-between the MF6 entities. Refinement was also carried out assuming the site occupancy factor, SOF, of Al plus Ti to unity. After ∼3.2 million moves, the structure was solved and the calculated and measured positions and intensities for Ti2.1Al0.9F9 agreed well. The refined structure, shown in Fig. 2a and b, is built out of slightly distorted MF6 octahedra with an average Ti/Al–F bonding distance of ∼1.8 Å. The structure can be understood as a distorted simple cubic arrangement of (Ti3 − xAlx)F6 octahedra, where x is ≈ 1 (Fig. 2b). Compared to other metal fluorides—especially the stoichiometrically comparable AM2F11 type structures1—the structure proposed herein is less densely packed and more reminiscent of the distorted Besenstielpackung-like TiF4 structure.21
Compensating for the shared atomic position of Al and Ti, the Ti2.1Al0.9F9 structure translates into a Ti![[thin space (1/6-em)]](https://www.rsc.org/images/entities/char_2009.gif) :
:![[thin space (1/6-em)]](https://www.rsc.org/images/entities/char_2009.gif) Al
Al![[thin space (1/6-em)]](https://www.rsc.org/images/entities/char_2009.gif) :
:![[thin space (1/6-em)]](https://www.rsc.org/images/entities/char_2009.gif) F ratio ∼2.3
F ratio ∼2.3![[thin space (1/6-em)]](https://www.rsc.org/images/entities/char_2009.gif) :
:![[thin space (1/6-em)]](https://www.rsc.org/images/entities/char_2009.gif) 1
1![[thin space (1/6-em)]](https://www.rsc.org/images/entities/char_2009.gif) :
:![[thin space (1/6-em)]](https://www.rsc.org/images/entities/char_2009.gif) 10, which is close to the stoichiometry derived from EDSviz. 2.1
10, which is close to the stoichiometry derived from EDSviz. 2.1![[thin space (1/6-em)]](https://www.rsc.org/images/entities/char_2009.gif) :
:![[thin space (1/6-em)]](https://www.rsc.org/images/entities/char_2009.gif) 1.0
1.0![[thin space (1/6-em)]](https://www.rsc.org/images/entities/char_2009.gif) :
:![[thin space (1/6-em)]](https://www.rsc.org/images/entities/char_2009.gif) 9.0 associated with the TEM. Although it is possible for OH− to substitute for F− in some sites,32 the absence of oxygen in the TEM EDX spectra eliminates this possibility. It is important to note that with the Al and Ti site occupancy factor (SOF) and the temperature factor being refined independently, the calculated Al
9.0 associated with the TEM. Although it is possible for OH− to substitute for F− in some sites,32 the absence of oxygen in the TEM EDX spectra eliminates this possibility. It is important to note that with the Al and Ti site occupancy factor (SOF) and the temperature factor being refined independently, the calculated Al![[thin space (1/6-em)]](https://www.rsc.org/images/entities/char_2009.gif) :
:![[thin space (1/6-em)]](https://www.rsc.org/images/entities/char_2009.gif) Ti ratio may vary by approximately 10–15%, which could, thus, explain the deviation from the measured values.
Ti ratio may vary by approximately 10–15%, which could, thus, explain the deviation from the measured values.
During the HF treatment, FTIR recorded the evolution of gaseous reaction products and peaks were recorded at 3016, 1305, 1035 and 991 cm−1 (Fig. 3). The peaks at 3016, and 1305 cm−1 correspond to the C–H bond in CH4;33 while the two peaks around 1000 cm−1 correspond to a C–F stretching vibration mode.34 When these results are combined with XRD results it is reasonable to assume that the simplified reaction at 55 °C is:
| Ti2AlC + 11HF = Ti2AlF9 + 1/2CH4 + 1/2CF4 + 4.5H2 | (1) |
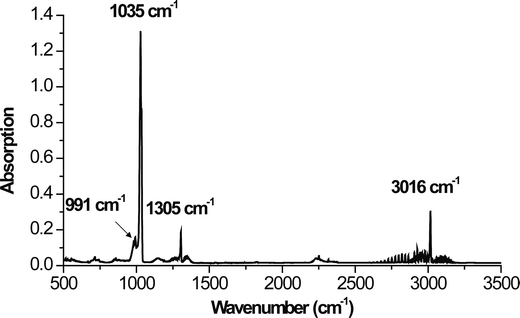 | ||
| Fig. 3 In situ FTIR spectrum of gases that evolved during the fluorination of Ti2AlC. | ||
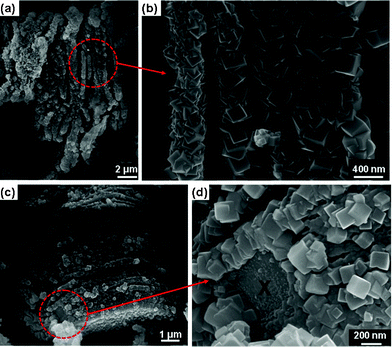 | ||
| Fig. 4 SEM images of the new phase. (a) At low magnification the particle shows the layered morphology, (b) the same as (a) but at higher magnification showing Ti2AlF9 cuboids, (c) another particle with part of it not covered with cuboids, and (d) the same as (c) but at higher magnification focusing on the circled part. X denotes Ti2AlC substrate below the Ti2AlF9 cuboids | ||
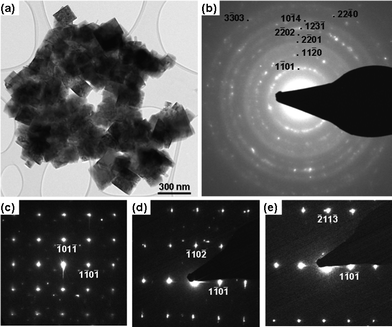 | ||
| Fig. 5 (a) A low magnification TEM image of Ti2.1Al0.9F9 grains. (b) The corresponding SAED patterns, (c–e) are a series of SAED patterns from the Ti2.1Al0.9F9 phase. | ||
Low magnification TEM (Fig. 5a) and SAED (Fig. 5b) confirmed the nanocrystalline character of the new phase, also the indexed rings in the Fig. 5b and SAED patterns (Fig. 5c–e) are in good agreement with the XRD results and confirms the trigonal structure. The angle between (![[1 with combining macron]](https://www.rsc.org/images/entities/char_0031_0304.gif) 01
01![[1 with combining macron]](https://www.rsc.org/images/entities/char_0031_0304.gif) ) and (1
) and (1![[1 with combining macron]](https://www.rsc.org/images/entities/char_0031_0304.gif) 0
0![[1 with combining macron]](https://www.rsc.org/images/entities/char_0031_0304.gif) ) reflections (Fig. 5c) is ≈ 89°, which is in excellent agreement with the angle obtained from crystal structure obtained by simulated annealing (88.5°). It follows that both the XRD and TEM support the conclusion that R3 is the best-fitting space group, with a GOF of 32.35; followed by P31c with a GOF of 28.79. EDS analysis (Fig. 6d) shows that all grains contained Al, Ti, and F with a ratio of Ti
) reflections (Fig. 5c) is ≈ 89°, which is in excellent agreement with the angle obtained from crystal structure obtained by simulated annealing (88.5°). It follows that both the XRD and TEM support the conclusion that R3 is the best-fitting space group, with a GOF of 32.35; followed by P31c with a GOF of 28.79. EDS analysis (Fig. 6d) shows that all grains contained Al, Ti, and F with a ratio of Ti![[thin space (1/6-em)]](https://www.rsc.org/images/entities/char_2009.gif) :
:![[thin space (1/6-em)]](https://www.rsc.org/images/entities/char_2009.gif) Al
Al![[thin space (1/6-em)]](https://www.rsc.org/images/entities/char_2009.gif) :
:![[thin space (1/6-em)]](https://www.rsc.org/images/entities/char_2009.gif) F ∼2.1
F ∼2.1![[thin space (1/6-em)]](https://www.rsc.org/images/entities/char_2009.gif) :
:![[thin space (1/6-em)]](https://www.rsc.org/images/entities/char_2009.gif) 0.9
0.9![[thin space (1/6-em)]](https://www.rsc.org/images/entities/char_2009.gif) :
:![[thin space (1/6-em)]](https://www.rsc.org/images/entities/char_2009.gif) 9. A bright-field image for a single crystal is shown in Fig. 6a and Fig. 6bHRTEM along [11
9. A bright-field image for a single crystal is shown in Fig. 6a and Fig. 6bHRTEM along [11![[2 with combining macron]](https://www.rsc.org/images/entities/char_0032_0304.gif) 0] direction, SAED (Fig. 6c) and EDS (Fig. 6d) results. The grain boundaries are, within the resolution limitations of our TEM, free of secondary phases.
0] direction, SAED (Fig. 6c) and EDS (Fig. 6d) results. The grain boundaries are, within the resolution limitations of our TEM, free of secondary phases.
![(a) A bright field image of a Ti2.1Al0.9F9 grain. (b) HRTEM image along [112̄0] direction, (c) EDS pattern of Ti2.1Al0.9F9 (d) the copper signal originates from the use of a copper grid for sample mounting.](/image/article/2011/RA/c1ra00390a/c1ra00390a-f6.gif) | ||
Fig. 6 (a) A bright field image of a Ti2.1Al0.9F9 grain. (b) HRTEM image along [11![[2 with combining macron]](https://www.rsc.org/images/entities/char_0032_0304.gif) 0] direction, (c) EDS pattern of Ti2.1Al0.9F9 (d) the copper signal originates from the use of a copper grid for sample mounting. 0] direction, (c) EDS pattern of Ti2.1Al0.9F9 (d) the copper signal originates from the use of a copper grid for sample mounting. | ||
The TGA results (Fig. 7a) show that the new phase is stable up to 850 °C in Ar, above which it starts to dissociate. The weight loss, after heating to 1200 °C for 10 min under Ar and cooling down to room temperature, was found to be ∼70 wt%, which suggest that decomposition resulted in products with sublimation points less than 1100 °C. Among the titanium fluoride phases, TiF4 has the lowest sublimation temperature (∼284 °C) and gaseous AlF was observed around 777 °C.36 It is thus reasonable to assume that around 850 °C the following simplified reaction,
| Ti2AlF9 = 2TiF4 + AlF | (2) |
| 0.3Ti2AlC + 0.4TiF4 + 0.15O2 = TiC0.3O0.3 + 0.3AlF + 0.65F2 | (3) |
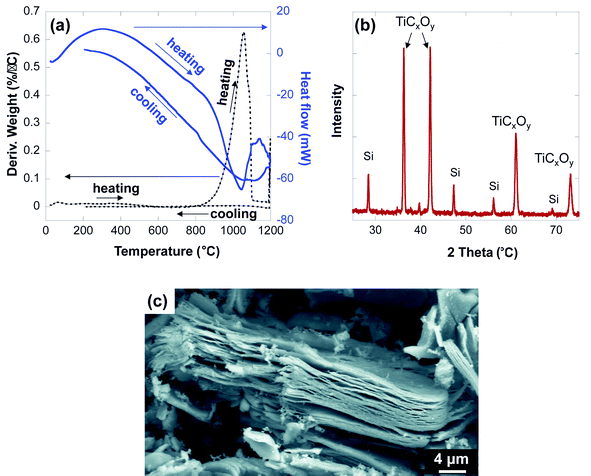 | ||
| Fig. 7 TGA results after heating from room temperature to 1200 °C, (a) Derivative weight and heat flow, (b) XRD of the remaining powder after TGA, (c) SEM image for a particle after the thermal cycle. | ||
The equilibrium unit cell parameters and bulk modulus determined from ab initio calculations based on DFT are listed in Table 2. The equilibrium volume and c/a ratio obtained from total energy calculations based on DFT are slightly higher than the volume obtained from XRD peak-fitting. The theoretical a and c lattice parameter values are 1.9% greater 7.1% greater than the experimental values, respectively. These discrepancies are relatively high for DFT calculations, however, it should be noted that the ab initio calculations model an ordered Ti/Al arrangement, when in reality, the compound is most probably disordered, nanocrystalline, and non-stoichiometric. Another possible factor is that the DFT models stoichiometric Ti2AlF9, whereas the exact chemistry is slightly Al-deficient. Clearly more theoretical work using larger supercells, to model the disorder of the arrangement of Ti and Al atoms is needed, but this aspect is beyond the scope of this paper.
The calculated full, and partial, density of states (Fig. 8a–b) suggest that the new phase is not conductive, as indicated by the band gap at the Fermi level, EF, from −3 to 2 eV. Above the Fermi level, the bonding is dominated by the 3d Ti states; below it, the F states dominate from −7 to −3 eV. In Ti2AlC, the hybridization of the strong Ti–C bonds is responsible for its high stiffness, while its substantial density of states at EF is responsible for its metallic-like electrical conductivity.38,39 In this new phase, the lack of strong Ti–C bond leads to a lower bulk modulus determined from the volume–energy curve from ab initio calculations.
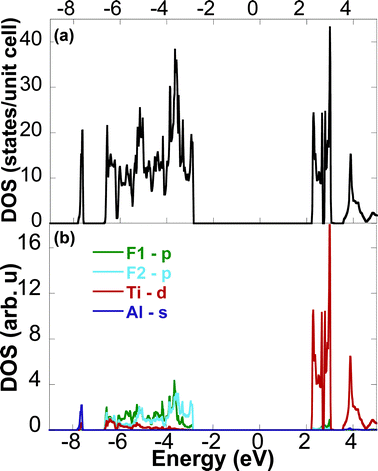 | ||
| Fig. 8 Calculated density of states showing (a) total density of states for Ti2AlF9 and (b) site-projected density of states for Ti, Al, F1 and F2 atoms. | ||
4. Conclusions
A new, nanocrystalline titanium aluminum fluoride phase with a formal stoichiometry of Ti2AlF9 and an approximate composition of Ti2.1Al0.9F9 was produced by reacting Ti2AlC with anhydrous HF at 55 °C. The structure of this new phase was found to be trigonal with an R3 space group. The structure can also be viewed as being comprised of corner-sharing octahedra, arranged in a distorted simple cubic arrangement. This phase is stable up to 850 °C under Ar. The band gap is estimated to be ≈ 5 eV; the bulk modulus is ≈ 109 GPa. With this simple reaction route employing HF and a MAX phase, prospective applications of ternary fluorides tuned in composition, crystallinity and size, for catalytic, electric, or optical applications can be envisioned.Acknowledgements
This work was supported by the Assistant Secretary for Energy Efficiency and Renewable Energy, Office of Vehicle Technologies of the U.S. Department of Energy under Contract No. DE-AC02-05CH11231, subcontract No. 6951370, under the Batteries for Advanced Transportation Technologies (BATT) Program. Also supported by the Commonwealth of Pennsylvania's Ben Franklin Technology Development Authority through the Ben Franklin Technology Partners of Southeastern Pennsylvania. VP acknowledges financial support by the Alexander von Humboldt foundation. NL acknowledges funding by the Integrated Graduate Education and Research Traineeship (IGERT) under NSF grant number DGE-0654313. The authors also thank SSF for the International Strategic Recruitment Grant. Use of the equipment of the Centralized Research Facility (Drexel University) is acknowledged.References
- Z. Mazej and R. Hagiwara, J. Fluorine Chem., 2007, 128, 423–437 CrossRef CAS.
- S. Rüdiger, U. Groβ and E. Kemnitz, J. Fluorine Chem., 2007, 128, 353–368 CrossRef.
- S. Rüdiger and E. Kemnitz, Dalton Trans., 2008, 1117–1127 RSC.
- G. G. Amatucci and N. Pereira, J. Fluorine Chem., 2007, 128, 243–262 CrossRef CAS.
- Y. G. Gogotsi, R. A. Andrievski, ed., Materials Science of Carbides, Nitrides and Borides, Kluwer, Dordrecht, NL, 1999 Search PubMed.
- K. R. Muddukrishna, R. N. Singh and D. K. Padma, J. Fluorine Chem., 57, 155–158 CrossRef CAS.
- V. K. Bogdanov, W. E. K. Gibbs, D. J. Booth, J. S. Javorniczky, P. J. Newman and D. R. MacFarlane, Opt. Commun., 1996, 132, 73–76 CrossRef CAS.
- L. Li, Crit. Rev. Oral Biol. Med., 2003, 14, 100–114 Search PubMed.
- K. V. S. Prasad, B. S. Murty, P. Pramanik, P. G. Mukunda and M. Chakraborty, Mater. Sci. Technol., 1996, 12, 766–770 CAS.
- M. W. Barsoum, Prog. Solid State Chem., 2000, 28, 201–281 CrossRef CAS.
- M. W. Barsoum, M. Radovic, in Encyclopedia of Materials: Science and Technology, ed. K. H. J. Buschow, W. C. Robert, C. F. Merton, I. Bernard, J. K. Edward, M. Subhash and V. Patrick, Elsevier, Oxford, 2004, pp. 1–16 Search PubMed.
- M. Naguib, M. Kurtoglu, V. Presser, J. Lu, J. Niu, M. Heon, L. Hultman, Y. Gogotsi and M. Barsoum, Adv. Mater., 2011, 23, 4248–4253 CrossRef CAS.
- M. W. Barsoum, T. El-Raghy, L. Farber, M. Amer, R. Christini and A. Adams, J. Electrochem. Soc., 1999, 146, 3919–3923 CrossRef CAS.
- R. W. Cheary, A. A. Coelho and J. P. Cline, J. Res. Nat. Inst. Stand. Technol., 2004, 109, 1–25 Search PubMed.
- G. S. Pawley, J. Appl. Crystallogr., 1981, 14, 357–361 CrossRef CAS.
- A. Le Bail, H. Duroy and J. L. Fourquet, Mater. Res. Bull., 1988, 23, 447–452 CrossRef CAS.
- A. Coelho, J. Appl. Crystallogr., 2000, 33, 899–908 CrossRef CAS.
- J. P. Perdew, K. Burke and M. Ernzerhof, Phys. Rev. Lett., 1996, 77, 3865 CrossRef CAS.
- P. M. Morse, Phys. Rev., 1929, 34, 57–64 CrossRef CAS.
- H. Sowa and H. Ahsbahs, Acta Crystallogr., Sect. B: Struct. Sci., 1998, 54, 578–584 CrossRef.
- H. Bialowons, M. Müller and B. G. Müller, Z. Anorg. Allg. Chem., 1995, 621, 1227–1231 CrossRef CAS.
- N. Morita, T. Endo, T. Sato and M. Shimada, J. Mater. Sci. Lett., 1987, 6, 859–861 CrossRef CAS.
- J. A. A. Ketelaar, Nature, 1931, 128, 303 CrossRef CAS.
- A. Le Bail, C. Jacoboni, M. Leblanc, R. De Pape, H. Duroy and J. L. Fourquet, J. Solid State Chem., 1988, 77, 96–101 CrossRef CAS.
- K. Vorres and J. Donohue, Acta Crystallogr., 1955, 8, 25–26 CrossRef CAS.
- R. L. Snyder, J. Fiala and H. J. Bunge, Defect and Microstructure Analysis by Diffraction, Oxford University Press, Oxford, 1999 Search PubMed.
- R. A. Young, The Rietveld Method, Oxford University Press, Oxford, 1993 Search PubMed.
- R. E. Dinnebier and S. J. L. Billinge, Powder Diffraction: Theory and Practice, Royal Society of Chemistry, Cambridge, 2008 Search PubMed.
- R. E. Dinnebier, P. Sieger, H. Nar, K. Shankland and W. I. F. David, J. Pharm. Sci., 2000, 89, 1465–1479 CrossRef CAS.
- R. Hagiwara, K. Kitashita, Y. Ito and O. Tamada, Solid State Sci., 2000, 2, 237–241 CrossRef CAS.
- R. D. W. Kemmitt, D. R. Russell and D. W. A. Sharp, J. Chem. Soc., 1963, 4408–4413 Search PubMed.
- A. Demourgues, N. Penin, D. Dambournet, R. Clarenc, A. Tressaud and E. Durand, J. Fluorine Chem., 2011 DOI:10.1016/j.jfluchem.2011.02.006.
- L.-T. Hsieh, W.-J. Lee, C.-Y. Chen, M.-B. Chang and H.-C. Chang, Plasma Chem. Plasma Process., 1998, 18, 215–239 CrossRef CAS.
- A. Hamwi, M. Daoud and J. C. Cousseins, Synth. Met., 1988, 26, 89–98 CrossRef CAS.
- N. Batisse, K. Guérin, M. Dubois and A. Hamwi, Carbon, 2011, 49, 2998–3009 CrossRef CAS.
- J. M. Dyke, C. Kirby, A. Morris, B. W. J. Gravenor, R. Klein and P. Rosmus, Chem. Phys., 1984, 88, 289–298 CrossRef CAS.
- M. Naguib, V. Presser, D. Tallman, J. Lu, L. Hultman, Y. Gogotsi and M. W. Barsoum, J. Am. Ceram. Soc. , 2011, accepted and in publication process Search PubMed.
- M. Magnuson, O. Wilhelmsson, J. P. Palmquist, U. Jansson, M. Mattesini, S. Li, R. Ahuja and O. Eriksson, Phys. Rev. B: Condens. Matter Mater. Phys., 2006, 74, 195108 CrossRef.
- Y. C. Zhou and Z. M. Sun, Phys. Rev. B: Condens. Matter, 2000, 61, 12570–12573 CrossRef CAS.
- B. Manoun, F. X. Zhang, S. K. Saxena, T. El-Raghy and M. W. Barsoum, J. Phys. Chem. Solids, 2006, 67, 2091–2094 CrossRef CAS.
Footnote |
| † CCDC reference number 88372. For crystallographic data in CIF or other electronic format see DOI: 10.1039/c1ra00390a |
| This journal is © The Royal Society of Chemistry 2011 |
