Self-catalytic synthesis of hierarchical vanadium nitride/carbon superconducting nanocomposites†
Wei-Tang
Yao
ab,
Min-Rui
Gao
a,
Shu-Hong
Yu
*a,
Jun-Feng
Ding
c and
Xiao-Guang
Li
c
aDivision of Nanomaterials and Chemistry, Hefei National Laboratory for Physical Sciences at Microscale, School of Chemistry and Materials, University of Science and Technology of China, Hefei, 230026, P. R. China. E-mail: shyu@ustc.edu.cn; Fax: 0086 551 3603040
bSchool of Materials Science and Engineering, Hefei University of Technology, Hefei, 230009, P. R. China
cDivision of Low-dimensional Physics and Chemistry, Hefei National Laboratory for Physical Sciences at Microscale, School of Physical Sciences, University of Science and Technology of China, Hefei, 230026, P. R. China
First published on 6th October 2011
Abstract
An easy way to produce VN nanocomposites at relatively low temperature (800 °C) using simple precursors is presented. A self-catalytic growth approach has been developed for spontaneous preparation of superconducting VN/C nanocomposites composed of VN nanoparticles and well-defined carbon nanofibers. The carbon nanofibers were found to grow by a self-catalytic process through tiny VN nanocrystals. In this case, a homogeneous gel-like starting product has been formed that is converted by calcination into the corresponding metal nitride, without any preliminary treatments or further purification. The samples were characterized by XRD, TEM, SEM, and BET. The as-obtained nanocomposite shows an onset superconducting temperature at ∼9 K, which is similar to that reported for bulk VN. The procedure has been shown to be rather general and it was possible to open a new avenue toward the scale-up syntheses of other new transition metal nitride nanocomposites.
Introduction
Metal nitrides, especially those of transition metals, have received increasing attention in recent years because of their interesting and attractive chemical and physical properties.1 The traditional applications of these materials range from cutting tools and structural materials,2,3 to magnetic and electric components, and superconducting devices.4–7 Among various metal nitrides, vanadium nitride (VN) is suitable for many uses due to its unique properties, including extreme hardness, wear resistance, excellent oxidative stability and corrosion resistance, high-temperature stability, electrical conductivity, and electrodes of supercapacitors.8–10 Moreover, there is increasing interest in VN as an important industrial catalyst known for its selectivity and stability.11,12 Besides, VN is a superconductor with a transition temperature of 7.8 ± 0.1 K,13 or 6–8.1 K.14Different techniques have been developed to prepare vanadium nitride (VN), including the traditional carbothermal reduction and nitridation of metal oxides with graphite in N2 atmosphere above 1000 °C,15 heating metal powder in N2 flow at around 1350 °C,15 reactive magnetron sputter deposition,16pulsed laser deposition (PLD),17ammonolysis of metal chlorides,18oxides19 or sulfides20 at 800–1400 °C, solid state metathesis (SSM),21 self-propagating high temperature synthesis (SHS),22 carbothermal reduction process,23 and other methods.24,25
In this article, we report a so-called self-catalytic synthesis of free-standing hierarchical VN/C superconducting nanocomposites composed of VN nanoparticles and carbon nanofibers.
Experimental
Materials
VOCl3, absolute C2H5OH and urea were purchased from Aldrich and were used without further purification.Synthesis of VN/C superconducting nanocomposites
In a typical synthesis process, 1 g liquid VOCl3 metal precursor was added to 2 g ethanol to reach a targeted concentration with vigorous magnetic stirring for 10–20 mintues.26 The metal precursor vigorously reacted with alcohol, releasing a major part of the chlorine as HCl and forming the corresponding metal-orthoesters and a dark brown, but clear solution was obtained. This process is typically an exothermic reaction and very similar to the preparation of metal chloroalkoxides.27 Then, a different amount of solid urea was added to the alcoholic solution under stirring until the urea was completely dissolved (dissolution time depends on the ratio but usually is less than 1 h) to give the expected urea/metal precursor molar ratio (R). The obtained gel glass materials were calcined under N2 atmosphere by heating up to 800 °C over 3 h (heating rate is about 4.45 °C min−1) in an alumina boat and the samples were kept at this temperature for another 4 h. The resulting metal colour products were collected without any treatment and then used for further analysis.Characterization
The samples were characterized by different analytic techniques. X-Ray powder diffraction (XRD) was carried out on a Japan Rigaku Dmax-γA X-ray diffractometer with Cu-Kα radiation (λ = 1.54178 Å), a scanning electron microscope (SEM, JSM-6700F) was applied to investigate the size and morphology. TEM images, HRTEM images, selected-area electron diffraction (SAED), and an energy-dispersive spectrum (EDS) were taken with a JEOL-2010 transmission electron microscope with an acceleration voltage of 200 kV. Raman spectroscopy was carried out on a JY LABRAM-HR confocal laser micro-Raman spectrometer using Ar+ laser excitation with a wavelength of 514.5 nm. Nitrogen sorption experiments were done with a Quantachrome Autosorb-1 or Quadrasorb at liquid nitrogen temperature, and data analysis were performed by Quantachrome software. All the samples were degassed at 150 °C for 20 h before measurements. The magnetic measurements on powdered samples enclosed in a medical cap were carried out at 2–16 K and at 50 Oe using a commercial SQUID magnetometer (MPMS-XL) from Quantum Design Corp.Results and discussion
It worth noting that the solubility of urea in the presence of the metal precursors is significantly higher than that in pure ethanol (4.877 g/100 g at 18.2 °C).28 Interestingly, we observed a fantastic phenomenon that the gel colour changes gradually with increased stirring time. The gel colour changes from reddish to blue with increasing the molar ratio (R) of urea and metal precursor. However, when R is lower or equal to 3, the colour does not change at all. Indeed, despite a clear dark-reddish solution being obtained within an hour, we preferred to wait one night before heat treatment in order to allow the complete bonding with urea and to keep the vanadium in a final oxidation state of 4+. In terms of colours, this meant waiting until the gel turns from reddish to blue, going over a green intermediate colour. If the R value is 3 or lower than 3, a change in colour was never observed, even after waiting for several days. The powder X-ray diffraction pattern (XRD) in Fig. 1 shows that the obtained product is composed of cubic VN and a broadening peak at 12.2°, which can be indexed graphitic carbon. This broad peak can also be observed in ionic liquids as precursors for generation of nitrogen-doped carbons.29 The diffraction peaks appeared in the 2θ range from 25 to 85° and can be indexed to the NaCl-type structure of VN with a lattice parameter a = 4.14 Å, which is in good agreement with the reported value for cubic VN (a = 4.139 Å , JCPDS card, No. 35-0768). The broad peak located at ∼26° can be indexed to (002) diffraction planes of hexagonal graphite (JCPDS No. 41-1487). The fact that the 002 diffraction peaks are relatively low in intensity and broad in shape, suggests that as-prepared carbon nanofibers possess low graphitization and poor crystallinity. The products with different ratios show brilliant metal colour (ESI, Fig. S1†).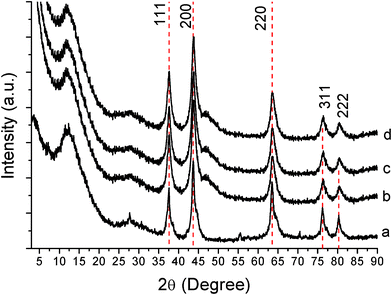 | ||
| Fig. 1 XRD patterns of vanadium-urea derived samples at different urea/metal precursor molar ratio (R): (a) R = 3, (b) R = 5, (c) R = 7, (d) R = 10. Marked peaks with a dashed line are attributed to VN.23 | ||
The scanning electron microscopy (SEM) image in Fig. 2a indicates that the sample prepared with R = 3 is in a form of self-supported microsized sheets, each of which is composed of long and densely packed nanofibers with a width of 50–70 nm, and lengths up to several micrometres standing on the self-supporting microsheets (ESI, Fig. S2†). Fig. 2c, d shows that both sides of VN microsheets are composed of carbon nanofibers (CNFs). Closer observations reveal that most of the CNFs have a smooth surface and sharp chief head. Further studies show that the morphology of the products can be controlled by tuning the molar ratio between urea and metal precursor. The reactions using different molar ratios were carried out and the products also show different morphologies (Fig. 3). The product prepared with molar ratio R = 5 primarily consists of self-supported microsized sheets, each of which is composed of short and densely packed nanorods (Fig. 3a, b). Furthermore, when the molar ratio is increased to 7 and/or 10, the morphologies changed to more densely packed micro-sheet films (Fig. 3c, d).
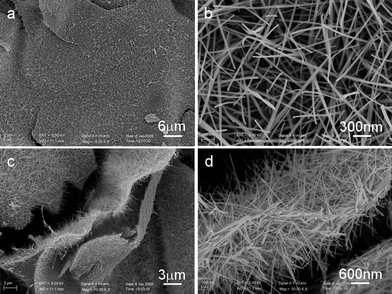 | ||
| Fig. 2 (a) SEM images of the VN/C nanocomposite prepared with R = 3. (b) SEM image of carbon nanofibers standing on the surface of the VN microsheets. (c), (d) SEM images of a typical VN microsheet with carbon nanofibers standing on both sides. | ||
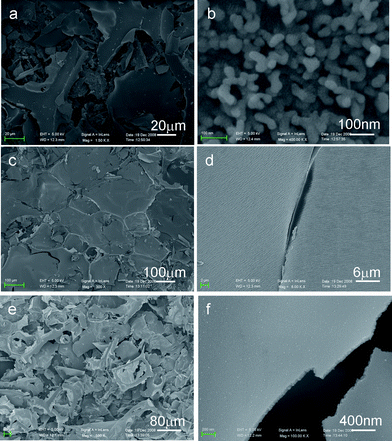 | ||
| Fig. 3 SEM images of vanadium-urea derived samples at different urea/metal precursor molar ratio (R): (a, b) R = 5; (c, d) R = 7; (e, f) R = 10. | ||
The transmission electron microscopy (TEM) image in Fig. 4a, b shows that there are many tiny nanoparticles embedded within the microsheets and the nanofibers are smooth, thin, and almost transparent. The average size of the VN nanoparticles estimated by the Scherrer formula is about 10 nm. Moreover, the HRTEM image in Fig. 4c shows the lattice fringes of (111) plane are 0.238 nm. The selected-area electron diffraction (SAED) pattern (inset in Fig. 4c) taken from a typical nanocrystal shown in Fig. 4c indicates the single-crystalline nature of the nanocrystal. HRTEM also reveals that the interlayer spacing of a carbon nanofiber is ∼0.342 nm (inset in Fig. 4d), which is consistent with that of the (002) plane of graphitic carbon. The SAED pattern (inset in Fig. 4d) taken on a typical individual carbon nanofiber implied the orientation of the 002 planes. Energy-dispersive spectrum (EDS) analysis on the sample prepared with R = 3 indicated the molar ratio of V and N is 0.9657![[thin space (1/6-em)]](https://www.rsc.org/images/entities/char_2009.gif) :
:![[thin space (1/6-em)]](https://www.rsc.org/images/entities/char_2009.gif) 1, which was close to that of the stoichiometric composition (ESI, Fig. S3†). Moreover, the weight content of carbon in the composite is about 15.65 wt%. The representative Raman spectrum in Fig. 5 shows two strong, sharp peaks at 1351 cm−1 and 1587 cm−1, which are attributed to the D (disorder)-bands and G (graphite)-bands, respectively.30
1, which was close to that of the stoichiometric composition (ESI, Fig. S3†). Moreover, the weight content of carbon in the composite is about 15.65 wt%. The representative Raman spectrum in Fig. 5 shows two strong, sharp peaks at 1351 cm−1 and 1587 cm−1, which are attributed to the D (disorder)-bands and G (graphite)-bands, respectively.30
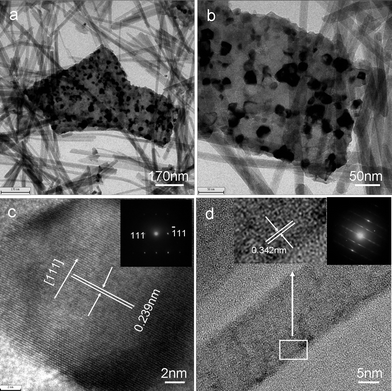 | ||
| Fig. 4 (a, b) TEM images of VN nanosheets and carbon nanofibers. (c) A HRTEM image of a typical VN nanocrystal. The inset shows the corresponding SAED pattern of the VN nanocrystals; (d) a HRTEM image of a typical carbon nanofiber. Inset: a SAED pattern of the carbon nanofiber. | ||
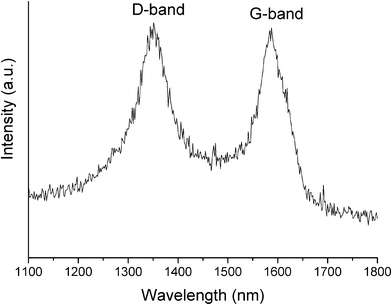 | ||
| Fig. 5 Raman spectrum of the VN/C nanocomposite prepared with R = 3. | ||
The growth mechanism of the VN nanocomposites is of great interest and deserves to be discussed in detail. Since the carbon can grow on VN self-supported substrates, we proposed that the possible mechanism is dominated by self-seeding growth. When the VOCl3-urea precursor was heated to 800 °C, metal-orthoesters melted and vaporized. This film can act as a seeding layer, which can provide favorable nucleation self-catalytic sites (ESI, Fig. S4†), carbon nanofibers can be observed grown from the respective growing VN sites. Due to the anisotropic growth rate, carbon nanofibers will grow on such a VN seeding layer. In fact, many VN nanocrysals were observed on the self-supported substrate, and carbon nanofibers only grew directly from the body of the substrate, which proves that the mechanism of the carbon nanofibers is controlled by a self-catalytic growth mechanism. More interestingly, the products prepared with different precursor ratios are all of high BET surface areas without using template directing agents (Fig. 6). The calculated Brunauer–Emmett–Teller (BET) surface areas of VN nanocomposites prepared at R = 3 after heat treatment are as high as 348 m2 g−1. When the R of VN nanocomposites changed to 5, 7 and 10, The BET surface areas also reach 240, 220 and 488 m2 g−1, respectively (Fig. 6).
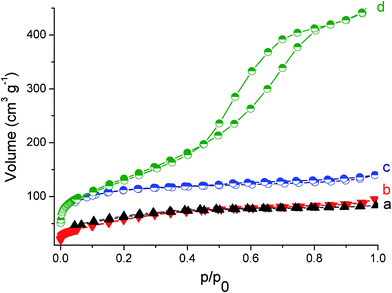 | ||
| Fig. 6 N2 adsorption-desorption isotherm of VN/C nanocomposites prepared at different ratios with (a) R = 7, (b) R = 5, (c) R = 3, and (d) R = 10, respectively. | ||
The magnetic measurements on VN nanocomposite at R = 3 enclosed in a medical cap were carried out at 4–16 K and at H = 50 Oe using a commercial SQUID magnetometer (MPMS-XL) from Quantum Design Corp. The zero-field cooling (ZFC) magnetization as a function of temperature (M–T curve) reveals that the onset superconducting transition temperature for the nanocomposite is ∼9 K, as shown in Fig. 7, which is higher than that of the bulk VN,11 which may be due to the size effect.
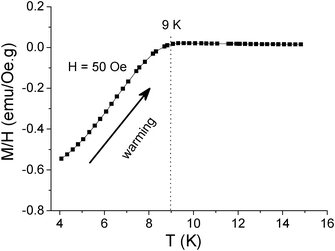 | ||
| Fig. 7 M–T curve of the VN nanocomposite (R = 3) measured with zero-field cooling under H = 50 Oe, which shows that the onset transition temperature is ∼9 K. | ||
Conclusions
In summary, we have demonstrated a self-catalytic synthesis route to prepare a new hierarchical VN/C superconducting nanocomposite with high surface area by a template-free approach, which could be extended for synthesis of other metal nitride nanocomposites. The in situ formation of VN nanoparticles plays a crucial role in such a self-catalytic growth of carbon nanofibers. The onset superconducting temperature for this kind of nanocomposite is observed at ∼9 K, which is higher than that of the bulk VN. Such hierarchical VN/C free-standing sheets with high surface area and light weight could have potential applications in catalytic fields and light weight materials.Acknowledgements
We acknowledge the funding support from the National Basic Research Program of China (2010CB934700, 2011CBA00102), the National Natural Science Foundation of China (NSFC, Nos. 91022032, 50732006), and International Science & Technology Cooperation Program of China (2010DFA41170). W. T. Yao also thanks the Anhui Province Outstanding Youth Science Fundation (NO. 110805J13).References
- A. M. Alexander and J. S. J. Hargreaves, Chem. Soc. Rev., 2010, 39, 4388 RSC.
- R. B. Kaner, J. J. Giman and S. H. Tolbert, Science, 2005, 308, 1268 CrossRef CAS.
- E. Gregoryanz, C. Sanloup, M. Somayazulu, J. Badro, G. Fiquet, H. K. Mao and R. J. Hemley, Nat. Mater., 2004, 3, 294 CrossRef CAS.
- J. J. Scepaniak, C. S. Vogel, M. M. Khusniyarov, F. W. Heinemann, K. Meyer and J. M. Smith, Science, 2011, 331, 1049 CrossRef CAS.
- K. Chung, C. H. Lee and G. C. Yi, Science, 2010, 330, 655 CrossRef CAS.
- J. C. Crowhurst, A. F. Goncharov, B. Sadigh, C. L. Evans, P. G. Morrall, J. L. Ferreira and A. J. Nelson, Science, 2006, 311, 5765 CrossRef.
- J. Schultz and A. Lichtenberger, IEEE Trans. Appl. Supercond., 2007, 17, 645 CrossRef CAS.
- S. T. Oyama, The Chemistry of Transition Metal Carbides and Nitrides, Springer, 1996 Search PubMed.
- D. Choi, G. E. Blomgren and P. N. Kumta, Adv. Mater., 2006, 18, 1178 CrossRef CAS.
- A. M. Glushenkov, D. Hulicova-Jurcakova, D. Llewellyn, G. D. Lu and Q. Chen, Chem. Mater., 2010, 22, 914 CrossRef CAS.
- S. T. Oyama, Catal. Today, 1992, 15, 179 CrossRef CAS.
- H. Kwon, S. Choi and L. T. Thompson, J. Catal., 1999, 184, 236 CrossRef CAS.
- K. E. Gray, R. T. Kampwirth, D. W. Capone II, R. Vaglio and J. Zasadzinski, Phys. Rev. B, 1988, 38, 2333 CrossRef CAS.
- B. Koscielska, A. Winiarski and W. Jurga, J. Non-Cryst. Solids, 2010, 356, 1998 CrossRef CAS.
- P. T. Shaffer, Plenum Press Handbooks of High-Temperature Materials, vol. 1, Plenum Press, New York, 1964 Search PubMed.
- X. Chu and S. A. Barnett, J. Vac. Sci. Technol., A, 1996, 14, 3124 CAS.
- Z. N. Dai, A. Miyashita, S. Yamamoto, K. Narumi and H. Naramoto, Thin Solid Films, 1999, 347, 117 CrossRef CAS.
- J. P. Dekker, P. J. Vanderput, H. J. Vering and J. Schoonman, J. Mater. Chem., 1994, 4, 689 RSC.
- Y. G. Li, L. Gao, J. G. Li and D. S. Yan, J. Am. Ceram. Soc., 2002, 85, 1294 CrossRef CAS.
- P. S. Herle, M. S. Hegde, N. Y. Vasathacharya, S. Philip, M. V. R. Rao and T. Sripathi, J. Solid State Chem., 1997, 134, 120 CrossRef.
- I. P. Parkin, Chem. Soc. Rev., 1996, 25, 199 RSC.
- B. Vaidhyanathan, D. K. Agrawal and R. Roy, J. Mater. Res., 2000, 15, 974 CrossRef CAS.
- H. Z. Zhao, M. Lei, X. A. Yang, J. K. Jian and X. L. Chen, J. Am. Chem. Soc., 2005, 127, 15722 CrossRef CAS.
- J. Q. Hu, Q. Y. Lu, K. B. Tang, S. H.Yu, Y. T. Qian, G. E. Zhou and X. M. Liu, J. Am. Ceram. Soc., 2000, 83, 430 CrossRef CAS.
- X. G. Yang, C. Li, Y. Yan, Y. T. Qian, Y. B. Jia and H. B. Zhang, Chem. Lett., 2003, 32, 228 CrossRef CAS.
- C. Giordano, C. Erpen, W. T. Yao, B. Milke and M. Antonietti, Chem. Mater., 2009, 21, 5136 CrossRef CAS.
- D. C. Bradley, R. N. P. Sinha and W. Wardlaw, J. Chem. Soc., 1958, 4651 Search PubMed.
- F. M. Lee and L. E. Lahti, J. Chem. Eng. Data, 1972, 17, 304 CrossRef CAS.
- J. P. Paraknowitsch, J. Zhang, D. S. Su, A. Thomas and M. Antonietti, Adv. Mater., 2010, 22, 87 CrossRef CAS.
- Y. L. Hsin, K. C. Hwang and C. T. Yeh, J. Am. Chem. Soc., 2007, 129, 9999 CrossRef CAS.
Footnote |
| † Electronic supplementary information (ESI) available: Photographs of the nanocomposites, SEM, TEM images and EDX spectrum. See DOI: 10.1039/c1ra00492a/ |
| This journal is © The Royal Society of Chemistry 2011 |
