Thin film infrared spectroscopy on planar silver halide: a new technology for water and other liquids in the mesoscopic domain†‡
Edward M.
Kosower
*a and
Galina
Borz
b
aSchool of Chemistry, Tel Aviv University, Tel Aviv, 69978, Israel. E-mail: kosower@post.tau.ac.il; Fax: 972-3-6409293; Tel: 972-3-6408556
bSchool of Chemistry, Tel Aviv University, Tel Aviv, 69978, Israel
First published on 11th October 2011
Abstract
The essentially unexplored phenomenon of electrostriction on polar solids is now exploited to restrict the motion of polar liquids in infrared spectroscopic experiments. We have found a wide variety of water oligomers for which theoretical properties had previously been calculated utilizing a recently developed cell for thin film infrared spectroscopy. Short acquisition times (to detect transient species) and low signal energies (less disruption of transient species) on planar silver halide (many reflections, limited penetration depth (therefore, small sample size), restraint of molecular motion by electrostriction (thus making possible capture of transient spectra)) were utilized to yield heretofore unknown spectroscopic properties of water. The results included identification of five oligomers (cyclic hexamers (chair, boat), cyclic pentamer and bicyclic books (1, 2)). The new technique of lifetime tagging was used to track these species, leading to the selection of marker peaks for specific oligomers. Each oligomer possessed groups of peaks in the symmetric OH stretching region, for which a new type of model, isomotomers, supported its identification. Intramolecular H-bonding in books 1 and 2 provided extra support for the assignments. Other polar liquids (N-methylformamide, dichloromethane) are briefly discussed. The tetrahedral character of water appears to result from an average over many linear oligomers.
Prologue
To accustom the reader who may be unfamiliar with the novel features of thin film spectroscopy on silver halide, we present in this prologue a comparison of a spectrum of water measured in the “classical” manner with one measured with a short acquisition time. The signal energy (Sg) for the “classical” spectrum was the same as that used for our “novel” spectroscopy (Sg 100), far lower than those commonly used (Sg > 8![[thin space (1/6-em)]](https://www.rsc.org/images/entities/char_2009.gif) 000). Additional comparisons for ethanol, acetonitrile and N-methylformamide are given in the supplemental material.† It is clear that the “classical” spectra are smoothed out (averaged) versions of the “novel” spectra. The novel spectra contain a lot of amazing detail while the “classical” spectra contain the expected averaged peaks, suitable for identification but not for detailed analysis. It is also obvious that the spectra are all of liquids. In all cases, gas phase spectra of the same compounds would be substantially weaker to say nothing of being quite difficult to obtain in the case of N-methylformamide, b.p. 182 °C.
000). Additional comparisons for ethanol, acetonitrile and N-methylformamide are given in the supplemental material.† It is clear that the “classical” spectra are smoothed out (averaged) versions of the “novel” spectra. The novel spectra contain a lot of amazing detail while the “classical” spectra contain the expected averaged peaks, suitable for identification but not for detailed analysis. It is also obvious that the spectra are all of liquids. In all cases, gas phase spectra of the same compounds would be substantially weaker to say nothing of being quite difficult to obtain in the case of N-methylformamide, b.p. 182 °C.
The key points are that (a) the polar surface restricts the motion of the molecules on the surface and lowers the rate of evaporation, (b) the low phonon energy (low signal) does not augment thermal motion of the surface molecules, and (c) the short time scan minimizes the number of trajectories for averaging over motions of the molecules. Our spectra are much closer to the intrinsic spectroscopic properties of the molecules.
Water
The mid infrared spectrum of water contains three main regions, the shortest wavelength range assigned to the OH stretching bands (asymmetric and symmetric), the middle range assigned to the bending band and the longest wavelength range to librations. Fig. 1 displays the comparison of a “classical” water spectrum (averaged over 300 s) with a “novel” spectrum (0.1 s). On expansion, the “novel” spectrum reveals peaks like those that are described later in the article. The “classical” and “novel” spectra are clearly related and refer to the same entity, liquidwater. Spectra for short and long scans of ethanol, acetonitrile and N-methylformamide are displayed in Fig. S1–S3†. Fig. 2 shows how much time is needed for evaporation of a water film from the AgX surface. A direct comparison between the spectrum of a liquid on the AgX surface and a gas phase spectrum taken without the cell is shown later.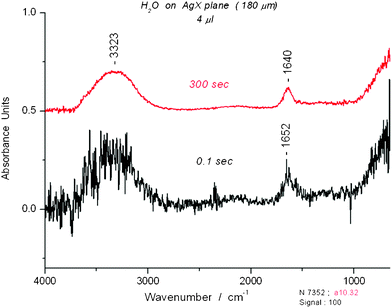 | ||
| Fig. 1 Comparison of two spectra of water for a 4 μL sample on AgX fiber. The spectrum at the top was averaged over 300 s. The spectrum at the bottom was taken with a single 0.1 s scan. | ||
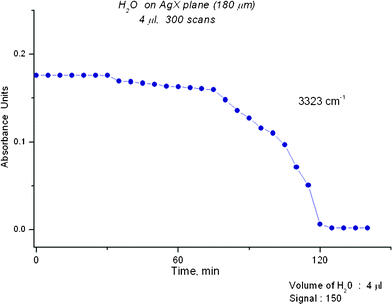 | ||
| Fig. 2 A plot of an OH IR peak at 3323 cm−1versus time is shown. The plot indicates that several stages occur in the removal of water at Sg 150. No appreciable change occurs over the first 30 min and removal is only complete after about 120 min. | ||
The liquid near the surface is subject to a strong attraction from the dipoles in the solid AgX surface, an effect that has been noted in the literature for salt surfaces1 but also occurs for other dipolar surfaces such as sand, i.e.silicon dioxide2 and cellulose.3
1. Introduction
To reiterate the lessons of the prologue, new aspects of the vibrational spectroscopy and dynamics of polar liquids in thin films, using our recently developed cell, are exemplified with results for water and some other polar liquids such as N-methylformamide (NMF) and dichloromethane (DCM). By shortening the acquisition time (revealing transient structures), limiting the signal size (avoiding disruption of transient structures) and using planar silver halide as the substrate (many reflections, limited penetration depth, restraining molecular motion by electrostriction), we have revealed some of some heretofore unknown spectroscopic properties of water and other polar liquids.Our research was initiated in collaboration with Prof. A. Katzir (School of Physics, Tel Aviv U) who had created his extrusion method for preparing pure cylindrical AgX fibers for biomedical applications. We began our research on thin film spectroscopy with the development of a cell for FTIR-ATR (Attenuated Total internal Reflection) studies on the cylindrical silver halide fibers [AgX, usually AgBr:AgCl, 0.6![[thin space (1/6-em)]](https://www.rsc.org/images/entities/char_2009.gif) :
:![[thin space (1/6-em)]](https://www.rsc.org/images/entities/char_2009.gif) 0.4]. The cell was designed to accommodate fibers (joint student, S. Simhony) on which samples could be placed and the spectrum determined using detection of the light remaining after sample absorption of the evanescent waves. This cell was used to produce the spectra of small organic molecules in small amounts4,5 Shortly after, Katzir developed the heated press method for making a planar element from the AgX fibers. We then had the ideal combination: (a) a cylindrical fiber with a polished end on which light could be focused and transmitted to the planar portion (b) a planar surface on which it was easy to place a sample to absorb the evanescent waves (c) a second cylindrical section to transmit the light to a polished end for focusing on a detector.
0.4]. The cell was designed to accommodate fibers (joint student, S. Simhony) on which samples could be placed and the spectrum determined using detection of the light remaining after sample absorption of the evanescent waves. This cell was used to produce the spectra of small organic molecules in small amounts4,5 Shortly after, Katzir developed the heated press method for making a planar element from the AgX fibers. We then had the ideal combination: (a) a cylindrical fiber with a polished end on which light could be focused and transmitted to the planar portion (b) a planar surface on which it was easy to place a sample to absorb the evanescent waves (c) a second cylindrical section to transmit the light to a polished end for focusing on a detector.
Many points favor the cell of which two are the following. First, using ATR meant that the evanescent waves probed only the sample defined by the penetration depth and NOT the space or liquid above the sample as is the case for external reflection techniques. Second, the angle of incidence for the IR beam was small making the penetration depth small, experimentally measured as about 60 nm. The planar AgX element is thin (180 μm) and supports many internal reflections through the IR transparent AgX. The cell is illustrated in Fig. 3. The principle of ATR is shown in Fig. 4. The general principles of ATR using various forms of AgX have been summarized.6
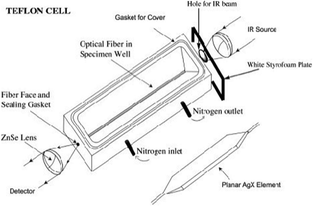 | ||
| Fig. 3 The ATR Cell. The light energy is regulated by the placement of a hole in a Styrofoam panel and monitored at the MCT detector before the sample is placed on the planar AgX element. | ||
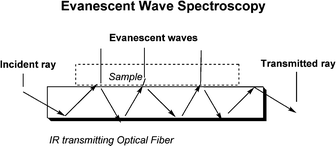 | ||
| Fig. 4 The incident light is focused on the fiber end, reflected 20 times within the AgX planar element, and focused on a detector after emerging from the other end of the fiber. The evanescent waves that emerge from the plane are absorbed by the sample. The loss of radiation is transformed into an absorption spectrum. | ||
The main features of our cell for ATR utilizing AgX planar fibers have been described.7 The ten chief points in addition to the two cited above (direct observation of sample and small penetration depth) are (1) direct sample introduction into the cell (2) short acquisition time (0.1 s) (3) complete mid-IR spectra (4) no time lag (5) simple control of energy delivered to the sample (6) small sample sizes (sensitivity enhanced by surface enhanced infrared absorption, SEIRA) (7) sharp spectroscopic peaks, (8) unusually narrow absorption bands (9) broad spectral range (10) fiber easily removed and replaced (after cleaning). Numerous discoveries made with our cell using thin films of liquids have been reported.7–11 Our research was facilitated by the participation of our colleague, Gil Markovich.
Water is a remarkable material, important for the evolution and existence of life and for its effects on the geology and geography of the planet The physical properties of water (solid, liquid, and gas) have been studied so much that it is difficult to imagine that one can still encounter new aspects of its behavior. Nevertheless, we shall show that a novel cell with a new spectroscopic substrate represents a revolutionary technology that can be used to probe the mesoscopic behavior of water and to reveal the spectra of some of its many oligomers on surfaces.
2. The IR spectra of water
Using our new cell, the IR spectrum of water on AgX at signal intensity (Sg) 100 has a resolution and richness never before observed for the liquid. The OH stretch region has at least 125 peaks (S4 and S5)† and the bending region > 20 peaks. (S6)† The first point to be addressed is any possible confusion between our spectra and that of the gas phase spectrum of water. In Fig. 5, we compare the spectra of the OH region of water in the liquid phase on the AgX plane and in the gas phase. It is clear that the gas phase absorption spectrum is found at much shorter wavelengths than those for the liquid. In Fig. 6, we show a comparison of the liquid phase spectrum of H2O and that in the gas phase in the bending and libration region from 2500–650 cm−1. Note the blank spectrum in the AgX experiment, typical of the low noise generally found in such measurements.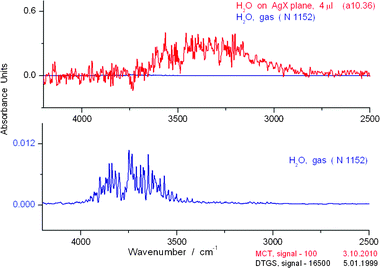 | ||
| Fig. 5 Comparison of liquid phase (above) and gas phase (below) spectra in the OH stretching region for water over the range 4250–2500 cm−1. The liquid spectrum represents a single 0.1 s scan of the sample. The blank spectrum (line slightly above zero) in the AgX experiment (i.e., no added H2O) is typical of the low noise generally found in such measurements. No cell was present during the measurement for the gas phase. | ||
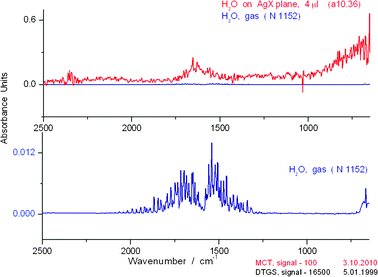 | ||
| Fig. 6 Comparison of liquid phase (above) and gas phase (below) spectra in the OH bending and libration regions for water over the range 2500–650 cm−1. The liquid spectrum represents a single 0.1 s scan of the sample. The blank spectrum (line slightly above zero) in the AgX experiment (i.e., no added H2O) is typical of the low noise generally found in such measurements No cell was present during the measurement for the gas phase. | ||
Since we observed that certain peaks persisted through a number of scans, we reasoned that these may represent “stable” structures. We thus arrived at the new technique of “lifetime-tagging” to identify stable peaks and with this information identify specific oligomers (section 4.2).
A second point to be reemphasized is why we obtain such highly resolved spectra The short answer is that the acquisition time is short and the polar surface restricts the motion of the molecules in the liquid. With a low signal energy and low vibrational absorption coefficients, the number of absorption events must be small.
3. Experimental overview
In order to understand how we are able to obtain our novel results, we review the experimental procedure here. The general procedure and the cell have been described in previous papers but for easy reference we include an illustration of the cell. (Fig. 3) The fiberoptic IR cell contains a planar AgX fiber [AgX, usually AgBr:AgCl, 0.6![[thin space (1/6-em)]](https://www.rsc.org/images/entities/char_2009.gif) :
:![[thin space (1/6-em)]](https://www.rsc.org/images/entities/char_2009.gif) 0.4].7–11 Planar portion: l, 3.9–4.0 cm, w, 0.4 cm, d,180 μm. Cylindrical portion: d, 0.9 mm. An extremely simple but highly effective method for controlling the signal intensity involves positioning a Styrofoam plate with a hole to admit the IR beam in front of the fiber entry. This made it possible to control the signal intensity at levels between 50 and 3700. The signal intensity is set before the measurement of the background. As far as we know, this is the first time that signal strength has been controlled in infrared spectroscopy. A whole new world of transient or unstable structures is opened to the spectroscopist. Ultrapure water (18.2 MOhm, viaultrafiltration, Biolab 232141) is used. In a typical experiment, a quantity (∼0.4–4.0 μL) of water is distributed (from 1–11 drops, ∼1–10 s) on the planar portion of the fiber with a micropipette as uniformly as possible. Recording of the spectra begins before addition of the sample so that there are no missed points; the collection of data begins and then the sample is distributed over the fiber. After the cell is closed, the sample is exposed to a slow flow of dry N2 (1 mL min−1) that has been passed through a drying train of calcium chloride, dried molecular sieves 4A, and silica gel containing cobalt indicator. The gas flow is controlled by a Rotaflow valve. The low rate of gas flow means that the thin layer of solvent is removed very slowly from the surface of the AgX. The smallest sample of water is removed in 20–30 min, while the largest survives for 120 min. Acetonitrile is removed in 100–200 s at a much higher signal (500). Dichloromethane lasts 2–3 s and good spectra are easily obtained.
0.4].7–11 Planar portion: l, 3.9–4.0 cm, w, 0.4 cm, d,180 μm. Cylindrical portion: d, 0.9 mm. An extremely simple but highly effective method for controlling the signal intensity involves positioning a Styrofoam plate with a hole to admit the IR beam in front of the fiber entry. This made it possible to control the signal intensity at levels between 50 and 3700. The signal intensity is set before the measurement of the background. As far as we know, this is the first time that signal strength has been controlled in infrared spectroscopy. A whole new world of transient or unstable structures is opened to the spectroscopist. Ultrapure water (18.2 MOhm, viaultrafiltration, Biolab 232141) is used. In a typical experiment, a quantity (∼0.4–4.0 μL) of water is distributed (from 1–11 drops, ∼1–10 s) on the planar portion of the fiber with a micropipette as uniformly as possible. Recording of the spectra begins before addition of the sample so that there are no missed points; the collection of data begins and then the sample is distributed over the fiber. After the cell is closed, the sample is exposed to a slow flow of dry N2 (1 mL min−1) that has been passed through a drying train of calcium chloride, dried molecular sieves 4A, and silica gel containing cobalt indicator. The gas flow is controlled by a Rotaflow valve. The low rate of gas flow means that the thin layer of solvent is removed very slowly from the surface of the AgX. The smallest sample of water is removed in 20–30 min, while the largest survives for 120 min. Acetonitrile is removed in 100–200 s at a much higher signal (500). Dichloromethane lasts 2–3 s and good spectra are easily obtained.
In some experiments, a cell holder and CaF2 cell windows (Pike Technologies) are used with Teflon gaskets or gaskets made from a polymer film.
The FTIR spectrometer is a Bruker Equinox 55/S equipped with two sources [Globar, mid-IR (MIR); tungsten, near IR (NIR)], two beam splitters [KBr, MIR; CaF2, NIR] and two detectors [DTGS, MCT]. Only the MCT system is used in the MIR for the present research. Infrared spectra are recorded (900–1800 scans, 0.1 s each) continuously over the range from 7000 to 650 cm−1 at a resolution of 4 cm−1. After baseline smoothing, the data are transferred to another computer, the output of the Bruker Opus program is converted to a matrix form in which all but one of the wavelength lists are removed by a Matlab program, and the Origin 6.1 program used for analysis, spectral displays, and plotting. Each scan is regarded as a separate experiment measuring the spectrum of the water film averaged over 0.1 s. As it happens, the electrostriction of the film adjacent to the AgX surface is sufficient to yield excellent spectra as long as the energy input (Sg level) is low, around 100. The temperature of the sample is considered to be around room temperature. A qualitative scheme is under development for relating the temperature of the nitrogen stream (using a coil immersed in a Dewar containing water at a controlled temperature) to the number of spectra (0.1 s scans) recorded for a 0.4 μL sample of a volatile liquid such as n-pentane. At 25 °C, 4 spectra are observed, while at lower temperature, 10 °C, 12 spectra are observed. The scheme has the merit of measuring the approximate temperature at the site of the spectroscopic measurements, but requires more effort and time on the spectrometer for full development.
4. Results and discussion
4.1 High resolution spectra of liquid water
The primary results of measurements of liquid water by thin film spectroscopic techniques are high resolution spectra. We illustrate the spectra (for 4.0 μL) (divided into five ranges of 700 cm−1) in the ESI†: (S4) 4100–3400 cm−1 (S5) 3400–2700 cm−1 (S6) 2700–2000 cm−1 (S7) 2000–1300 cm−1 (S8) 1300–600 cm−1. In the O–H stretching region (S5 and S6)† there are at least 125 distinct peaks, of which we have labeled 42. The reason for labeling so many peaks is to facilitate their use in comparisons. The partial spectra displayed in Figures S4–S8† represent the first spectrum that reached maximum height in the early part of one experiment.To show the reproducibility of the spectroscopic measurements, a list of 65 observed peaks is presented in Table 1 for three 4.0 μL samples and two 0.4 μL samples. A second part of Table 1 is the list of oligomer-type classified peaks largely obtained by calculation.12–17 How can one analyze such a complex spectrum? The initial analysis focused on the O–H stretching region, the region that most water spectroscopists report.
| Experimentalb | ||||||||||||||||||
|---|---|---|---|---|---|---|---|---|---|---|---|---|---|---|---|---|---|---|
| A | 3994 | 3975 | 3934 | 3925 | 3898 | 3884 | 3849 | 3840 | 3826 | 3800 | 3796 | 3782 | 3749 | 3726 | 3714 | 3699 | 3689 | 3677 |
| B | 4000 | 3975 | 3943 | 3925 | 3902 | 3880 | 3849 | 3839 | 3821 | 3800 | 3798 | 3785 | 3742 | 3725 | 3713 | 3699 | 3687 | 3679 |
| C | 4002 | 3977 | 3934 | 3927 | 3906 | 3880 | 3847 | 3838 | 3822 | 3802 | 3794 | 3784 | 3745 | 3730 | 3711 | 3695 | 3688 | 3672 |
| D | 4003 | 3980 | 3937 | 3924 | 3907 | 3888 | 3850 | 3835 | 3822 | 3804 | 3793 | 3780 | 3750 | 3733 | 3708 | 3700 | 3689 | 3670 |
| E | 4004 | 3981 | 3934 | 3922 | 3909 | 3886 | 3847 | 3840 | 3824 | 3807 | 3793 | 3779 | 3746 | 3731 | 3716 | 3700 | 3691 | 3671 |
| A | 3651 | 3642 | 3625 | 3594 | 3574 | 3568 | 3551 | 3546 | 3530 | 3510 | 3498 | 3486 | 3481 | 3472 | 3461 | 3445 | 3429 | 3414 |
| B | 3660 | 3641 | 3627 | 3604 | 3570 | 3569 | 3554 | 3546 | 3529 | 3509 | 3497 | 3486 | 3480 | 3473 | 3460 | 3447 | 3427 | 3413 |
| C | 3651 | 3637 | 3628 | 3601 | 3573 | 3560 | 3558 | 3542 | 3527 | 3504 | 3498 | 3490 | 3483 | 3471 | 3456 | 3441 | 3430 | 3416 |
| D | 3651 | 3642 | 3624 | 3599 | 3571 | 3570 | 3558 | 3546 | 3525 | 3504 | 3494 | 3489 | - | 3471 | 3456 | 3441 | 3431 | 3417 |
| E | 3651 | 3635 | 3625 | 3596 | 3577 | 3570 | 3560 | 3545 | 3532 | 3505 | 3498 | 3485 | 3484 | 3475 | 3461 | 3451 | 3434 | 3415 |
| A | 3397 | 3358 | 3344 | 3332 | 3321 | 3315 | 3308 | 3288 | 3256 | 3237 | 3219 | 3210 | 3201 | 3191 | 3171 | 3163 | 3136 | 3127 |
| B | 3394 | 3360 | 3346 | 3332 | 3323 | 3314 | 3302 | 3285 | 3253 | 3237 | 3220 | 3211 | 3200 | 3190 | 3168 | 3155 | 3134 | 3125 |
| C | 3395 | 3359 | 3343 | 3335 | 3323 | 3316 | 3301 | 3285 | 3253 | 3237 | 3224 | 3217 | 3200 | 3193 | 3169 | 3157 | 3135 | 3128 |
| D | 3394 | 3354 | 3344 | — | 3327 | 3311 | 3305 | 3288 | 3256 | 3234 | 3224 | 3216 | 3205 | 3189 | 3170 | 3163 | 3141 | 3126 |
| E | 3396 | 3356 | 3344 | 3333 | 3319 | 3318 | 3310 | 3288 | 3256 | 3236 | 3218 | 3213 | 3207 | 3186 | 3172 | 3166 | 3137 | 3124 |
| b p1.0025A 4 μl p1.0009B 4 μl d101.0009C 0.4 μl od.0039D 4 μl 1d.0035E 0.4 μl | ||||||||||
|---|---|---|---|---|---|---|---|---|---|---|
| A | 3116 | 3104 | 3086 | 3078 | 3068 | 3049 | 3034 | 2953 | 2921 | 2880 |
| B | 3117 | 3106 | 3088 | 3079 | 3068 | 3051 | 3035 | 2950 | 2921 | 2881 |
| C | 3117 | 3100 | 3086 | 3080 | 3069 | 3051 | 3040 | 2946 | 2921 | 2881 |
| D | 3117 | 3107 | 3084 | 3082 | 3070 | 3049 | 3041 | 2950 | 2920 | 2876 |
| E | 3117 | 3107 | 3085 | 3079 | 3069 | 3054 | 3036 | 2950 | 2918 | 2880 |
| Literature (mostly Calculated with intensities) | ||||||||||||
|---|---|---|---|---|---|---|---|---|---|---|---|---|
| o Key to abbreviations: Cy = cyclic; ch = chair; bt = boat; Bk = book; Bicy = bicyclic a Ref. 12–17 all intensities not listed. c Ref. 17. | ||||||||||||
| Monomer | 3756 | (3736) | 3721[57] | |||||||||
| Dimer | (3730) | 3716[86] | 3700 | (3696)[80] | ||||||||
| Dimer FD | 3732 | |||||||||||
| Trimer 1 | 3706[99] | 3704[7] | 3702[172] | |||||||||
| Trimer 2 | 3716[87] | 3716[68] | ||||||||||
| CyTrimer | 3732 | 3726 | 3715 | 3707 | 3705 | 3701[49] | 3701[97] | 3697 [90] | ||||
| CyTetramer | 3695 | 3694 | 3694 | 3694 | 3693[89] | 3692[90] | 3692 [2] | 3690[98] | ||||
| CyPentamer | 3719 | 3711 | 3709 | 3699 | 3698[78] | 3697 | 3696[57] | 3694 | 3693[73] | 3691 [76] | ||
| CyHexamerch | 3718 | 3717 | 3701 | 3700 | 3700 | 3698 | 3696[10] | 3696[93] | 3695[103] | 3695[22] | 3695[86] | 3694 [86] |
| CyHexamerbt | 3702[69] | 3701[75] | 3699[57] | 3694[93] | 3694 [47] | |||||||
| HexamerBag1 | 3701[102] | 3699[60] | 3697[60] | 3689[78] | 3687 [47] | |||||||
| HexamerBag2 | 3704[76] | 3702[78] | 3695[81] | 3689[61] | ||||||||
| HexamerCage | 3702[68] | 3695[71] | 3694 [76] | 3690[62] | ||||||||
| HexamerPrsm | 3694 [54] | 3694 [118] | 3693[46] | |||||||||
| HexamerBk1 | 3697 [67] | 3696[71] | 3695[75] | 3692 [68] | 3688[66] | |||||||
| HexamerBk2 | 3701[76] | 3701[76] | 3698[73] | 3691 [72] | 3684[65] | |||||||
| Heptamer1 | 3715[91] | 3696[53] | 3696[67] | 3692 [66] | ||||||||
| Heptamer2 | 3701 [73] | 3698[88] | 3696[65] | 3694[74] | 3686 [67] | |||||||
| Heptamer3 | 3714 [90] | 3702[72] | 3699[22] | 3699 [108] | 3690 [69] | |||||||
| Heptamer4 | 3701[78] | 3699[89] | 3699[70] | 3698[72] | 3691 [83] | 3683[67] | ||||||
| OctamerCube | 3690 [16] | 3690[93] | 3689[58] | 3689 [83] | ||||||||
| OctamerBicy | 3706 [76] | 3699[71] | 3696[98] | 3695[72] | 3692 [79] | |||||||
| Monomer | 3652 | 3644 | (3643) [9] | |||||||||
| Dimer | 3644 | 3641[16] | 3564 | 3541 [332] | ||||||||
| Dimer BD | 3601 | |||||||||||
| Trimer 1 | 3635[9] | 3604 [137] | 3597 [246] | |||||||||
| Trimer 2 | 3646[14] | 3643 [13] | 3628 [544] | 3571 [94] | ||||||||
| CyTrimer | 3533 | 3514c | 3507 [528] | 3499 [573] | 3458 | 3455 [18] | 3447 | |||||
| CyTetramer | 3416 [18] | |||||||||||
| HexamerBag1 | 3543 [631] | 3516 [125] | 3501 [679] | 3474 [169] | ||||||||
| HexamerBag2 | 3618 [31 | 3608 [62] | 3534 [250] | 3511 [567] | 3468 [364] | 3434 [426] | ||||||
| HexamerCage | 3595 [400] | 3571 [316] | 3542 [167] | 3479 [4754] | 3427 [601] | |||||||
| Hexamer Prism | 3659 [121] | 3614 [324] | 3604 [30] | 3563 [243] | 3497 [466] | 3460 [431] | ||||||
| HexamerBk1 | 3574 [412] | 3474 [299] | 3460 [828] | 3417 [360] | ||||||||
| HexamerBk2 | 3495 [667] | 3474 [679] | 3461 [851] | 3454 [397] | 3430 [608] | |||||||
| Heptamer1 | 3643 [16] | 3547 [219] | 3520 [1047] | 3478 [311] | 3432 [689] | |||||||
| Heptamer2 | 3591 [236] | 3537 [51] | 3516 [409] | 3489 [121] | 3466 [284] | 3443 [1287] | ||||||
| Heptamer3 | 3642 [17] | 3540 [395] | 3508 [815] | 3470 [384] | 3446 [683] | 3426 [576] | ||||||
| Heptamer4 | 3522 [316] | 3488 [392] | 3474 [272] | 3453 [1020] | 3436 [1195] | |||||||
| OctamerCube | 3556[1004] | 3544 [650] | 3541 [656] | 3521 [46] | 3512 [72] | 3500 [180] | 3498 [171] | 3495 [390] | ||||
| OctamerBicy | 3457 [390] | 3449 [220] | 3437 [403] | 3427 [222] | 3416 [1801] | |||||||
| CyTrimer | 3401 | |||||||||||
| CyTetramer | 3388 [1465] | 3326 | 3315 [0] | 3294 | 3299 | 3387 [1466] | 3294 | |||||
| CyPentamer | 3391 [40] | 3384[76] | 3349[2139] | 3343 | 3292 | 3284 | 3277 [27] | 3275 [2204] | 3258 | 3123 | ||
| CyHexamerch | 3387 [159] | 3374 [1] | 3373 [3] | 3327 [2840] | 3327 [2883] | 3294 | 3283 | 3267 | 3266 [1] | |||
| CyHexamerbt | 3399[170] | 3391[36] | 3375[240] | 3345[2358] | 3329 [2878] | 3279 [10] | ||||||
| HexamerBag1 | 3303[664] | 3241[1821] | 3162[723] | |||||||||
| HexamerBag2 | 3270[1169] | 3194 [826] | ||||||||||
| HexamerCage | 3391 [597] | 3358 [696] | 3174 [827] | |||||||||
| HexamerPrsm | 3401 [435] | 3401 [576] | 3130 [1031] | |||||||||
| HexamerBk1 | 3335 [681] | 3279 [2162] | 3221 [217] | |||||||||
| HexamerBk2 | 3407 [318] | 2987 [1254] | ||||||||||
| Heptamer1 | 3391 [246] | 3366 [1039] | 3327 [1461] | 3238 [601] | ||||||||
| Heptamer2 | 3288[1081] | 3206 [985] | ||||||||||
| Heptamer3 | 3398 [902] | 3358 [752] | 3134 [901] | |||||||||
| Heptamer4 | 3378 [678] | 3113 [1042] | ||||||||||
| OctamerCube | 3229 [1688]] | 3226 [1702] | 3204 [42] | 3184 [14] | ||||||||
| OctamerBicy | 3404[1452] | 3384 [1842] | 3355 [242] | 3349 [267] | 3307 [115] | |||||||
4.2 “Lifetime tagging”
As stated at the end of Section 2, sets of successive spectra revealed numerous peaks that appear to last seconds. If several peaks simultaneously disappear, it would be plausible to infer that they arise from a single species. Ultimately a set of peaks representing the spectrum of an oligomer could be generated. We term this feature “lifetime tagging”. We show later that the equilibrium species reappear over and over (sec. 5.4). Thus, the peak lifetimes are a potentially useful property of the absorption peaks. The clearest application of such tags is the identification of oligomers. One must examine the successive spectra visually due to small shifts in the location of the peaks; the simplest cases are those for which the peaks are literally on top of each other, with some variation in absorbance. The persistence or “metastability” of four peaks is shown in Fig. 7, to give some idea of the procedure. In Table 1 we can see that the peak at 3840 cm−1 (within 5 cm−1) appears in all 5 experiments.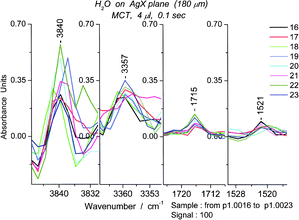 | ||
| Fig. 7 Lifetime tagged bands, two from the OH region and two from bending region, all from the same set of spectra (#s16–23) obtained using 0.1 s scans for a sample of 4 μL. | ||
Are there oligomers which exhibit the peaks that are listed in Table 1? Bearing in mind that the calculations may not be exact, we can, for the real sample, look for peaks among those that have been calculated for the cyclic trimer, the hexamer prism, the hexamer book 2 and the octamer cube. Bands calculated for the cyclic pentamer and the chair form of the cyclic hexamer, all within 1–3 cm−1 of the experimental value, can be associated with the sym OH stretch. We cannot conclude that the peaks belong to any of these particular species. At this point we utilize the principle of lifetime tagging.
4.3 Oligomers identified
As an initial exploration of lifetime tagged peaks, we examined all OH stretching peaks between 2600 and 4100 cm−1 by first inspecting spectra 25, 26 and 27 in the p1 series (first line in Table 1 experimental peaks). We selected a peak at 3711 cm−1 with “only” 1.3 s lifetime as an oligomer. This turns out to be a band for the cyclic pentamer, a species that is among the most stable among water oligomers.13 An accompanying band at 3258 cm−1 is stable for at least 1.5 s and belongs to the cyclic pentamer.The peaks around 3711 cm−1 are too numerous and present in too many oligomers to afford a reliable indication for the cyclic pentamer. We turned to the peaks in the bending region and found that the 1716 cm−1 peak seemed to be a useful clue. Picking a spectrum (#31) with a strong peak at 1716 cm−1 (Fig. 8), we examined the OH region for which the calculations for the cyclic pentamer13 suggest peaks between 3100 and 3400 cm−1. It was amazing to find that spectrum #31 contains 5 groups of well defined OH stretching bands in this region including a characteristic group of three pairs of narrow peaks on the long wavelength side. (Fig. 9)
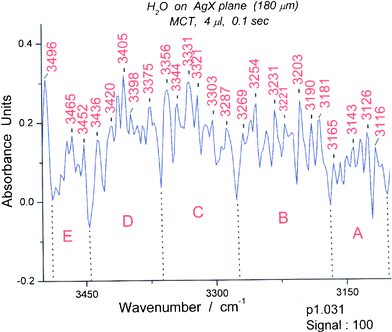 | ||
| Fig. 9 Spectrum (#31) of water between 3100 and 3500 cm−1. The wavelength limits for the five spectroscopic groups are: A (3103–3170 cm−1), B (3170–3276 cm−1) , C (3276–3363 cm−1), D (3363–3446 cm−1) and E (3446–3488 cm−1). The groups correspond in appearance to those expected for the cyclic pentamer (see Fig. 10). | ||
To account for the large number of peaks belonging to a particular oligomer, in this case, the cyclic pentamer, we introduce the idea of isomotomers, species that differ only in the cooperativity of the vibrations (word derived from isomer and motion). A limited version of this idea was proposed in connection with cyclic hexamer spectra.18 The formulas for the cyclic pentamer isomotomers are shown in Fig. 10. The analytical principle is simple. The lowest energy vibration is the one in which all 4 (++++, pentamer) external OH bonds are moving in the same direction. The energy of a particular symmetric vibration is modified by the effect of the four other OH motions, as indicated in the list included in Fig. 10.
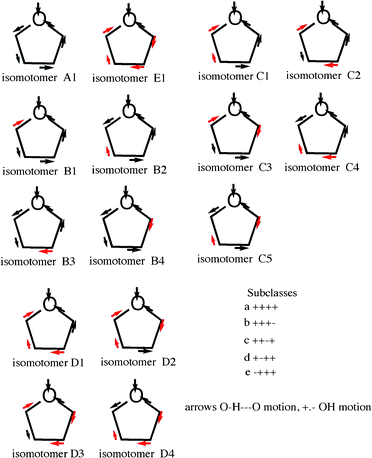 | ||
| Fig. 10 Isomotomers of the cyclic pentamer of water. The black arrow in the ring near the oxygen (O) at the top represents the direction of motion of the H in the hydrogen bond to the next oxygen. The black arrows around the rings indicate motion in the same direction. The red arrows are directed in the opposite direction from the black arrows. The motions of the hydrogens external to the ring are labelled (+) in one direction and (−) depending on their relation to the H external to the ring. The primary vibration is that of water at the top. Its energy varies according to its interaction with the all of the other motions. A complete set falls naturally into five groups (number of variants), A (1), B (4), C (5), D (4), and E (1)). The figure includes the first and last isomotomers, A and E, along with the B, C and D groups. The pattern of the spectroscopic groups (Fig. 9) reflects unusually well the pattern of the isomotomers but must include contributions from other oligomers. | ||
4.4 The “2100 band” of water
Another set of highly structured absorption bands due to the bending motion occurs between 1450 and 1915 cm−1. Two further and weaker bands (each set 455 cm−1 in width) that appear to be bending + libration combinations are found between 1915 and 2825 cm−1. The primary bending bands and two “extra” bands are illustrated in Fig. 11. The parallelism between the two bands and the sharpness of the peaks implies that the water molecule(s) involved in the coupling are in a location symmetric to the bending motion and hydrogen bonded to the oxygen. The classical suggestion19,20 that the 2150 cm−1 band of water absorption is derived from the bending plus libration is herein confirmed but modified.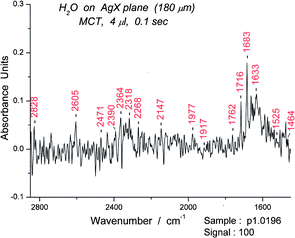 | ||
| Fig. 11 Infrared spectrum of water between 2850 and 1450 cm−1. Three putative groups of combination (bending + libration) bands, 1464–1917 cm−1, 1935–2390 cm−1 and 2395–2850 cm−1 are shown. Some CO2 bands are also present. | ||
5. Specific oligomers that are wholly water
We have succeeded in identifying the spectra of four oligomers in addition to the pentamer noted above. Oligomers were chosen for their prominent bending bands. Their nature was confirmed by an examination of the symmetric OH stretching bands or by a consideration of hydrogen bonding properties. The assignment of oligomers was dictated by their stabilities as determined by calculations, i.e. that the oligomers for which we see bending bands are the most stable. The chosen oligomers are the chair form of the cyclic hexamer, the boat form of the cyclic hexamer, and the bicyclic hexamers, book 1 and book 2. In the search for oligomers, we used lifetime tagging within a 100 spectra (composite) set and concentrated on the bending and deformation regions of the spectra. We also used Abs vs. t (time) plots to find the highest peaks for one oligomer that coincided with the lowest peaks for another. In that way, we could select spectra that had a preponderance of one oligomer.5.1 Cyclic hexamer (chair form)
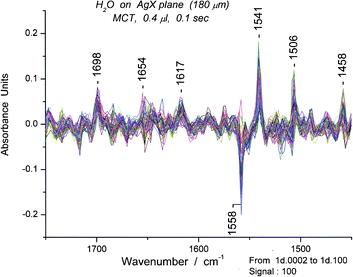
The composite spectra are examined for “tagged” peaks, i.e. peaks that have appeared in many of the spectra and therefore represent common features. Those in the bending region are relatively restricted in number. Unusual deformation peaks also occur in this region. For example, a composite set of ∼100 spectra for 0.4 μL has its most prominent band at 1541 cm−1 which we classify as a deformation band. (Fig. 12) Focusing on the 1541 peak, we then search for a “clean” spectrum in the set, usually one of those with the highest absorbance and lacking other prominent peaks. By plotting absorbance at 1541 cm−1versus time, we can locate specific spectra with high absorbance. Since we surmised (on the basis of proximity and shape) that the 1558 cm−1 was also a cyclic hexamer we also searched for a spectrum with minimal absorbance at 1558 cm−1. (S9) We chose spectrum #95 for more detailed examination (Fig. 13).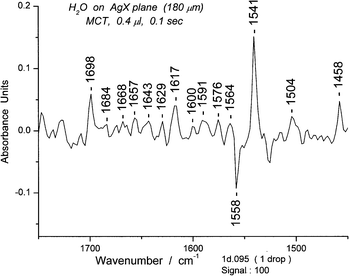 | ||
| Fig. 13 A water spectrum showing the bending and deformation region (1450–1750 cm−1) of spectrum #95. | ||
For spectrum #95, again we encounter the amazing result that there are groups of peaks, this time six (A–F) in the longer wavelength (“symmetric”) OH stretching region. (Fig. 14) These are A (3110–3213 cm−1), B (3213–3311 cm−1), C (3311–3390 cm−1), D (3386–3447 cm−1), E (3447–3527 cm−1), F (3527–3606 cm−1). The shorter wavelength region (3600–3900 cm−1) is segmented somewhat less obviously into three groups, each of which seems to have two parts, i.e. 6 groupsin toto. The group limits are given in the caption for Figure S10.† A set of isomotomers for a water hexamer falls naturally into six groups (illustrated in Figure S11†) instead of the five groups found for the cyclic pentamer.
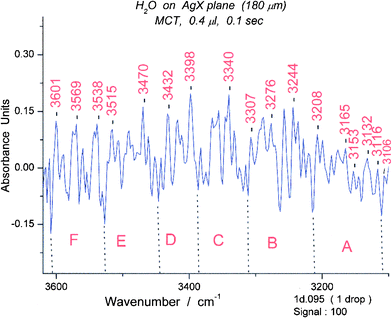 | ||
| Fig. 14 Spectrum #95 of water in part of the OH stretching region, 3100–3600 cm−1. The wavelength limits for the six spectroscopic groups are: A (3110–3213 cm−1), B (3213–3311 cm−1), C (3311–3386 cm−1), D (3386–3447 cm−1), E (3447–3527 cm−1), F (3527–3606 cm−1). The groups correspond in appearance to those expected for the cyclic hexamer (see S11). | ||
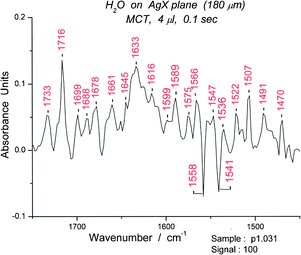
Overall, the results imply that the dominant component of the water, at that moment, is a cyclic hexamer. Since the one under discussion appears to be the most stable cyclic hexamer, we assign its structure as the chair form. The ten spectra before and after #95 show that the chair form of the cyclic hexamer has an appreciable lifetime, at least 1.0 s (not shown). After we succeeded in identifying this oligomer, we realized that the tagged peak at 1541 cm−1 had served a marker for the cyclic hexamer oligomer of water. We were then encouraged to examine other tagged peaks and thus search out other oligomers.
5.2 Cyclic hexamer (boat form)
As noted in the previous section, we assumed that the tagged deformation peak at 1558 cm−1, close to the peak of the chair form at 1541 cm−1, was a marker for the boat form of the cyclic hexamer. The relative stabilities of the chair and boat forms of the hexamers were reported previously.18 We then increased the amount of water on the surface, resulting in increases in the bending peaks for other oligomers. Figure S12† shows that the intensity of the 1558 cm−1 peak increased markedly in a composite 0.8 μL spectrum over that for a composite 0.4 μL spectrum (Fig. 12).We selected spectrum #815 in a spectroscopic series for 0.8 μL (S12) because it displayed a strong 1558 cm−1 peak. The results illustrated in Fig. 15 and 16 show respectively the bending and deformation peaks and the spectrum for sixgroups in the OH stretching region from 3050–3600 cm−1. A spectrum for the range for 3630–3900 cm−1, with three apparent groups, each split into two, giving six groups in total is given in S13. The unusually high peaks at 3502 cm−1 (Fig. 16) and at 3738 cm−1 (S13)† resemble those of water dimer21 influenced by the temperature.22
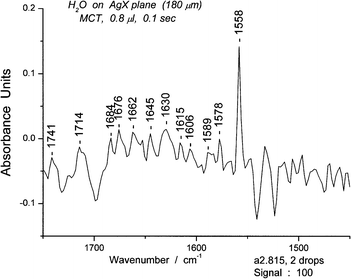 | ||
| Fig. 15 The bending and deformation portion of the water spectrum #815 for the range 1450–1750 cm−1. | ||
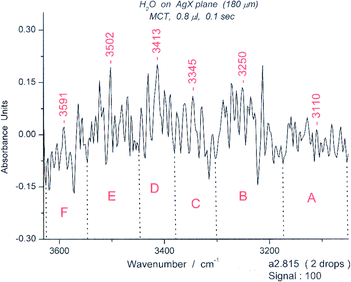 | ||
| Fig. 16 The “symmetric” portion (OH stretching) of the water spectrum #815 from 3100–3600 cm−1. The wavelength limits for the six spectroscopic groups are: A (3053–3174 cm−1), B (3174–3303 cm−1), C (3303–3381 cm−1), D (3381–3448 cm−1), E (3449–3574 cm−1), F (3574–3626 cm−1). The groups correspond in appearance to those expected for a cyclic hexamer (see Fig. S11). | ||
5.3 Book 1
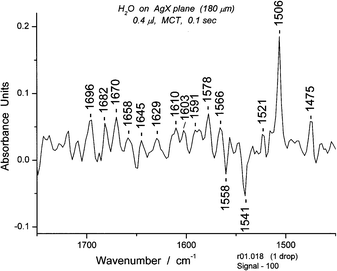
We noted in the composite set in Fig. 12 as well as in other sets that there was a tagged peak at 1506 cm−1. After an extensive search through our experimental data we found in one series a spectrum (#18) with a peak that had a high absorbance at 1506 cm−1. From the appearance of other portions of the same spectrum, we concluded that the species responsible for the spectrum was a book. According to calculations13 book 1 is somewhat more stable than book 2. Our spectroscopic results favor book 1 and we have made that our assignment for the 1506 cm−1 peak. The peak was so strong, especially for a 0.4 μL sample, that book 1 must be the dominant species in the sample. To explain this result, we introduce the idea of “seeding”, that is, a species that provides a template on which similar species can be formed. This situation lasts at least 0.5 s, and also occurs for the chair form of the cyclic hexamer. The relatively high concentration of the chair form of cyclic hexamer and book 1 formed and removed over a second or less suggests that their high transient concentrations are induced by seeds. A possible mechanism for seeding under these conditions will be considered elsewhere.Assuming that the absorption coefficients for all of the species are similar, the sum of the heights of the strong peaks should be the total amount of oligomers. The fractions of pentamer and hexamer (chair or boat) might be 0.3–0.6. The correspondence between the isomotomer distributions and the groups of symmetric OH stretching bands suggests significant fractions of these specific oligomers (ca. 0.5). It might be interesting to look for a temperature dependence on the spectra.
The spectrum in the bending and deformation region is shown in Fig. 17. The main peak is at 1506 cm−1. The longest wavelength OH stretching region (Fig. 18) again contains reasonably well defined groups, in this case six, as suggested by the isomotomer model for the books (not shown). These are analogous to those for the isomotomers of a cyclic hexamer. In addition to the six groups of peaks expected and observed, there should be ∼10 sub-peaks for each group according to the correlation of the motions of the hydrogens attached to the ring. The spectrum indeed contains approximately that number of peaks (including some shoulders) in each group.
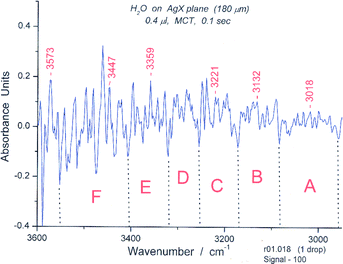 | ||
| Fig. 18 Spectrum #18 of water in the “symmetric “ OH stretching region from 2950–3600 cm−1. The wavelength limits for the six spectroscopic groups are: A (2958–3085 cm−1), B (3085–3172 cm−1), C (3172–3255 cm−1), D (3255–3322 cm−1), E (3322–3407 cm−1), (F) (3407–3553 cm−1). The groups correspond in appearance to those expected for a bicyclic hexamer. | ||
The situation for the “asymmetric region” is less clear; the six groups of peaks between 3550 and 4000 cm−1 are somewhat less well-defined than those in the “symmetric” region. (S14)† These results support the choice of the formula shown in Fig. 19 for Book 1, and further analysis using data on hydrogen bonding added strong support for this choice.
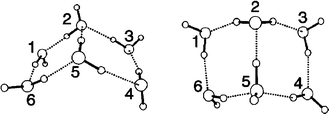 | ||
| Fig. 19 Formulas for Book 1 (left) and Book 2 (right). Adapted from ref. 13. | ||
The spectral region between 650 and 1200 cm−1 is usually populated by libration bands, including those implicated in combination bands with the bending bands. However, in the case of Book 1, an unusually strong band at 1028 cm−1 appears along with 10 or so sharp bands that are three times as strong as the usual librations. This is due to the cross-ring (intraring) H-bond, strong because of restricted rotation for the H-bond. (Fig. 20) Its correlation with the peak at 1506 cm−1 is direct evidence for a connection between the two bands. (See section 5.4) The intensity of the band at 1028 cm−1 is readily explained by the relationship between the neighboring H-bonds (1–6 and 3–4). The 1–6 bond is antiparallel to the transition moment of the intraring H-bond while the 3–4 bond is parallel. Thus, an enhanced absorption intensity (Abs 0.14) is not surprising. In the case of Book 2, much lower absorption intensity (Abs 0.03) would be expected because the 1–6 and 3–4 hydrogen bonds are antiparallel to the transition moment for the intraring H-bond.
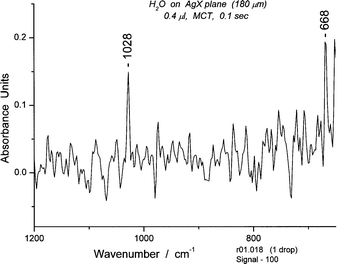 | ||
| Fig. 20 A portion of the spectrum #18 of water between 650 and 1200 cm−1. The band at 668 cm−1 is due to CO2. | ||
Strong evidence that Book 1 is a metastable species of unique geometry rests on the OH stretching bands seen in a comparison of spectra #s 17/18 and #s 19/20 in which one observes the close parallelism between the many peaks (∼60) of these pairs. This implies that we are looking at the buildup of spectrum #18 and the beginning of its disappearance. At least two spectra before and two spectra after those shown are also very similar. These spectra show that the lifetime of book 1 is > 0.8 s. This point is illustrated with a set of spectra (#s 15–21) in S15† (over a restricted range for clarity) in which there are a large number of tagged peaks.
Once more, a tagged peak is identified as a marker peak, this time for the oligomer book 1.
5.4 Book 2
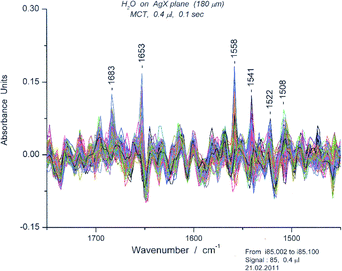
Another tagged peak in various spectral sets was that at 1520 cm−1. We searched for spectra in which the 1520 cm−1 peak was prominent. In practice, one needs to include 1519–1522 cm−1 in the search. We found two that had a peak with an absorbance of 0.11 (#s753, 913). A 100 spectrum set of the results for #s 700–800 is shown in S16.† (The set for #s 900–1000 was similar and is not shown).We selected spectrum #753 to define the spectrum of what is assigned the structure of book 2, based on the proximity of the bending maximum to that of book 1. Another peak (1533 cm−1) in the bending region is significant (Abs 0.06) and is closely related to the peak at 1522 cm−1. In fact, when one peak is strong, the other is weak and vice versa. The presence of six groups of peaks in the “symmetric” OH stretching region supported the assignment. These are illustrated in Fig. 21 (bending and deformation region) and Fig. 22 (“symmetric” OH stretching region). S17 shows the “asymmetric” OH stretching region.
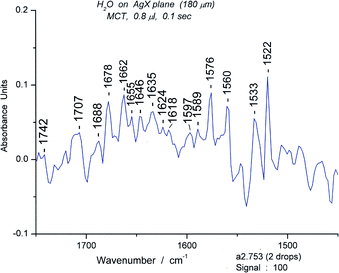 | ||
| Fig. 21 The bending and deformation region (1450–1750 cm−1) of the water spectrum of #753. | ||
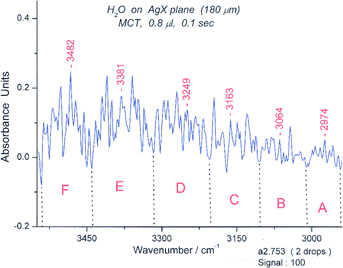 | ||
| Fig. 22 Spectrum #753 of water in the “symmetric “ OH stretching region from 2950–3600 cm−1. The wavelength limits for the six spectroscopic groups are: A (2943–3010 cm−1), B (3010–3104 cm−1), C (3104–3204 cm−1), D (3204–3317 cm−1), E (3317–3441 cm−1), F (3441–3540 cm−1). The groups correspond in appearance to those expected for a bicyclic hexamer. | ||
The bending peak of book 2 (at 1522 cm−1) has an absorbance of 0.11. The “symmetric” OH stretching region (Fig. 22) seems to be “clean” and has six groups of peaks, consistent with the isomotomer model. The “asymmetric” peaks are more difficult to assign at this juncture. (S17)
To probe the possible relationship of the deformation band at 1533 cm−1 to the 1030 cm−1 peak, we have plotted the intensities of the former against those of the latter, found in the long wavelength spectrum of book 2. A striking correlation was found; the straight lines indicate that these correlations represent cooperative motions (Fig. 23).
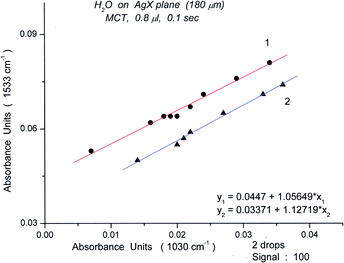 | ||
| Fig. 23 Plots of absorbance for the bending peak of Book 2 (1533 cm−1) versus the absorbance of the H-bonding libration peak (1030 cm−1). | ||
The excellent correlations displayed in Fig. 23 for spectra measured in the sequence (1000 spectra, 100 s) demonstrate that the oligomer compositions are recreated at various times. It should be noted that the points are from widely separated times in the sequence, ranging from spectrum #105 to spectrum #990. The concidence of oligomer compositions is illustrated in S18 for the bending region. This figure shows that the environment is similar for all the points on the line.
The correlation establishes the peak at 1533 cm−1 as a marker peak for the book 2 oligomer. (The peak at 1522 cm−1 is also a marker peak for book 2.)
In a corresponding correlation for Book 1, we plotted the intensities for the 1506 cm−1 peak against the intensities of the libration at 1028 cm−1. The results are shown in S19. An apparent scatter appeared with the use of > 30 data points. The straight lines seen in Fig. 23 served as a guide for drawing six lines. The spectra belonging to each line suggest that the oligomer composition is similar for all of the points of a particular line, but varies from line to line. Contrary to the gross expectation that a solvent made of water would have the same “polarity” regardless of oligomer composition, theoretical analysis shows that different oligomers would have different polarizabilities,23 and thus, different “effective polarities”.
The correlations demonstrate that particular combinations of oligomers are recreated over the course of the spectroscopic measurements (usually 100 s). We are thus able to obtain correlations for similar oligomer compositions generated at widely different times during an experiment. This may be useful in collecting data for particular oligomers that have shorter lifetimes than those usually used to verify the stability of an oligomer.
The striking prominence of the H-bond peaks for Books 1 and 2 suggested that we inspect the corresponding regions for the chair and boat forms of the cyclic hexamer. The intensities of the peaks were indeed enhanced for both oligomers, chair (two peaks at 1025 and 1015 cm−1) and boat (1039 cm−1). Hydrogen bonding accounts for the enhanced intensities of these peaks and signifies a useful property helpful in the search for other oligomers.
The intensities of librations at 1028 and 1033 cm−1 give linear correlations with the intensities of the bending peaks at 1506 cm−1 and 1533 cm−1. The latter are thus hydrogen-bonded and shifted from “normal” peaks at 1497 cm−1 and 1520 cm−1. We have seen directly the inverse relationship between these peaks (not shown) but easily visible in the spectra shown in S18. The somewhat broad peak at 1533 cm−1 includes some contribution from a peak at 1527 cm−1, probably indicating a small variation in the structure of the H-bonded arrangement in book 2.
The labeling of the marker bands as deformations rather than simply bending arises from the fact that preliminary examination of simple alcohols indicated that such bands were also present in their thin film spectra. This assignment of these peaks as deformations describes their behavior well.
5.5 Past studies of water hexamers
The impetus for studies of isolated small clusters has been to provide data not readily available from classical FTIR measurements of the three-dimensional hydrogen-bonded complex liquid water. Vibration–rotation-tunneling spectroscopy of the hexameric cluster suggested a cage structure,24,25 which was found to be the most stable of the hexamers by calculation.24–26 These calculations also suggested that certain hexamers, including the prism, book, cyclic hexamers (chair and boat), had stabilities close to that of the cage structure. Similar results were obtained by others.13,18,27,28Book 1 isomer was detected16 by infrared depletion spectroscopy of clusters produced by expansion of water and helium.29 The present work displays many more peaks, not too surprising in view of the greater resolution of the direct IR measurements, but a peak at ∼3575 cm−1 was identified as the intraring H-bond. We have found an O–H stretching peak at 3573 cm−1, one correlated with a libration at 1028 cm−1 and thus the band reported for the gas phase cluster. However the complexity of the OH stretching region requires further examination of this relationship. Both of the correlations (Book 1 and Book 2) established in S19 and Fig. 23 respectively involve the peak for an intraring hydrogen bonded oxygen associated with a deformation motion. A somewhat altered form of what is called book 213 is referred to as a prism-book in one report28 and two different forms of book 1 have been calculated as book 1 and book 2 in another paper.27
6. Metastability of peaks
How can a dynamically fluctuating structure exhibit metastable peaks? The current view of water structure is that changes take place by rotational jumps but not every jump is successful in changing the structure. The average percentage of successful jumps is thought to be ∼20%. Experimental and theoretical studies have shown that hydrogen bond switching is concerted and involves large angle reorientation with later research showing evidence that translation and reorientation are intertwined with hydrogen bond rearrangement in the collective reorganization of the liquid.30–34 In order to decompose a hexamer, however, we need simultaneous successful changes on at least 5 of the components, making the success (1/5)5 or 3 × 10⁻⁴. Thus, the time scale for the hexamer lifetime would be microseconds. Additional retardation comes from the interaction of the dipolar AgX surface with the dipolar water structures, an interaction (i.e., electrostriction) that should be greater for larger oligomers. The average structure is tetrahedral by X-ray scattering,35,36 but our observation of discrete peaks for the infrared absorption bands proves that discrete structures must be present on the fs time scale, at least near a polar surface. These considerations suggest the possibility that under probing by minimal energy infrared radiation, discrete “linear” oligomers survive for seconds. We have examined small samples of water under conditions for which we increase the radiative energy by increasing the signal (Section 6.1).6.1 Averaging through signal increase
The minimum signal that gave useful spectra of water was 85. Examination of the data over the course of the experiment (1000 spectra, 100 s) suggested that motion was very restricted by electrostriction and that equilibration did not occur within the time period of the experiment. Nevertheless, the appearance of the peaks, between ∼1730 and 1600 cm−1, suggested that a set of oligomers had formed, ranging from trimer to decamer in length. (Fig. 24) We cite in a number of places the contribution of linear oligomers. We then examined a series of water spectra at Sg 100 up to Sg 3750, and found that the spectra undergo a rise in the “usual bending” region which became quite substantial at Sg 3750, the technical limit for the fiber.We illustrate these results by obtaining the difference between the first spectrum at any Sg that is raised significantly (i.e., enhanced) (“u”) and the last spectrum without enhancement (“d”). In this way the effects of increased signal (u–d) is clear and are displayed in Fig. 25.
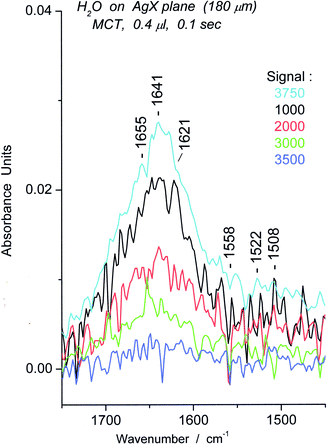 | ||
| Fig. 25 Spectra representing the difference (u–d) between initial enhanced spectrum (u) and previous “unenhanced” spectrum (d) of water on AgX surface for particular Sg from 1000–3750. | ||
To summarize the effects of signal energy on the spectra, change from Sg 100 to 500 brings about small increases in oligomer concentration associated with the surface (not shown), while change from Sg 1000 to 3750 brings about a substantial increase in linear oligomers. The sharpness of the peaks in the spectra decreases markedly with an increase in energy.
How can we account for the changes in the infrared spectra of water as a function of signal energy? There are at least two sources for new absorbing material. The first is chemical transformation of weakly absorbing water into oligomers that have a stronger absorption, i.e. dissociation of compactly structured oligomers to more open “linear” oligomers. The absorption spectra in the OH stretching region show few signs of free water or dimer in amounts sufficient to account for the spectroscopic changes. Thus, the linear oligomers should include a distribution from trimer to decamer as stated in the first part of this section. A second source might be synthesis or migration of material from the “bulk phase”, the water lying above the layers probed by the evanescent waves. In previous work, we have established a limit to the amounts probed by the evanescent waves of about 10–12 μg (40–50 monolayers), so this supra-layer could only function through physical exchange. This possibility will be evaluated in future research. The important point is that increase in signal energy “recovers” an IR spectrum similar to those obtained by others who use the full energy of the IR souce in measuring the spectrum. In preliminary studies using a CaF2 cell, there is little indication that “bulk” water contains the peaks in the bending region that are so characteristic of the usual water spectrum. It is difficult to carry out a measurement for which the influence of the surface is minimized. Perhaps non-polar windows (e.g.silicon) might be helpful. Thus, this important question must be regarded as open at this time.
We want to mention for the benefit of those who lack access to our cell or its equivalent that a pair of CaF2 windows were combined in a cell holder with a gasket cut from stretched plastic with a thickness of 10 μm, derived from the volume of liquid required for filling the cell, in this case 80 μL to be compared with 90 μL needed for a cell constructed with a 15 μm gasket. A Teflon spacer of 6 μm is available.34 We found empirically that suitable spectra were obtained using a volume of 6 μL although the nominal volume of the cell is 80 μL. (Details of the procedure will be discussed elsewhere, Kosower, Markovich and Borz, to be submitted).
7. Other polar liquids: N-methylformamide and dichloromethane
A brief mention of several results obtained with the thin film IR spectroscopic technique for other polar liquids is given here. We have compared the spectra of N-methylformamide (NMF) at Sg 100 and Sg 1000 on AgX. At Sg 100, there is not enough energy to overcome the effects of electrostriction (needed, Sg ∼150), yet the initial reasonably strong absorption (Abs 0.5 at 1653 cm-1) decreases about as rapidly as in the case of measurements at Sg 1000. The spectroscopic outcome is very different, with a mixture of small oligomers being formed at Sg 100 and a hexamer with a very low absorbance being formed at Sg 1000.NMF at Sg 1000 revealed “hyperplectic” (simple and complex) behavior and was converted through observable steps to a cyclic hexamer over about 80 s.4 The latter was shown to be unaffected by treatment with dichloromethane (DCM). At Sg 100, the amide I IR band was initially even higher than that found for higher signal intensities (i.e.Sg > 150) but then decreased. The maximum absorbance in the amide I region at Sg 100 is consistently about 0.5 for the “standard experiment” (10 μg NMF in 4.0 μL DCM) in contrast to the 0.33 usually obtained at higher signal intensities (Sg 1000). The decrease in the maximum absorbance obtained for NMF at Sg 100 is (a) similar in rate to that at Sg 1000, (b) occurs in steps that are less numerous than those at Sg 1000, (c) ends at an absorbance that is higher than that of the cyclic hexamer, and (d) displays a final IR spectrum different from that of the cyclic hexamer. That a different species has been formed is proven by the spectroscopic changes obtained on treatment with DCM at Sg 100 in contrast to the lack of change for similar treatment of the cyclic hexamer at Sg 1000. (Fig. 26) Not shown is the fact that the starting spectrum (that containing the cyclic hexamer) is reformed on evaporation of the DCM at Sg 1000 but not at Sg 100.
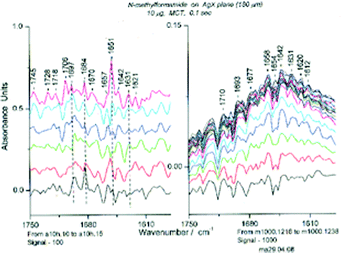 | ||
| Fig. 26 Spectra of NMF in the Amide I region at Sg 100 (left, spectra 10–15, each separated by 0.125) and at Sg 1000 (right, spectrum 16– max at spectrum 38) after treatment with dichloromethane (DCM). | ||
No chemical reaction seems to have occurred, and yet the absorbance has decreased. In the case of the cyclic hexamer (very low absorbance), every peptide bond must have a transition dipole with a direction opposite to the dipole of the peptide bond on the opposite side of the ring, leading to a low absorption coefficient. The initial loading of the NMF oligomers yields perpendicular helices with the O of the amide group pinned to the surface by the Ag+37, thus restricting the motion of the bound molecules even more than for the surface electrostriction. It is important to know that the crystal of NMF contains right- and left-handed α-helices,38 and similar structures for the liquid in the thin film. If some of these inverted we would expect a decrease in absorbance of the whole system. The decrease in absorbance results from the apposition of two oligomers with oppositely directed dipoles, the first time that such an event has been observed. This is a new phenomenon in the infrared spectroscopy of amides and peptides. Not only does this explain the decrease in absorbance at low signal intensity but has led to an explanation of the moderate and somewhat diverse absorbance (usually 0.33–0.35, but sometimes as low as 0.2 or as high as 0.4) of NMF formed at Sg 1000 (Kosower, Markovich and Borz, to be submitted).
The spectrum of CH2Cl2·(DCM) in the bending band at 1265 cm−1 shows that very volatile liquids may be easily be measured (not shown). Parallel results are seen for other halogenated compounds, including CD2Cl2·DCM-(d2), CH2BrCl and CH2ICl. Mixtures may be examined, and separate bands are observed for DCM and DCM-(d2), with apparently separate stacks for each on the AgX plane (Kosower and Borz, unpublished results).
8. Conclusions
We can divide the results of our studies into several groups: (a) the high resolution infrared spectroscopic measurement of a liquid (b) detection of transient oligomers and the elucidation of their structure and spectra (c) the use of other infrared transmitting surfaces (d) effects on spectra due to signal energy (e) introduction of the new spectroscopic technique of lifetime-tagging. These results exemplify the value of our new technology for thin film spectroscopy.(a) The high resolution infrared spectra of water on a surface of crystalline AgX (AgBr:AgCl) at ambient temperatures. The AgX substrate is particularly apt for ATR measurements because of its high transparency over a broad transmission range, 0.4 μm–25 μm, availability as a plane with appended cylindrical ends, non-toxicity, and stability in the absence of short wavelength visible light. The resolution is suitable for many types of spectroscopic analysis including identification of transient structures such as oligomers. The short scan time permits the acquisition of 800–1800 spectra (80–180 s), each spectrum representing a separate experiment. No averaging with consequent loss of spectroscopic information is needed. Lifetime tagging using 100 spectra sets is used to select marker peaks, usually bending and deformation bands in the case of water. The highest absorbance marker peaks are part of individual spectra that are then examined in detail. The “symmetric” portions of the OH stretching bands have provided the most information in the present research, and unusually strong hydrogen bonding bands could be correlated with the marker peaks.
(b) The detection of transient oligomers was made possible by electrostriction of the molecules in the liquid adjacent to the surface. The dipoles in the polar surface interact fairly strongly with the dipolar molecules in the liquid on the surface, leading to retardation of their motion. Electrostriction represents a new spectroscopic tool for detection oftransient species such as the oligomers of water. Each oligomer seems to be characterized by one or two marker deformation bands. The “regular” bending bands have been labeled but not analysed in detail. Many of these are “linear” oligomers. The corresponding OH stretching regions contain the number of bands expected on the basis of the isomotomer model, most clearly for the chair form of the cyclic hexamer and the book 1 oligomer. Additional data on H-bonding support the assignments for the boat form of the cyclic hexamer and for book 2, illustrated next to book 1.
The correlations of the intensities of the marker peaks for books 1 and 2 with the intensities of corresponding H-bond librations represents remarkable support for the structural assignments, inasmuch as the very different intensities of the H-bonds can be easily explained.
“Seeding” is an idea well known in synthetic chemistry in which a nucleus or template can induce the formation of like molecules. The relatively high concentrations of the chair form of cyclic hexamer and book 1 formed and lost over a second or less suggests that their increased concentrations are induced by seeds. The mechanism of the seeding over the scale set by size of the planar element will be considered elsewhere.
(c) The use of other infrared transmitting surfaces. Polar liquids interact strongly with polar surfaces such as AgX and CaF2. KRS-5 (TlBrTlI) and ZnSe are candidates with good IR transmission ranges, but the former fiber is toxic and the latter can be converted to fibers only with cladding.39 Fixed angle ATR crystals can be made from many materials but have a higher penetration depth for the samples. In essence, AgX seems to be the ideal material for thin film IR spectroscopy and the fact that it can be made in an ideal form (fiber-plane-fiber configuration) is a great advantage. The AgX has proved very stable and useful in our research. The only other polar surface examined thus far is CaF2 used in the form of an infrared cell window. The spectra of the oligomers was very clear with positions quite similar to those measured with AgX. Thus, the spectroscopic properties of the oligomers are, for the moment, considered independent of the substrate. Other types of materials (silicon, sapphire or silicon nitride) are candidate surfaces for future study. Restricted motion has been observed for a C18 alkanol monolayer on sapphire by X-ray scattering.40 Results for other polar liquids (D2O, H2O18) will be reported in due course.
(d) The signal energy should be limited to the lowest practical values to obtain information on the structures present on the surface. The higher the signal energy, the greater the change in the shape of the bending region spectrum. In the prologue long scans were seen to yield spectra suitable for general identification but not suitable for detailed spectroscopic analysis and their Gaussian resolution cannot yield the “true” peaks of the sample.
(e) Lifetime-tagging, the recognition of persistent spectroscopic absorption peaks, seems to be useful in elucidating the presence of oligomers. The viscosity of the sample would no doubt be increased by the restriction imposed by the polar surface on the sample and may be a parameter useful in selecting experimental targets.
The multiple lines obtained from plots of the intensities of bending frequencies versus those of H-bond librations are an indication of different “solvent polarities” for different oligomer mixtures.
The tetrahedral arrangement that has been adduced for water is accompanied by a fluctuating range of linear oligomers, probably including trimers to decamers. These can be trapped briefly in the motionally restricted region above polar surfaces and could have an influence on such processes as motion of water into cells, rippling in bilayers, and in general local phenomena at interfaces.
The methods developed here should be applicable to a wide variety of polar liquids. Each sample run (1000 or more spectra) represent a 1000 or more experiments in the microscopic organization of a polar liquid. Since sample size can be on the order of micrograms, a wide variety of liquid materials can be used, including those with isotope substitutions. The effects of signal size can also be explored.
The new technology is easy to use and may be used with other substrates such as calcium fluoride. The world of mesoscopic and microscopic infrared spectroscopic behavior is now open for exploration!
Acknowledgements
Funds for the Bruker FTIR Equinox 55/S were provided by the Alzheimer Association (USA), the German Israeli Research Foundation, the Ministry of Science through a grant to the Biotechnology Institute, Tel-Aviv University, and the Raymond and Beverly Sackler Research Fund of the Faculty of Exact Sciences. Supported in part by the ISF Converging Technologies program, grant no. 1714/07. The author is grateful to Prof. A. Katzir and Dr Y. Raichlin, School of Physics for supplying the planar AgX fibers, and to Prof. Gil Markovich for useful scepticism on many points.References
- G. E. Ewing, J. Phys. Chem. B, 2004, 108, 15953–15961 CrossRef CAS
.
- C. van Millenburg and J. P. van der Eerden, J. Cryst. Growth, 1993, 128, 1143–1149 CAS
.
- F. M. Etzler and J. J. Conners, Thermochim. Acta, 1991, 189, 185–192 CrossRef CAS
.
- A. Spector, A. German, L. Nagly and A. Katzir, Proc. SPIE–Int. Soc. Opt. Eng., 1999, 3849, 189–195
.
- S. Simhony, A. Katzir and E. M. Kosower, Anal. Chem., 1988, 60, 1908–1910 CrossRef CAS
.
- Y. Raichlin and A. Katzir, Appl. Spectrosc., 2008, 62, 1–18 CrossRef CAS
.
- E. M. Kosower, G. Markovich and G. Borz, J. Phys. Chem. B, 2009, 113, 5622–5632 CrossRef CAS
.
- E. M.Kosower, G. Markovich, Y. Raichlin, G. Borz and A. Katzir, J. Phys. Chem. B, 2004, 108, 12633–12636 CrossRef
.
- E. M. Kosower, G. Markovich and G. Borz, J. Phys. Chem. B, 2004, 108, 12873–12876 CrossRef CAS
.
- E. M. Kosower, G. Markovich and G. Borz, Chem Phys Chem, 2007, 8, 2506–2512 CrossRef CAS
.
- E. M. Kosower, G. Markovich and G. Borz, Chem Phys Chem, 2007, 8, 2513–2519 CrossRef CAS
.
- F. N. Keutsch, J. D. Cruzan and R. J. Saykally, Chem. Rev., 2003, 103, 2533–2577 CrossRef CAS
.
- K. Ohno, M. Okimura, N. Akai and Y. Katsumoto, Phys. Chem. Chem. Phys., 2005, 7, 3005–3014 RSC
.
- S. Hirabayashi and K. M. T. Yamada, J. Mol. Struct., 2006, 795, 78–83 CrossRef CAS
.
- K. Kuyanov-Prozument, M. Y. Choi and A. F. Vilesov, J. Chem. Phys., 2010, 132, 014304 CrossRef
.
- C. Steinbach, P. Andersson, M. Melzer, J. K. Kazimirski, U. Buck and V. Buch, Phys. Chem. Chem. Phys., 2004, 6, 3320–3324 RSC
.
- A. Engdahl and B. Nelander, J. Mol. Struct., 1989, 193, 101–109 CrossRef CAS
.
- M. Losada and S. Leutwyler, J. Chem. Phys., 2002, 117, 2003–2016 CrossRef CAS
.
- J. W. Ellis, Phys. Rev., 1931, 38, 693–698 CrossRef
.
- P. A. Giguère and K. B. Harvey, Can. J. Chem., 1956, 34, 798–808 CrossRef CAS
.
- K. Kuyanov-Prozument, M. Y. Choi and A. F. Vilesov, J. Chem. Phys., 2010, 132, 014304 CrossRef
.
- D. Kang, J. Dai, Y. Hou and J. Yuan, J. Chem. Phys., 2010, 133, 014302 CrossRef
.
- F. Yang, X. Wang, M. Yang, A. Krishtal, C. van Alsenoy, P. Delaruec and P. Senet, Phys. Chem. Chem. Phys., 2010, 12, 9239–9248 RSC
.
- K. Liu, M. G. Brown, C. Carter, C. R. J. Saykilly, J. K. Gregory and D. C. Clary, Nature, 1996, 381, 501–503 CrossRef CAS
.
- K. Liu, M. G. Brown and R. J. Saykally, J. Phys. Chem. A, 1997, 101, 8995–9010 CrossRef CAS
.
- M. D. Tissandier, S. J. Singer and J. V. Coe, J. Phys. Chem. A, 2000, 104, 752–757 CrossRef CAS
.
- G. Hincapie, N. Acelas, M. Castano, J. David and A. Restrepo, J. Phys. Chem. A, 2010, 114, 7809–7814 CrossRef CAS
.
- D. M. Bates and G. S. Tschumper, J. Phys. Chem. A, 2009, 113, 3555–3559 CrossRef CAS
.
- U. Buck, J. Phys. Chem., 1994, 98, 5190–5200 CrossRef CAS
.
- D. Laage and J. T. Hynes, Proc. Natl. Acad. Sci. U. S. A., 2007, 104, 11167–11172 CrossRef CAS
.
- G. Stirnemann and D. Laage, J. Phys. Chem. Lett., 2010, 1, 1511–1516 Search PubMed
.
- D. Laage and J. T. Hynes, J. Phys. Chem. B, 2008, 112, 14230–14242 CrossRef CAS
.
-
J. D. Eaves, J. J. Loparo, C. J. Fecko, S. T. Roberts, A. Tokmakoff and P. L. GeisslerProc. Nat'l Acad. Sci.USA, 2005, 102, pp. 13019–13022 Search PubMed
.
- R. A. Nicodemus, S. A. Corcelli, J. L. Skinner and A. Tokmakoff, J. Phys. Chem. B, 2011, 115, 5604–5616 CrossRef CAS
.
- G. N. I. Clark, C. D. Cappa, J. D. Smith, R. J. Saykally and T. Head-Gordon, Mol. Phys., 2010, 108, 1415–1433 CrossRef CAS
.
- G. N. I. Clark, G. L. Hura, J. Teixeira, A. K. Soper and T. Head-Gordon, Proc. Natl. Acad. Sci. U. S. A., 2010, 107, 14003–14007 CrossRef CAS
.
- V. Romanov, C.-K. Siu, U. H. Verkerk, H. El Aribi, A. C. Hopkinson and K. W. M. Siu, J. Phys. Chem. A, 2008, 112, 10912 CrossRef CAS
.
-
J. C. Neuefeind and J. C. Thesis, RWTH Aachen., 1994 Search PubMed
.
- J. R. Sparks, R. He, N. Healy, M. Krishnamurthi, A. C. Peacock, P. J. A. Sazio, V. Gopalan and J. V. Badding, Adv. Mater., 2011, 23, 1647–1651 CrossRef CAS
.
- B. M. Ocko, H. Hlaing, P. N. Jepsen, S. Kewalramani, A. Tkachenko, D. Pontoni, H. Reichert and M. Deutsch, Phys. Rev. Lett., 2011, 106, 137801 CrossRef CAS
.
Footnotes |
| † Electronic supplementary information (ESI) available. See DOI: 10.1039/c1ra00443c |
‡ Abbreviations: S1–S19 refer to the figures in the ESI, AgX is a mixture of AgBr and AgCl (60![[thin space (1/6-em)]](https://www.rsc.org/images/entities/char_2009.gif) : :![[thin space (1/6-em)]](https://www.rsc.org/images/entities/char_2009.gif) 40), MCT stands for the mercury-cadmium-telluride detector, 180 μm refers to the thickness of the AgX plane, FTIR-ATR = Fourier Transform Infrared-Attenuated Total internal Reflection, NMF, N-methylformamide , Sg = signal intensity. 40), MCT stands for the mercury-cadmium-telluride detector, 180 μm refers to the thickness of the AgX plane, FTIR-ATR = Fourier Transform Infrared-Attenuated Total internal Reflection, NMF, N-methylformamide , Sg = signal intensity. |
| This journal is © The Royal Society of Chemistry 2011 |

