Cation ordering within the perovskite block of a six-layer Ruddlesden-Popper oxide from layer-by-layer growth – artificial interfaces in complex unit cells†
L.
Yan
a,
H. J.
Niu
a,
Giap. V.
Duong
a,
M. R.
Suchomel
a,
J.
Bacsa
a,
P. R.
Chalker
b,
J.
Hadermann
c,
G.
van Tendeloo
c and
M. J.
Rosseinsky
*a
aDepartment of Chemistry, University of Liverpool, Liverpool, L69 7ZD, UK. E-mail: m.j.rosseinsky@liv.ac.uk
bDepartment of Engineering, University of Liverpool, Liverpool, L69 3GH, UK
cElectron Microscopy for Materials Science, University of Antwerp, Groenenborgerlaan 171, 2020, Antwerp, Belgium
First published on 5th November 2010
Abstract
The (AO)(ABO3)n Ruddlesden-Popper structure is an archetypal complex oxide consisting of two distinct structural units, an (AO) rock salt layer separating an n-octahedra thick perovskite block. Conventional high-temperature oxide synthesis methods cannot access members with n > 3, but low-temperature layer-by-layer thin film methods allow the preparation of materials with thicker perovskite blocks, exploiting high surface mobility and lattice matching with the substrate. This paper describes the growth of an n = 6 member CaO[(CSMO)2(LCMO)2 (CSMO)2] in which the six unit cell perovskite block is sub-divided into two central La0.67Ca0.33MnO3 (LCMO) and two terminal Ca0.85Sm0.15MnO3 (CSMO) layers to allow stabilization of the rock salt layer and variation of the transition metal charge.
Introduction
The controlled assembly of atoms into functional structures has been extensively developed in organic synthesis through concepts such as the functional group and retrosynthetic analysis. Synthetic solid-state chemists aiming to make extended translationally symmetric structures have successfully imposed structural control over reactivity in low-temperature intercalation reactions1,2 and within certain structural families3 but have yet to develop similarly generically powerful methodologies, due to difficulties associated with organising and rearranging large numbers of atoms, and with performing synthesis using multiphase reactions rather than within a homogeneous single solution phase. In a solid state reaction, accessing the target structure4,5 requires nucleation6 of the new phase within the matrix defined by the reagent phases while growth requires mass transport of reagent atoms through the solids to the reacting interface.7–9 The typically slow diffusion within the solid state then requires high temperatures for diffusion across the micron-sized reacting grains, which removes the chemical selectivity associated with potentially different nucleation barriers for different phases and results in the dominance of thermodynamic control in the classical synthesis of new extended solids. There is increasing focus on the synthesis of new material in thin film form10–12 both to overcome limitations of classical bulk synthesis (as is also possible in vapour transport synthesis)13 and to access materials in a form and under deposition conditions compatible with device processing.13–15 There are two approaches to overcoming the chemistry – suppressing role of diffusion in the synthesis of extended solids: reduction of the diffusion distance (as in the sol–gel, nanostructured precursor16 or precursor–compound routes to bulk materials17) by forming compositionally modulated precursor layers or fully amorphous precursors, and exploitation of the difference between bulk and surface mobility.18–20 In a system where the interfacial energies permit the deposited materials to grow in a layer-by-layer rather than a columnar/island manner, the mobility of surface atoms allows them to arrange in a manner determined by their epitaxial relationship with the surface layer on which they are growing, thereby permitting chemical bonding considerations to overcome mass transport ones and in principle allowing the growth of metastable materials driven by epitaxial structure-matching rather than by rearrangement to afford the most thermodynamically stable material. The reduced bulk mobility under the growth conditions means that the overall structure is determined by the atomic arrangement in the growing layer rather than by bulk rearrangements to afford thermodynamically stable materials. In order to exploit this difference in mobilities for the growth of complex materials, the composition and structure must be controllable during growth to permit the successive deposition of different layers — the deposition of a complete layer is monitored by reflection high energy electron diffraction (RHEED). RHEED exploits the variation in intensity of the specularly reflected beam, which reaches a turning point when the growing layer is 50% complete.21–23 There is a system-dependent distinction between thick and thin films depending on the role of epitaxial strain (local bond-length matching with the substrate) in stabilising the metastable target phase. In thick films where the strain is fully relaxed, it is solely the impact of reduced diffusion distance which allows the metastable materials to be accessed, whereas thinner (typically tens of nanometre) films also have a strain-stabilisation component.The (AO)[(ABO3)n] Ruddlesden-Popper (RP) structure (Fig. 1) is an ideal system to investigate the extent to which surface mobility-controlled growth coupled with epitaxial strain can be used to access metastable materials as it contains two distinct structural units — the rock salt AO and the perovskite ABO3, which can itself be viewed as [001] stacked square BO2 and rock-salt AO layers. The AO layer separates n units of perovskite ABO3 layers to reduce the dimensionality of the purely 3D n = ∞ ABO3 perovskite.
![The n = 6 member of the Ruddlesden-Popper (RP) (AO)[(ABO3)n] series is based on one block of rock-salt AO (CaO in this case) structure separating 6 blocks of ABO3 perovskite. The material targeted here contains two distinct units within the perovskite block, denoted as two CSMO (Ca0.85Sm0.15MnO3), two LCMO (La0.67Ca0.33MnO3) and a final two CSMO layers, distinguished by shading of the A site cations. The MnO6 octahedra are shown as polyhedra with O as red spheres. The Ca1.0, Ca0.67Sm0.33 and La0.67Ca0.33 A site cations are shown as black, blue and green spheres, respectively. Fig. 1 (a) represents intermixing of the pure Ca and Ca/Sm layers at the level of the rock salt layer and partial cation disorder within the perovskite block component of the structure to retain the high symmetry of the parent structure (space groupI4/mmm) whereas (b) represents the separate CaO, La/Ca and Ca/Sm layers in the targeted I4mm symmetry structure. The mirror plane perpendicular to the stacking direction c is lost due both to the distinction between the two rock salt layers and the internal A site ordering within the perovskite block.](/image/article/2011/SC/c0sc00482k/c0sc00482k-f1.gif) | ||
| Fig. 1 The n = 6 member of the Ruddlesden-Popper (RP) (AO)[(ABO3)n] series is based on one block of rock-salt AO (CaO in this case) structure separating 6 blocks of ABO3 perovskite. The material targeted here contains two distinct units within the perovskite block, denoted as two CSMO (Ca0.85Sm0.15MnO3), two LCMO (La0.67Ca0.33MnO3) and a final two CSMO layers, distinguished by shading of the A site cations. The MnO6 octahedra are shown as polyhedra with O as red spheres. The Ca1.0, Ca0.67Sm0.33 and La0.67Ca0.33 A site cations are shown as black, blue and green spheres, respectively. Fig. 1 (a) represents intermixing of the pure Ca and Ca/Sm layers at the level of the rock salt layer and partial cation disorder within the perovskite block component of the structure to retain the high symmetry of the parent structure (space groupI4/mmm) whereas (b) represents the separate CaO, La/Ca and Ca/Sm layers in the targeted I4mm symmetry structure. The mirror plane perpendicular to the stacking direction c is lost due both to the distinction between the two rock salt layers and the internal A site ordering within the perovskite block. | ||
c-axis24–27 and (110)28 -oriented (La,Sr)3Mn2O7 (n = 2), as well as c-axis SrnTin+1O3n + 1 (n = 1–5)29–31 thin films of known bulk RP phases have been grown previously. The A site order is artificially controlled in ref. 26 and single TiO2 layers have been inserted into an (SrO)m sequence.31 The distinction between the AO rock salt and ABO3 perovskite layers within the unit cell of the (AO)(ABO3)n sequence allows both molecular beam epitaxy (MBE) (A = Sr or Ca, B = Ti or Ru) and pulsed laser deposition (PLD) (A = Ca: B =Mn) methods to grow the inaccessible n = 4–6 members of the RP family.26,32–35 These compounds disproportionate into the n = ∞ and n = 3 members stable as the limiting phases under classical high temperature synthesis conditions used to access bulk materials. There is no barrier beyond the required reaction temperature imposed by the need for the reaction interface to move over product grain-sized distances in bulk synthesis. The success of thin film methods in accessing these metastable materials can be attributed to the high surface mobility together with the possible role of strain imposed by mismatch with the substrate.
Physical properties can be controlled by artificial A site ordering in perovskite-related structures, for example ferromagnetism can be imposed in [(SrMnO3)n/(LaMnO3)2n]m superlattices,36,37 where both SrMnO3 and LaMnO3 are antiferromagnetic with Néel temperatures of 260 and 140 K, respectively. In this paper we target the synthesis of an n = 6 RP metastable material that would be difficult to synthesise by classical ceramic methods. This is achieved by imposing a distinction between the perovskite unit cells within the perovskite block of the RP structure through the generation of distinct A cation sites within this block — the perovskite block A sites are themselves distinct in cation composition from those in the rock-salt layer. The materials targeted here are thus qualitatively distinct from the existing metastable RP films, as the layer-by-layer growth is used to impose a “mini heterostructure” within the six-layer perovskite unit, thus requiring the control of a second set of interfaces within the proposed unit cell. The aim of this work is to achieve this level of cation control in a complex oxide which would be qualitatively distinct from those accessible by ceramic-based methods e.g. even if higher nRP phases were accessed (for example, under high pressure by bulk synthesis methods), there would be very little probability that the A cation arrangement within the perovskite block would be that targeted here due to the diffusion rates required to access the structure itself. The successful realisation of this cation ordering within the perovskite block is a step towards imposing ferromagnetism on artificial RP phases based on the recently synthesised Mn4+ CaO[(CaMnO3)]n (n = 4–6) films with the RP structure,33 and thus exploit the intervening rock salt layers to induce tunnelling magnetoresistance between ferromagnetic perovskite blocks. To access ferromagnetism, the Mn valence needs to be significantly reduced from the Mn4+ parent materials (where antiferromagnetism is favoured) to close to +3.3. This requires more precise structural control than in the all-Ca Mn4+ example via the development of the “mini heterostructure” within the perovskite block, and identification of the associated deposition conditions to access this structure. The required Mn valence state of +3.3 was initially targeted in CaO[(CaMnO3)1(LaMnO3)4(CaMnO3)1]. The presence of CaMnO3 (CMO) as the terminal perovskite layer in this sequence is selected to match the CaO units in the rock-salt and perovskite layers. Subsequent changes in the nature of the perovskite components were made to access a suitably stable n = 6 RP material CaO[(Ca0.85Sm0.15MnO3)2 (La0.67Ca0.33MnO3)2(Ca0.85Sm0.15MnO3)2] with a formally reduced Mn valence state from the all-Ca systems. The superlattice approach is able to yield spatial control of multiple A cation substitution within an RP phase with distinct ordered perovskite sub-units within the perovskite block of the structure. Magnetic measurements show that ferromagnetic exchange interactions have been introduced competing with the antiferromagnetic exchange in the Mn4+ compounds, although full ferromagnetic order is not attained.
Experimental
Deposition
Pulsed laser deposition (PLD) experiments were performed with a Neocera PLD instrument with a 248 nm KrF Lambda Physik excimer laser. Growth was monitored with a double-differentially pumped STAIB high pressure RHEED system. Ceramic CaO, La0.67Ca0.33MnO3 (LCMO), Ca0.85Sm0.15MnO3 (CSMO), and SrTiO3 (STO) targets of 30 mm dimensions were prepared by sintering of pressed pellets. (001) STO single crystal substrates (CrystalTech) of dimensions 10 mm × 10 mm were used. Some of the STO substrates were ultrasonically cleaned in ethanol and acetone separately, and then etched by NH4F-HF solution for about 30 s. These etched STO substrates are then annealed at 950 °C in air for 3 h, to form a TiO2 termination with a molecular step-and-terrace surface.38–40 The STO substrate was attached to the centre of an Inconel substrate holder using silver paint. Subsequently, the holder with the substrate was fired at 120 °C for 20 min to remove the solvent. Finally, the substrate was transferred into the chamber via a load-lock. The RHEED pattern for the STO substrate surface after the above treatments in vacuum (10−7 Torr) at room temperature is shown in Figure S1(a).†A homo-epitaxial buffer layer of STO was deposited onto the substrate surface before growth of the RP structures. Approximately 20 unit cells of STO were deposited with the deposition parameters of 800 °C, O2 pressure 2.2 × 10⁻⁴ Torr, and 200 mJ/pulse and 1 Hz. The RHEED oscillations for the homo-epitaxial growth of STO on (001) STO substrate are shown in Figure S1(b)† and the RHEED pattern after the STO buffer layer is deposited is shown in Figure S1(c).† The intensity of the specular RHEED reflection oscillated smoothly with a period corresponding to one unit cell monolayer of STO. The persistence of the oscillations and the large amplitude indicated a layer-by-layer growth habit. The streaky RHEED pattern of the surface after deposition exhibited Kikuchi lines indicating a smooth surface, which provided a good starting surface for the subsequent growth.
Subsequent deposition steps are provided in detail in the Results section. After the STO and CMO or CSMO buffer layers were deposited, the substrate temperature was decreased to between 650 and 700 °C, the oxygen pressure was changed to between 8 × 10⁻⁵ and 4.9 × 10⁻⁴ Torr, and then the CaO[(CSMO)2(LCMO)2(CSMO)2] superlattice was deposited. During the processing, the laser energy and repetition rate were 180– 220 mJ/pulse and 1–2 Hz, respectively.
Characterisation
X-ray diffraction (XRD) data were collected on a Panalytical X-Pert diffractometer with an X-Celerator detector and Co Kα1 radiation. X-ray reflectivity (XRR) measurements were performed on a Philips X'Pert Powder MPD diffractometer with an Eulerian cradle and a parabolic mirror to obtain intense Cu-Kα radiation. A 1° ω scan was performed at 2θ = 1.3° to locate the specular reflection and optimise the sample position for measuring the XRR pattern. A parallel plate collimator with a narrow divergence slit was used on the incident beam side to obtain a narrow, parallel diffracted beam, with maximum intensity. The XRR pattern was measured by performing a 2θ-ω scan in the 2θ range 0.4–5°. Magnetic properties of the CSMO, LSMO and CSMO-LCMO n = 6 RP films (grown at 700 °C with oxygen pressure 4.9 × 10⁻⁴ Torr, laser energy and repetition of 180 mJ/pulse and 2 Hz), together with control samples described later, were measured using a Quantum Design MPMS SQUID magnetometer. Measurements were made in the temperature range 5–150 K with a 1 K temperature step for temperature-dependent magnetization studies, and with a field of up to 1000 Oe with 50 Oe step for hysteresis measurements. The magnetization of the film was obtained after subtracting the magnetization of the bare STO substrate measured under identical conditions.Simulations of the n = 6 RP thin film θ–2θXRD data were performed with the GSAS and EXPGUI software packages. A pseudo-Voigt profile function was used which included a peak broadening term to account for the small thickness of the film. To approximate a c-oriented epitaxial thin film, a preferred orientation model (March-Dollase) was utilized to generate intensity only for (00l) reflections.41,42
High resolution transmission electron microscopy (HRTEM) and selected area electron diffraction (SAED) have been performed on a JEOL 4000EX transmission electron microscope. High angle annular dark field scanning transmission electron microscopy images (HAADF-STEM) were recorded on a Tecnai G2. The samples for transmission electron microscopy were first polished plan-parallel until a final thickness of about 20μm (with diamond lapping film, 3μm grain size till 50μm thickness, 1μm to 30μm and 0.5μm to 20μm), then glued to a copper support and thinned by ion milling using a Baltec RES 010 ion mill (4kV, 1mA, both guns 8° on one side of the specimen, rocking angle of 30°, after an initial period of thinning both guns were put on the other side until perforation, with a final cleaning at 1kV). The specimens were nitrogen cooled during the ion milling. Any attempts to prepare the samples without nitrogen cooling, or leaving out one of the steps above, resulted in complete amorphisation of the films; using the procedure above, amorphization still occurs under a certain thickness, but parts sufficiently thin for obtaining HRTEM and HRSTEM images could be preserved.
Results
CaO layer deposition and growth of CaO[(CaMnO3)1(LaMnO3)4(CaMnO3)1] films
The deposition of the initially targeted RP structure CaO[(CaMnO3)1(LaMnO3)4(CaMnO3)1] (referred to as CaO[(CMO)1(LMO)4(CMO)1]) involves PLD growth of both the CaO and the perovskite units. CaO adopts the rock-salt structure with a lattice constant of 4.815 Å and can be grown epitaxially on MgO and GaN substrates,43,44 but the deposition conditions explored here do not permit epitaxial growth on SrTiO3 (STO) (001). (RHEED oscillations of STO and CaO layer directly deposited on (001) STO are shown in Figure S1 and S2, respectively.†) A CaMnO3 buffer layer of six unit cells thickness grown on STO does allow growth of CaO, possibly due to the presence of the CaO rock salt structure in both materials,33 so growth of the targeted RP sequence began with six CMO layers. Although the two-dimensional RHEED pattern characteristic of the [001] RP surface is maintained, the RHEED oscillations for the growth of LaMnO3 (LMO) on CMO and CMO on LMO in the CaO[(CMO)1(LMO)4(CMO)1] superlattice deposited on (001) STO substrate are not clear and regular, as shown in Fig. 2a. The sample was deposited at a substrate temperature of 700 °C with an oxygen pressure of 2.5 × 10⁻⁴ Torr and a laser energy and repetition rate of 190 mJ/pulse and 2Hz, respectively. Fig. 2b shows the X-ray diffraction (XRD) pattern of the resulting [CaO/(CMO)1/(LMO)4/(CMO)1]22 superlattice (the final subscript denotes deposition of 22 repeats of the fundamental unit) deposited on a (001) STO substrate. The main peaks in the XRD pattern arise from an n = 6 RP structure with c ≈ 50 Å. There are some impurity peaks due to the n = 5 member of the RP structure, (Fig. 2b), consistent with the difficulty of controlling the growth using the RHEED information and indicating macroscopic (and thus visible to X-ray diffraction) rather than intergrowth areas (vide infra) of this defect due to the poor growth control.![(a) RHEED oscillations for one period of the CaO[(CMO)1(LMO)4(CMO)1] superlattice during the middle of the deposition processing and (b) XRD pattern of the resulting [CaO/(CMO)1/(LMO)4/(CMO)1]22 superlattice deposited on a (001) SrTiO3 substrate. The sample is mainly n = 6 RP, with impurity n = 5 RP reflections marked.](/image/article/2011/SC/c0sc00482k/c0sc00482k-f2.gif) | ||
| Fig. 2 (a) RHEED oscillations for one period of the CaO[(CMO)1(LMO)4(CMO)1] superlattice during the middle of the deposition processing and (b) XRD pattern of the resulting [CaO/(CMO)1/(LMO)4/(CMO)1]22 superlattice deposited on a (001) SrTiO3 substrate. The sample is mainly n = 6 RP, with impurity n = 5 RP reflections marked. | ||
Use of CSMO and LCMO layers to grow the n = 6 RP sequence
To overcome this problem, alternative perovskite sub-units were sought that can be used to access the required Mn mean charge state. The ferromagnet La0.67Ca0.33MnO3 (LCMO) (Tc = 270 K) is orthorhombic (Pnma) with a mean cubic lattice constant ap of 3.856 Å.45,46 The lattice constant mismatch between LCMO and (001) STO is −1.3%, and LCMO can be epitaxially deposited on (001) STO. Ca0.85Sm0.15MnO3 (CSMO) is also ferromagnetic (Tc = 110 K, Pnma, ap = 3.763 Å).47 The lattice mismatch between CSMO and STO is −3.6% and CSMO also can be epitaxially deposited on (001) STO. The RHEED oscillations of LCMO and CSMO deposited on (001) STO, as shown in Figure S3,† demonstrate two dimensional growth for both materials, with deposition rates of 40 and 41 pulses per monolayer, respectively.Preliminary experiments to test the compatibility of rock salt CaO with these two ferromagnetic perovskite units showed that CaO grows epitaxially on CSMO but not LCMO. This is facilitated by the use of Ca-rich perovskite layers adjoining the CaO rock-salt layer in any n = 6 RP sequence. For the RP growth, the CaO layer is grown on a buffer layer of six unit cells of CSMO initially deposited on the STO substrate. The RHEED oscillations for this buffer layer deposition are shown in Fig. 3a. As the lattice constant of CSMO is different from the STO substrate, the RHEED pattern and the position of the specular spot changed slightly after the CSMO buffer layer was deposited. After adjustments of the RHEED parameters (incident angles between the electron beam and the substrate, x, y position of electron beam and reference spot position) clear and regular RHEED oscillations for CaO and then CSMO layers in the n = 6 RP sequence are obtained. Typical RHEED oscillations (one period) and the XRD pattern of a CaO[(CSMO)6] film of 28 periods/72 nm deposited on (001) STO (substrate temperature of 700 °C with an oxygen pressure of 2.3 × 10⁻⁴ Torr and laser energy of 220 mJ/pulse and repetition of 2Hz) are shown in Fig. 3b and c, respectively, revealing that the CaO[(CSMO)6] superlattice is an epitaxial n = 6 RP film as targeted. The resulting n = 6 CaO[(CSMO)6] RP films display only a paramagnetic response (see Magnetism section). Introduction of the lower Mn charge state in the LCMO block into the n = 6 RP sequence was thus undertaken to attempt to generate co-operative magnetism via the resulting ferromagnetic superexchange interactions, with the growth beginning with the six unit cell CSMO buffer layer
![RHEED oscillations of (a) 6 unit cells thick CSMO buffer layer initially deposited on the STO substrate (inset: RHEED pattern after the CSMO buffer layer was deposited) (b) one period of the CaO[(CSMO)6]n = 6 RP material deposited on a (001) STO substrate. (c) XRD pattern of the 72 nm CaO[(CSMO)6]n = 6 RP film. The impurity peaks from the STO substrate are marked with stars.](/image/article/2011/SC/c0sc00482k/c0sc00482k-f3.gif) | ||
| Fig. 3 RHEED oscillations of (a) 6 unit cells thick CSMO buffer layer initially deposited on the STO substrate (inset: RHEED pattern after the CSMO buffer layer was deposited) (b) one period of the CaO[(CSMO)6]n = 6 RP material deposited on a (001) STO substrate. (c) XRD pattern of the 72 nm CaO[(CSMO)6]n = 6 RP film. The impurity peaks from the STO substrate are marked with stars. | ||
Figure S4† describes the direct deposition of a six-layer[(CSMO)2(LCMO)2(CSMO)2] sequence on a (001) STO substrate — although this is possible, in practice the initial use of the (CSMO)6 buffer layer is more reproducible. The following describes the optimised growth procedure for a high quality n = 6 RP sample, referred to as sample A. Sample A was deposited on a (001) STO substrate treated with the etching and annealing process described in the Experimental section. The deposition oxygen pressure was 4.9 × 10⁻⁴ Torr, and the laser energy and repetition rate were 180 mJ and 2 Hz, respectively. The use of the two components within the perovskite block does allow the growth of the targeted n = 6 sequence without the macroscopic n = 5 intergrowths found in the simpler initial LMO/CMO sequence, but differences in growth protocol produce differences in film quality at a length scale shorter than that probed by X-ray diffraction.
The first period of the CaO[(CSMO)2(LCMO)2(CSMO)2] deposition process requires growth of the CaO layer on the six unit cell CSMO buffer layers deposited on STO, and is thus different from the subsequent growth periods. CaO can be easily volatilized at substrate temperatures above 800 °C. In the present experiments, the deposition temperature for CaO was optimized at 700 °C (oxygen pressure of 4.9 × 10⁻⁴ Torr, 2Hz, 180 mJ/pulse), and all subsequent deposition steps are carried out at this temperature. Fig. 4a shows the RHEED oscillations for the first CaO monolayer deposited on the top of the six CSMO unit cell-thick buffer layer – the RHEED pattern is retained, showing that, unlike the case of growth on STO, it is possible to grow a coherent CaO layer on the CSMO buffer layer. The intensity of the RHEED decreases gradually to a minimum and then increases to a maximum, which means that one monolayer of CaO has been deposited.48
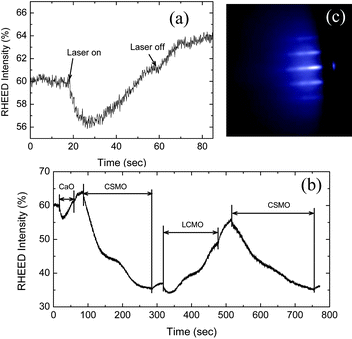 | ||
| Fig. 4 RHEED oscillations for (a) a single CaO layer deposited on the top of the six unit cell CSMO buffer layer and (b) the first period of the n = 6 RP structure-one unit cell CaO, 2 unit cells each of CSMO, LCMO, and CSMO, and (c) the RHEED pattern after this first period is deposited according to the sequence in (b) for sample A. | ||
Changes in the RHEED pattern and the position of the specular spot are particularly prevalent in the growth of this first n = 6 RP unit, which makes the interpretation of the RHEED oscillations for the first period of CaO[(CSMO)2(LCMO)2(CSMO)2] growth difficult in terms of the completion of individual atomic layers, as shown in Fig. 4b. The RHEED intensity initially decreases as the first 2 unit cells of CSMO are deposited, and then increases as two unit cells of LCMO layer are deposited, then decreases again as the second pair of CSMO layers are deposited — this point can be accurately estimated from the n = 6 CSMO growth experiments carried out previously where multiple (>2) CSMO layers are grown on CaO (Fig. 3a). After the first period of CaO[(CSMO)2(LCMO)2 (CSMO)2] was deposited, the RHEED parameters were adjusted to obtain the pattern in Fig. 4c. The deposition process for CaO[(CSMO)2(LCMO)2(CSMO)2] can then continue with clear and regular RHEED oscillations as shown in Fig. 5.
![(a) RHEED oscillations for one period of CaO[(CSMO)2(LCMO)2(CSMO)2] in the growth period following the deposition of the first n = 6 RP layer (b) RHEED oscillations for 8 periods of CaO[CSMO)2(LCMO)2(CSMO)2] of n = 6 RP film deposition for sample A.](/image/article/2011/SC/c0sc00482k/c0sc00482k-f5.gif) | ||
| Fig. 5 (a) RHEED oscillations for one period of CaO[(CSMO)2(LCMO)2(CSMO)2] in the growth period following the deposition of the first n = 6 RP layer (b) RHEED oscillations for 8 periods of CaO[CSMO)2(LCMO)2(CSMO)2] of n = 6 RP film deposition for sample A. | ||
The RHEED oscillations typically persist for 8 periods of CaO[(CSMO)2(LCMO)2 (CSMO)2] units, (Fig. 5b), before the parameters have to be readjusted as described above. This processing for CaO[(CSMO)2(LCMO)2 (CSMO)2] was repeated 32 times including the first period. The periodic length for CaO[(CSMO)2(LCMO)2 (CSMO)2] is ∼25 Å, which corresponds to half of the unit cellc-axis dimension for the body-centred n = 6 RP structure (Fig. 1). The thickness of the sample with 32 periods of CaO[(CSMO)2(LCMO)2 (CSMO)2] including the CSMO buffer layer, is 82 ± 1 nm, which agrees well with the XRR results reported later.
RHEED and XRD data reveal (Figures S5–S7 and associated discussion in SI†,‡) that n = 6 RP films with the correct structure can only be deposited for substrate temperatures in the narrow window from 675 to 700 °C. This may be associated with the lack of surface mobility for the required reconstruction below this temperature range and the problems with controlling CaO volatility above it. The X-ray data in Figure S7† show that 4.9 × 10⁻⁴ Torr is the optimal growth pressure.
Structural characterisation of inter-grown and pure n = 6 films
The major features which need to be controlled and optimized during the growth are shown in terms of two films, one of which (sample B) contains more RP intergrowth defects with different n values than the film deposited according to the optimised deposition process described above for sample A. Sample B was deposited on the as-received commercial single crystal (001) STO. The deposition oxygen pressure for sample B was 2.1 × 10⁻⁴ Torr and the laser energy and repetition rate are 200 mJ/pulse and 2 Hz, respectively. The relatively small differences between the RHEED traces of samples A and B produced marked differences in the X-ray intensities and the TEM images, particularly, as explained below, in the periodicities determined from either the Fast Fourier Transform (FFT) analysis of the images or from the ED patterns. These show that the material is subject to intergrowth of n = 5 members unless extreme precision is exerted in the switching between the targets defining layer deposition.During the deposition processing of sample B, the RHEED oscillations for the first five periods of the CaO[(CSMO)2(LCMO)2(CSMO)2] sequence were not clear and regular (Figure S8†), but the subsequent layers gave satisfactory RHEED data (Fig. 6a). The XRD data from sample B (Fig. 6b) can be indexed to an n = 6 RP structure with repeat ∼50 Å without the macroscopic n = 5 inclusions seen in the CMO/LMO/CMO superlattice. Sample B was deposited for 31 periods leading to a thickness of 80 nm. During the deposition process of sample A, the RHEED oscillations except the first period (as shown in Fig. 4b) were clear and regular as shown in Fig. 5a. The optimised growth sequence is set out in Figure S9.†
![(a) RHEED oscillations for two periods of CaO[(CSMO)2(LCMO)2 (CSMO)2] in the deposition of sample B. (b) XRD patterns of samples B (the upper trace) and A (the lower trace). The impurity peaks from the (001) STO substrate are marked with arrows.](/image/article/2011/SC/c0sc00482k/c0sc00482k-f6.gif) | ||
| Fig. 6 (a) RHEED oscillations for two periods of CaO[(CSMO)2(LCMO)2 (CSMO)2] in the deposition of sample B. (b) XRD patterns of samples B (the upper trace) and A (the lower trace). The impurity peaks from the (001) STO substrate are marked with arrows. | ||
All (00l) peaks corresponding to an n = 6 RP structure with lattice constant 50.0 Å, for even l values from (002) to (0032), can be observed and successfully indexed in the XRD measurement from sample A – the higher intensities in comparison with sample B indicate the higher quality of sample A obtained using the optimized deposition conditions.
Fig. 7 shows a HRTEM image of sample A, together with an ED pattern of sample A. On the ED pattern the reflections corresponding to an n = 6 RP can be observed with reflection condition 0kl:k + l = 2n. This reflection condition points towards an I-centered unit cell, consistent with the absences seen in the X-ray diffraction experiments discussed above. The average thickness of one period of CaO[(CSMO)2(LCMO)2 (CSMO)2] can be calculated from the ED pattern as being 25.0(3) Å, thus giving a unit cell of 50.0(6) Å. For this calculation the reflections from STO present in the SAED pattern have been used as an internal standard. Fig. 8 shows a HRTEM image of sample B, with at first sight no noticeable difference from that of sample A, however, from sample B any ED pattern taken showed only the STO reflections. The reason for this can be understood when taking a close look at the FFT patterns taken from the film (Fig. 8b and enlargement in Fig. 8c, taken from an area of approximately 100 Å × 170 Å): the stacking in sample B is not ideally periodic. On the enlargement one can see that the superstructure reflections originating from the 000 reflection do not overlap with those originating from the 002 reflection. Such features are consistent with the presence of n = 5 RP intergrowths within the n = 6 matrix (as shown in Fig. 8d). The amount of n = 5 RP present can be evaluated using the formula adapted from ref. 49

![(a) HRTEM image (inset shows the simulated image) and (b) electron diffraction patterns of sample A of the n = 6 RP sequence CaO[(CSMO)2(LCMO)2 (CSMO)2].](/image/article/2011/SC/c0sc00482k/c0sc00482k-f7.gif) | ||
| Fig. 7 (a) HRTEM image (inset shows the simulated image) and (b) electron diffraction patterns of sample A of the n = 6 RP sequence CaO[(CSMO)2(LCMO)2 (CSMO)2]. | ||
![Transmission electron microscopy characterisation of sample B of the n = 6 RP sequence CaO[(CSMO)2(LCMO)2 (CSMO)2] (a) HRTEM (simulation is shown as an inset), (b) Fourier transform, (c) enlargement of the central row of the Fourier Transform and (d) n = 5 defects within the n = 6 RP matrix.](/image/article/2011/SC/c0sc00482k/c0sc00482k-f8.gif) | ||
| Fig. 8 Transmission electron microscopy characterisation of sample B of the n = 6 RP sequence CaO[(CSMO)2(LCMO)2 (CSMO)2] (a) HRTEM (simulation is shown as an inset), (b) Fourier transform, (c) enlargement of the central row of the Fourier Transform and (d) n = 5 defects within the n = 6 RP matrix. | ||
Thus, while in B the incommensurability shows the presence of n = 5 RP intergrowths, the optimised deposition conditions used for sample A give a commensurate set of n = 6 RP interlayer diffraction features. However, the faulting defined by perpendicular contrast features in the HRTEM images, also observed as diffuse streaks along the b-axis on the FFT and ED patterns, appear in all of the samples studied. This may be intrinsic to the relief of strain within the metastable films, i.e. control of the deposition does not appear to allow avoidance of these defects, as opposed to the parallel intergrowth defects, and may also be assignable in part to the effect of surface steps in the substrate at the temperatures used for growth.
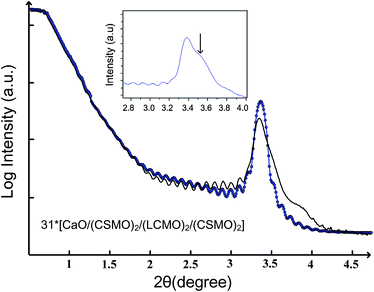
Analysis of the entire deposited volume of the thin films is best undertaken with XRD, described here for the optimised sample A. The observed peak intensities are sensitive to the crystallographic details of the film. This was revealed by comparing the experimental XRD data with simulated film diffraction patterns based upon idealised n = 6 RP films modelled with both I4/mmm symmetry (as shown in Fig. 1a) and I4mm symmetry (Fig. 1b). In the I4/mmm model, symmetry constraints do not permit a distinction between the CaO and (Ca/Sm)O layers in the CSMO perovskite unit above it. This is in contrast to an I4mm model, in which the mirror plane symmetry element along the film growth direction (c-axis) is removed and the construction of a separate CaO layer distinct from the neighbouring (Ca/Sm)O layers is now permitted. The I4/mmm structural model was based on an ideal n = 6 RP construction, while the I4mm structural model was based on the 26 layer chemical stacking sequence targeted during deposition. In both models the fractional atomic positions were equally spaced along the c direction of the tetragonal cell. The same lattice parameters were used in both models. The out of plane c lattice parameter (c = 50.0 Å) was chosen to match the experimentally determined value; while a typical RP lattice constant (a = 3.8 Å) was used for the in-plane value. Simulated epitaxial thin film diffraction patterns for the modelled n = 6 RP structures were generated as described in the Experimental section. We note that the in-plane lattice value does not affect a simulated pattern exhibiting only (00l) peaks. The simulated film diffraction data were manually combined with experimental data from a blank STO substrate scan to generate a final simulated pattern of an n = 6 RP film deposited on an STO substrate. A final simulated pattern obtained for the I4mm symmetry model showing good agreement with experimental data is shown in Fig. 9.
![Comparison of experimental and simulated θ–2θX-ray diffraction scans for sample A of CaO[(CSMO)2(LCMO)2 (CSMO)2]. Top scan (black line) shows collected experimental pattern, lower scan shows a simulated pattern (red line) from the I4mm structural model superimposed on a blank STO substrate scan (green line). Peak indices for the n = 6 RP film and the STO substrate are labelled, while blue arrows mark additional peaks due to STO substrate defects.](/image/article/2011/SC/c0sc00482k/c0sc00482k-f9.gif) | ||
| Fig. 9 Comparison of experimental and simulated θ–2θX-ray diffraction scans for sample A of CaO[(CSMO)2(LCMO)2 (CSMO)2]. Top scan (black line) shows collected experimental pattern, lower scan shows a simulated pattern (red line) from the I4mm structural model superimposed on a blank STO substrate scan (green line). Peak indices for the n = 6 RP film and the STO substrate are labelled, while blue arrows mark additional peaks due to STO substrate defects. | ||
The observed (00l) intensities are sensitive to the details of the A cation distribution. In particular, the (004), (0022) and (0030) peaks are absent in the I4/mmm model but observed in the I4mm model. The intensity mismatch between the (004) observed and I4mm calculated model suggests that the actual structure consists of both structures shown in Fig. 1, but with the interdiffusion of Ca and Ca/Sm impeded by the layer-by-layer growth process — the interface between the CaO and Ca0.85Sm0.15O layers occurs at the interface between the CaO rock salt and CSMO perovskite blocks. These intensity trends are found in all high-quality n = 6 RP films measured. The diffraction peak intensities were also found to be very sensitive to small variations in the relative thicknesses of the distinct chemical layers in the tetragonal unit cell. While it was not possible to refine this idealized I4mm structural model against the collected data, it is noted that intra-layer film strain, chemical interdiffusion, and structural defects can easily account for the minor (00l) peak intensity mismatches between the experimental n = 6 RP diffraction scans and those simulated on the basis of the pure ordered I4mm structural model. In general, the agreement between peak position and intensities is quite good, thus demonstrating the success of the controlled step-wise growth of the n = 6 RP structure with internal interfaces within the perovskite block
The image simulations in the HRTEM images of both sample A (Fig. 7a) and B (Fig. 8a) are in agreement with the alternation of A site cations according to the RHEED-monitored deposition sequence and the XRD intensity matching, but the difference in contrast between the different projected A cation columns is very low. In order to confirm the alternation of the A site cations within the perovskite block, HAADF-STEM images were recorded as shown in Fig. 10a and b. Such images show a contrast related to Zn, where Z is the average atomic number of the projected atomic column. The average Z of the different projected columns is La0.67Ca0.33 45, Ca0.85Sm0.15 26, Ca 20 and Mn–O 17. Therefore, all columns will have a comparable brightness, except the La0.67Ca0.33 columns, which should be brighter on the HAADF-STEM images. Fig. 10 b shows an overview HAADF-STEM image over the total thickness of the film, while Fig. 10a shows an enlargement of the area indicated on Fig. 10b. On the enlarged figure, it is clear that the brightness varies along the c-axis with a periodicity of ∼25 Å, corresponding to the occurrence of the La0.67Ca0.33 columns every 25 Å. On the overview image the total amount of layers is 32, including the buffer CSMO layer, and the last layer, which does not show up clearly on the overview, but is present on the enlarged image. On the profile plot in Fig. 10c, this last layer is only seen as a tail; all other layers give well-defined peaks due to the alternation of the La0.67Ca0.33 with the Ca0.85Sm0.15 and Ca layers. When considering the film thickness to start at the point of occurrence of brightness at the left, up to the plateau corresponding to STO on the right, the thickness derived from the HAADF-STEM image is approximately 83.5 Å.
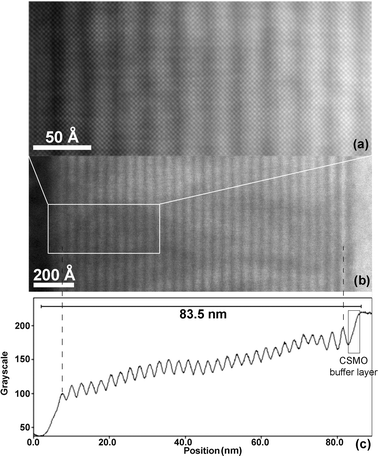 | ||
| Fig. 10 Z-contrast STEM image of sample A (a) enlarged section of overall image (b) showing the Z contrast present in the profile plot (c) due to the alternating contrast between the La0.67Ca0.33 and the Ca0.85Sm0.15 and Ca (rock salt) layers in the perovskite (La0.67Ca0.33, Ca0.85Sm0.15) and pure rock salt (Ca) parts of the n = 6 RP structure. | ||
In combination with the HRTEM images and the XRD simulation, this demonstrates that the targeted A cation alternation has been achieved within the six perovskite units of the RP structure.
The XRR curve for sample A in Fig. 11 shows Kiessig interference fringes corresponding to the complex multilayer. The low angle peak arises from interference by blocks of material with differing densities and these need not be crystalline. The reflection is a superposition of the (002) Bragg peak and the reflection (order 1) observed from the reflectrometry effect, as shown as the inset of Fig. 11. The average thickness of the film could be measured directly from the profile, by measuring the distance between neighbouring fringes. Fourteen well defined peaks were selected for this analysis; the mean value obtained was 83 nm (±2 nm). The calculation used is based on path-length calculations of interference in thin films.50–53 A similar value (81 ± 2 nm) for the thickness was obtained from the Fast Fourier Transform (FFT) of the data.54 The data were fit using the segmented fit algorithm. The XRR curve was best modelled using the sequence n* CaO[(CSMO)2(LCMO)2(CSMO)2] commensurate with the SrTiO3 substrate, with n = 32 (the number of periods) derived from the fit. In the preliminary analysis, layer thicknesses and densities were derived from crystal structures of the bulk materials. The layer thicknesses, roughness and densities were then varied independently to improve the fit. Estimating diffusion between layers and surface roughness is problematic since there is correlation between the roughness and density parameters, and it is impossible to distinguish between a rough or an interdiffused interface. The fitted parameters of the film are summarised in Table 1 and the fitted (in blue circles) and experimental (in black) curve shown in Fig. 11.The structural data (thicknesses and densities) are in good agreement with the targeted deposition. The model was significantly improved by allowing for an additional rough surface oxide layer, about 11 Å thick and about 50% of the density of the multilayer density.
 | ||
| Fig. 11 The fitted (blue circles) and measured (black line) X-ray reflectivity curves of sample A. The insert is the enlarged of the experimental XRR 2θ range from 2.8 to 4° and the (002) Bragg peak is marked with an arrow. | ||
| Layer | Layer Description | Thickness/Å | Density/g cm−3 | Roughness/Å |
|---|---|---|---|---|
| 1, 0 | Ca.85Sm.15MnO3 | 23.5 (±1.0) | 5.0 (±0.5) | 7 (±1) |
| 2 | Superlattice, Number of repeats = 32 | |||
| 2, 0 | CaO | 2.9 (±0.5) | 3.3 (±1) | 4 (±1) |
| 2, 1 | Ca.85Sm.15MnO3 | 7.5 (±0.5) | 4.8 (±1) | 4 (±1) |
| 2, 2 | La0.67Ca0.33MnO3 | 7.7 (±0.5) | 5.7 (±1) | 4 (±1) |
| 2, 3 | Ca.85Sm.15MnO3 | 7.5 (±0.4) | 4.8 (±1) | 6 (±2) |
| 3, 0 | Cap | 11.0 (±2) | 2.8 (±1) | 9 (±2) |
Magnetization measurements
The magnetization of a pure n = 6 RP CaO[(CSMO)2(LCMO)2 (CSMO)2]31 film grown under the conditions described for sample A was obtained after subtracting the magnetization of the STO bare substrate as the background signal. The temperature dependence of the magnetization and hysteresis loops at 5 and 150 K of the (001) STO single crystal substrate are shown in Figures S10–S12.† To ensure adventitious ferromagnetic impurities have not been incorporated during sample growth and handling, hysteresis loops from the n = 6 RP films were measured at 300 and 150 K. The results shows that no magnetic impurities are present in the n = 6 RP film as the M(H) signals at these temperatures are identical to those from the STO substrate (Figure S13).Fig. 12a shows the zero field cooled (ZFC) and field cooled (FC) M(H) isotherms of the CaO[(CSMO)2(LCMO)2 (CSMO)2]31n = 6 RP film. A clear hysteretic behaviour is observed in both cases. However, the M(H) FC loop was shifted along the magnetization (M) axis whilst the M(H) ZFC loop is a typical ferromagnetic one with HC = 80 Oe. At 5 K and 1000 Oe, the magnetization of the film is 0.087 and 0.066 μB/Mn site for the FC and ZFC cases, respectively. The temperature dependence of the magnetization, M(T), under FC and ZFC protocols in a measuring field of 500 Oe is shown in Fig. 12b. A clear transition from the paramagnetic state occurs at TC = 63 K in both M(T) FC and ZFC curves. However, the ZFC M(T) shows a broad maximum at TB = 23 K. This maximum, together with the shift of M(H) FC loop along the M axis suggests a spin glass-like behaviour of the film with the divergence of FC and ZFC at 63 K corresponding to cluster blocking and the ZFC maximum to cluster freezing.
![(a) M(H) loops of the CaO[(CSMO)2(LCMO)2 (CSMO)2]31n = 6 RP film under FC and ZFC conditions (5 K). (b) Temperature dependence of magnetization of the 31 period CaO[(CSMO)2(LCMO)2 (CSMO)2]31n = 6 RP film under FC and ZFC conditions.](/image/article/2011/SC/c0sc00482k/c0sc00482k-f12.gif) | ||
| Fig. 12 (a) M(H) loops of the CaO[(CSMO)2(LCMO)2 (CSMO)2]31n = 6 RP film under FC and ZFC conditions (5 K). (b) Temperature dependence of magnetization of the 31 period CaO[(CSMO)2(LCMO)2 (CSMO)2]31n = 6 RP film under FC and ZFC conditions. | ||
To determine the contribution of the CSMO and LCMO layers to the magnetism of the film, measurements on single component pure perovskite CSMO and LCMO films with similar thicknesses and prepared under similar conditions (on etched substrates as for sample A) were performed. The results revealed that the LCMO film shows a similar shift of the M(H) FC loop along the M axis and a clear maximum at 44 K in the M(T) ZFC curve, as shown in Figure S14 and S15,† respectively. The TC of the pure perovskite LCMO film is about 110 K and the magnetisation is 0.093 and 0.051 μB/Mn at 1000 Oe for the FC and ZFC protocol, respectively. The magnetization of the pure CSMO film is unmeasureable as it does not undergo a transition to a magnetically ordered state.
Discussion
The aim of this work is to lower the Mn oxidation state from +4 found in the single component CaO[(CMO)n]n = 4–6 RP superlattices previously reported to access charge states associated with ferromagnetic order. This is found to require careful selection of the nature and sequence of the perovskite units, and their matching with the CaO rocksalt layer.The rock salt CaO layer could not be grown directly on STO under the conditions investigated. This is assigned to the bond length mismatch between Ca–O (2.408 Å) in CaO and Sr–O (2.761 Å) in STO of −12.8%. CaO can be epitaxially grown on CaMnO3, although the lattice mismatch between CaO and CaMnO3 is −8.7% which is still large in conventional epitaxy considerations, suggesting that more specific local chemical bonding considerations beyond simple size differences between Ca and Sr need to be considered.55 The initial target CaO[(CaMnO3)1(LaMnO3)4(CaMnO3)1] has the desired Mn valence state but does not grow as the pure n = 6 RP structure—having deposited the rock salt layer of the target superstructure, it is not possible to grow the perovskite block coherently under the conditions studied here, probably because the lattice mismatch between the two components LaMnO3 (LMO, ap = 3.94 Å) and CaMnO3 (CMO, ap = 3.73 Å) of 5.6% 56 is sufficient to produce the introduction of macroscopic n = 5 intergrowths (Fig. 2(b)). These n = 5 regions are of sufficient extent to contribute to X-ray diffraction rather than being observed as intergrowth defects in TEM, found later for the less spatially extensive intergrowth defects in the CSMO/LCMO n = 6 RP films (Fig. 8(d)), and prevent the observation of clear RHEED oscillations during the sequence growth. This may be assigned to a local mismatch between the LaO and CaO rock-salt layers either side of the MnO2 layer on which growth takes place. The growth of the n = 6 sequence was therefore pursued by focussing more closely on the two interfaces required within the targeted artificial unit celli.e. the perovskite–perovskite and perovskite–rock salt unit cells by using better-matched perovskite units than LMO and CMO. Other sequences with reduced Mn charge states were therefore investigated, beginning with the reduced Ca0.85Sm0.15MnO3 (CSMO) as the perovskite unit.
The CaO/(CSMO)6 sequence can be grown in the n = 6 RP structure without the macroscopic n ≠ 6 intergrowths found with LMO and CMO. The successful growth in this case may be associated with the predominance of Ca in the A sites in perovskite and rock salt layers which avoids the defect introduction assigned here to bond length matching problems in the LMO/CMO superlattice. However, CaO/(CSMO)6 shows no magnetic ordering with evidence of ferromagnetic exchange despite being reduced from Mn4+ and containing perovskite units which are ferromagnetic in the bulk. This can be ascribed to the growth conditions producing oxygen vacancies which disrupt the Mn–O–Mn magnetic exchange pathways, as even the pure perovskite CSMO films are insufficiently oxidised to display the ferromagnetic behaviour seen in the bulk under the low oxygen partial pressure required in the growth chamber used here for the layer-by-layer deposition to access the RP sequences. This therefore required the introduction of LCMO units into the perovskite blocks to access cooperative magnetism with a ferromagnetic component by further decreasing the Mn charge state from that accessible in the pure CSMO RP structures. The ferromagnetic La0.67Ca0.33MnO3 (LCMO) perovskite itself does not grow epitaxially with the rock salt CaO component of the target RP structure. This observation is consistent with the mismatch between LMO and CMO seen in the initially targeted sequence due to an La/Ca size mismatch, which in this case is between the perovskite and rock salt layers. This requires a multicomponent approach, involving perovskite units that will both grow with CaO and adjust the overall Mn charge state into the correct range. Control of the A site order between rock-salt and perovskite layers in the n = 2 RP phase SrO(La0.6Sr0.4MnO3)2 has been demonstrated.48
The lattice constant mismatch between LCMO and CSMO is 2.4%, smaller than that of LMO with CMO, suggesting the use of these units to grow a six-layer RP structure. The mismatch between the rock salt CaO layer and the La-rich LCMO which is used to explain the absence of epitaxial LCMO growth on CaO under the conditions used here leads to selection of the Ca-rich CSMO units to flank the six perovskite blocks in the artificial RP superstructure (CSMO)2(LCMO)2(CSMO)2 sequence, with the La-rich LCMO units in the centre of the perovskite block. This allows the CaO rock salt layer to grow epitaxially on the CaO-rich terminal perovskite and thus gives access to the multicomponent n = 6 RP sequence with a “mini heterostructure” in the perovskite block, separated by the rock salt layers. The resulting sequence has a Mn mean valence of +3.67, which is not as low as is needed for ferromagnetism (Mn mean valence < +3.5) but introduces enough Mn3+ species to modify the magnetism of the initial pure Mn4+ materials and introduce a magnetic response with a signature of ferromagnetic exchange. The introduction of a better lattice match within the six unit-cell perovskite block between the two distinct CSMO and LCMO sub-units produces a better control of the deposition process and allows assembly of the target n = 6 RP structure.
There is only a very narrow growth window of temperature and oxygen partial pressure for the materials in this n = 6 RP structure with alternation within the six unit perovskite block in the chamber used for the current experiments. The route map of the deposition process is graphically represented in Figure S9.† The RHEED oscillations indicate that the “mini heterostructure” with the three distinct A sites is formed within these narrow parameter windows and this is supported by the XRD and HRTEM/FFT analysis. In particular the Z-contrast STEM (Fig. 10) shows the alternation between La/Ca and Ca/Sm within the perovskite block, while the XRD is consistent with preservation of the separation between the Ca and Ca/Sm bounding rock salt layers in the perovskite and rock salt layer components. The X-ray data analysis indicates that some interdiffusion occurs between the flanking CaO and (Ca/Sm)O layers in the rock salt and terminal perovskite blocks. The FFT of the HRTEM images is particularly helpful in assessing the extent of intergrowth of other order RP phases (as shown for sample B where the poor quality of the initial five layers of the growth leads to intergrowth of n = 5 RP units on the TEM length scale despite high quality subsequent growth and only n = 6 RP reflections being observed in the XRD) and indicates that when the RHEED is controlled sufficiently precisely it is possible to attain the desired c-axis repeat free of other values of n. However, the diffuse streaks perpendicular to c* show that disorder perpendicular to the layer stacking, assigned to the insertion of rock salt layers perpendicular to the desired direction as seen in images of defective RP bulk and film materials,55,57 is not relieved by more precise control of the growth. This suggests that this is a general mechanism for relief of strain in the films. The HRTEM images thus show that in sample A precise control of the layer deposition without intergrowth of other n members of the RP series has been achieved. This is consistent with the observation of a commensurate electron diffraction pattern from the entire thickness of the film without interlayer streaking, suggesting highly faithful reproduction of the RP sequence, but also with the perpendicular defects not apparent directly in the RHEED but perhaps responsible for the gradual reduction of RHEED intensity as the film grows. The achieved control of cation order within the perovskite block of an RP structure requires control of both perovskite–perovskite and perovskite–rock salt structural interfaces to be achieved.
The growth window restrictions have a particular impact on the magnetic film properties. In particular the oxygen partial pressure used is much lower than that ideally suited to optimising the magnetic properties. For magnetic thin films, a decrease in Curie temperature TC and saturation magnetization MS is always observed for ferromagnetic perovskites compared with bulk materials. The reason is the effect of oxygen deficiency and film thickness,58,59 confirmed here by the absence of ferromagnetism in the 3D perovskite CSMO films grown under the same conditions as the n = 6 RP films, and the reduced Tc and magnetisation in LCMO pure perovskite films, also grown under the same conditions. In the case of the CSMO-LCMO n = 6 RP structure with the “mini heterostructure” mixed perovskite units, the magnetism can be interpreted as spin glass-like rather than ferromagnetic — the blocking temperature of the clusters of spins is 63 K with a lower freezing temperature of 23 K. The combination of the two different perovskite blocks within the n = 6 RP sequence to access the reduced Mn oxidation state produces competing interactions between the CSMO and LCMO layers, which can be thought of as predominantly antiferromagnetic (Mn4+-rich CSMO) and ferromagnetic (Mn3+-rich LCMO) respectively. This couples with the weakened ferromagnetic coupling and structural disorder due to the oxygen vacancies arising from the low oxygen pressure during growth to produce glass-like magnetism shown by the shift of the M(H) FC loop along the M axis and the maximum in the M(T) ZFC curve.
The low magnetization values reflect the processing requirement for low oxygen pressures and the restrictions on the target Mn charge state enforced by the layer matching conditions discussed above. However the absence of magnetism in the pure perovskite CSMO and CSMO n = 6 RP films clearly shows that the shift to lower Mn valence by the introduction of the LCMO component does change the magnetic behaviour by producing spin-glass-like behaviour similar to that found for the pure perovskite LCMO under the same growth conditions but with a lower freezing temperature. This is the goal of growing the mini-superlattice with internal structure within the n = 6 RP block. Under the processing conditions used, the CSMO component displays no cooperative magnetism with a ferromagnetic component either as a perovskite film or an n = 6 RP film. The reduction of the Mn charge state by introduction of the LCMO component into the initial pure CSMO n = 6 RP is enough to introduce sufficient competing ferromagnetic interactions to give the glass-like behaviour. More detailed comment would require precise definition of the film oxygen content — efforts to anneal the samples lead to decomposition post-synthesis and so post-synthetic control of the oxygen content is not investigable directly. The comparison with the n = 6 pure CSMO RP does show the influence of the LCMO layers on the magnetism of the RP films by imposing glassy magnetism via the extra Mn3+ centres introduced and the resulting ferromagnetic exchange interactions competing with the antiferromagnetic Mn4+-Mn4+ exchange. The absence of ferromagnetism can be assigned to the Mn oxidation state remaining above +3.5 and the growth conditions required to access the RP structure producing oxygen vacancies. The higher TC of the LCMO film is attributed to the better coupling of moments in LCMO layer due to the absence of non-magnetic intervening CaO blocks and the resulting 3D superexchange network.
Conclusion
RHEED-monitored PLD growth allows the growth of an n = 6 RP material with artificially imposed cation order within the perovskite blocks, permitting control of the Mn valence. Initial experiments indicated that the size and symmetry of the component perovskite blocks in the n = 6 RP structure needed to be adjusted to produce a coherent growth process to form the targeted metastable phase. This was modified to match the bond lengths between the rock salt and terminal perovskite layers and also between the perovskite units themselves, with the idea that these changes would facilitate the growth of the complex n = 6 RP target structure seen here — other, more complex factors may also be at work in producing the changes observed. Consequent adjustment of the initially identified Mn charge state generated spin glass-like freezing rather than ferromagnetic order, but allowed the ordered deposition of four separate cations over three distinct sites to access a new crystalline compound where there are two distinct structural interfaces within the perovskite unit cell. This shows that materials that are not accessible by ceramic routes can be grown using multiple target PLD where the compositional complexity (e.g. presence of both La and Ca on the A sites in different sub-units of the structure) is partially present in the single phase compounds used as the targets in the growth runs. The accessed RP structures exploit both the stabilisation of the higher n perovskite blocks possible through the surface mobility and epitaxial strain in thin films and the kinetic control of the alternation of structural units to generate cation ordering inaccessible in bulk synthesis of oxides of similar compositional complexity, demonstrated by the “mini heterostructure” within the six unit cell perovskite block which matches the current focus on enhancing capabilities for the targeted synthesis of complex solids.Acknowledgements
We thank the UK EPSRC for support under EP/H000925/1 and EP/C511794.Notes and references
- J. Rouxel and M. Tournoux, Solid State Ionics, 1996, 84, 141 CrossRef CAS.
- M. S. Whittingham and A. J. Jacobson, Intercalation Chemistry, Academic Press, New York, 1984 Search PubMed.
- J. D. Corbett, Inorg. Chem., 2000, 39, 5178 CrossRef CAS.
- M. Jansen, Angew. Chem., Int. Ed., 2002, 41, 3746 CrossRef CAS.
- M. G. Kanazidis, Acc. Chem. Res., 2005, 38, 361.
- C. R. A. Catlow, D. S. Coombes and J. C. G. Pereira, Chem. Mater., 1998, 10, 3249 CrossRef CAS.
- J. W. Christian, The Theory of Transformations in Metals and Alloys, Pergamon Press, Oxford, UK, Vol. 1, 2002 Search PubMed.
- A. Stein, S. W. Keller and T. E. Mallouk, Science, 1993, 259, 1558 CrossRef CAS.
- E. E. Finney and R. G. Finke, Chem. Mater., 2009, 21, 4692 CrossRef CAS.
- Y. Liebold-Ribeiro, D. Fischer and M. Jansen, Angew. Chem., Int. Ed., 2008, 47, 4428 CrossRef CAS.
- L. Fister and D. C. Johnson, J. Am. Chem. Soc., 1992, 114, 4639 CrossRef CAS.
- C. Chiritescu, D. G. Cahill, C. Heideman, Q. Lin, C. Mortensen, N. T. Nguyen, D. Johnson, R. Rostek and H. Böttner, J. Appl. Phys., 2008, 104, 033533 CrossRef.
- R. Gruehn and H. J. Schweizer, Angew. Chem., Int. Ed. Engl., 1983, 22, 82 CrossRef.
- I. Bozovic and J. N. Eckstein, Appl. Surf. Sci., 1997, 113–114, 189 CrossRef.
- J. Mannhart, D. H. A. Blank, H. Y. Hwang, A. J. Millis and J.-M. Triscone, MRS Bulletin, 2008, 33, 1027 CAS.
- H. Gleiter, Prog. Mater. Sci., 1989, 33, 223 CrossRef CAS.
- J. Gopalakrishnan, N. S. P. Bhuvanesh and K. K. Rangan, Curr. Opin. Solid State Mater. Sci., 1996, 1, 285 CrossRef CAS.
- K. Ueda, H. Tabata and T. Kawai, Phys. Rev., 1999, B 60, R12564.
- G. J. H. M. Rijnders, G. Koster, D. H. A. Blank and H. Rogalla, Appl. Phys. Lett., 1997, 70, 1888 CrossRef CAS.
- D. G. Schlom, L.-Q. Chen, X. Pan, A. Schmehl and M. A. Zurbuchen, J. Am. Ceram. Soc., 2008, 91, 2429 CrossRef CAS.
- J. J. Harris and B. A. Joyce, Surf. Sci., 1981, 103, L90 CrossRef CAS.
- T. Terashima, Y. Bando, K. Iijima, K. Yamamoto, K. Hirata, K. Hayashi, K. Kamigaki and H. Terauchi, Phys. Rev. Lett., 1990, 65, 2684 CrossRef CAS.
- M. Kanai, T. Kawai and S. Kawai, Appl. Phys. Lett., 1991, 58, 771 CrossRef CAS.
- Y. Konishi, T. Kimura, M. Izumi, M. Kawasaki and Y. Tokura, Appl. Phys. Lett., 1998, 73, 3004 CrossRef CAS.
- L.-M. Cha, P.-X. Zhang and H.-U. Habermeier, Phys. B, 2003, 327, 163 CrossRef CAS.
- H. Tanaka and T. Kawai, Appl. Phys. Lett., 2000, 76, 3618 CrossRef CAS.
- M. Lmouchter, R. Tatsumi, T. Ikawa and M. Suzuki, Jpn. J. Appl. Phys., 2008, 47, 908 CrossRef CAS.
- Y. Takamura, R. V. Chopdekar, J. K. Grepstad, Y. Suzuki, A. F. Marshall, A. Vailionis, H. Zheng and J. F. Mitchell, J. Appl. Phys., 2006, 99, 08S902 CrossRef.
- M. Okude, A. Ohtomo, T. Kita and M. Kawasaki, Appl. Phys. Express, 2008, 1, 081201 Search PubMed.
- N. D. Orloff, W. Tian, C. J. Fennie, C. H. Lee, D. Gu, J. Mateu, X. X. Xi, K. M. Rabe, D. G. Schlom, I. Takeuchi and J. C. Booth, Appl. Phys. Lett., 2009, 94, 042908 CrossRef.
- P. Fisher, S. Wang, M. Skowronski, P. A. Salvador, M. Snyder and O. Maksimov, Appl. Phys. Lett., 2007, 91, 252901 CrossRef.
- J. H. Haeni, C. D. Theis, D. G. Schlom, W. Tian, X. Q. Pan, H. Chang, I. Takeuchi and X.-D. Xiang, Appl. Phys. Lett., 2001, 78, 3292 CrossRef CAS.
- L. Yan, H. J. Niu, C. A. Bridges, P. A. Marshall, J. Hadermann, G.v. Tendeloo, P. R. Chalker and M. J. Rosseinsky, Angew. Chem., Int. Ed., 2007, 46, 4539 CrossRef CAS.
- Y. Iwazaki, T. Suzuki, S. Sekiguchi and M. Fujimoto, Jpn. J. Appl. Phys., 1999, 38, L1443 CrossRef.
- W. Tian, J. H. Haeni, D. G. Schlom, E. Hutchinson, B. L. Sheu, M. M. Rosario, P. Schiffer, Y. Liu and M. A. Zurbuchen, Appl. Phys. Lett., 2007, 90, 022507 CrossRef.
- C. Adamo, X. Ke, P. Schiffer, A. Soukiassian, M. Warusawithana, L. Maritato and D. G. Schlom, Appl. Phys. Lett., 2008, 92, 112508 CrossRef.
- B. Mercey, P. A. Salvador, P. Lecoeur, W. Prellier, M. Hervieu, C. Simon, D. Chippaux, A. M. Haghiri-Gosnet and B. Raveau, J. Appl. Phys., 2003, 94, 2716 CrossRef CAS.
- G. Koster, B. L. Kropman, G. J. H. M. Rijnders, D. H. A. Blank and H. Rogalla, Appl. Phys. Lett., 1998, 73, 3920 CrossRef.
- A. Ohtomo and H. Y. Hwang, Nature, 2004, 427, 423 CrossRef CAS.
- L. F. Liu, H. B. Lu, Y. Y. Fei, H. Z. Guo, W. F. Xiang and Z. H. Chen, J. Cryst. Growth, 2003, 253, 374 CrossRef CAS.
- B. H. Toby, J. Appl. Crystallogr., 2001, 34, 210 CrossRef CAS.
- A. C. Larson and R. B. V. Dreele, Los Alamos National Laboratory Report, 1994, 86 Search PubMed.
- H. D. Li, X. N. Zhang, Z. Zhang, Z. X. Mei, X. L. Du and Q. K. Xue, J. Appl. Phys., 2007, 102, 046103 CrossRef.
- M. D. Losego, S. Mita, R. Collazo, Z. Sitar and J.-P. Maria, J. Vac. Sci. Technol, 2007, B 25, 1029 Search PubMed.
- G.-Q. Gong, C. Canedy, G. Xiao, J. Z. Sun, A. Gupta and W. J. Gallagher, Appl. Phys. Lett., 1995, 67, 1783 CrossRef CAS.
- E. O. Wollan and W. C. Koehler, Phys. Rev., 1955, 100, 545 CrossRef CAS.
- C. Martin, A. Maignan, M. Hervieu, B. Raveau, Z. Jirák, A. Kurbakov, V. Trounov, G. André and F. Bourée, J. Magn. Magn. Mater., 1999, 205, 184 CrossRef CAS.
- H. Tanaka and T. Kawai, Appl. Phys. Lett., 2000, 76, 3618 CrossRef CAS.
- S. Amelinckx and D. Van Dyck, Electron Diffraction Techniques, Oxford University Press, Oxford, UK, 1993 Search PubMed.
- E. Hecht, Optics, Addison Wesley, Reading, USA, 1987 Search PubMed.
- W. Xu, L. E. D. Long, T. Charlton, M. Chisholm and D. Ledermana, J. Appl. Phys., 2007, 101, 103920 CrossRef.
- H. C. Barshilia, N. Selvakumar, K. S. Rajam, K. Gopinadhan and S. Chaudhary, J. Phys. D: Appl. Phys., 2008, 41, 205409 CrossRef.
- B. K. Tanner, J. Phys. D: Appl. Phys., 1993, 26, A151 CrossRef CAS.
- H. J. Voorma, E. Louis, N. B. Koster, F. Bijkerk and E. Spiller, J. Appl. Phys., 1997, 81, 6112 CrossRef CAS.
- L. Yan, H. J. Niu, C. A. Bridges, P. A. Marshall, J. Hadermann, G. vanTendeloo, P. R. Chalker and M. J. Rosseinsky, Angew. Chem., Int. Ed., 2007, 46, 4539 CrossRef CAS.
- A. B. Shah, X. F. Zhai, B. Jiang, J.-G. Wen, J. N. Eckstein and J.-M. Zuo, Phys. Rew, 2008, B 77, 115103 Search PubMed.
- J. Sloan, P. D. Battle, M. A. Green, M. J. Rosseinsky and J. F. Vente, J. Solid State Chem., 1998, 138, 135 CrossRef CAS.
- R. B. Praus, G. M. Gross, F. S. Razavi and H.-U. Habermeier, J. Magn. Magn. Mater., 2000, 211, 41 CrossRef CAS.
- Y. Takamura, R. V. Chopdekar, J. K. Grepstad, Y. Suzuki, A. F. Marshall and A. Vailionis, J. Appl. Phys., 2006, 99, 08S902 CrossRef.
Footnotes |
| † Electronic supplementary information (ESI) available: Supplementary figures S1–S15. See DOI: 10.1039/c0sc00482k |
| ‡ The supporting information contains details regarding the growth process. Figure S2 shows the loss of RHEED intensity associated with deposition of CaO on STO. Figure S3 shows deposition of the individual CSMO and LCMO units on STO. Figure S4 shows growth of the (CSMO)2 (LCMO)2(CSMO)2 sequence directly on STO. This is possible but is a more complex way of starting the growth than using the six CSMO layers to enable the growth of CaO described in the main text. Figures S5–S7 describe data used in identifying the optimal growth window in the main text. Figure S8 shows RHEED data from the growth of the non-optimal sample B. Figure S9 describes the optimised growth process graphically. Figures S10–S15 are supporting magnetisation data from the bare substrate, the component perovskite units and magnetisation isotherms from the (CSMO)2 (LCMO)2 (CSMO)2n = 6 RP film at 150 K. |
| This journal is © The Royal Society of Chemistry 2011 |