Dispersion of carbon nanotubes with SDS surfactants: a study from a binding energy perspective
Wen Hui
Duan
*a,
Quan
Wang
*b and
Frank
Collins
a
aDepartment of Civil Engineering, Monash University, Clayton, Victoria, Australia 3800. E-mail: wenhui.duan@monash.edu
bDepartment of Mechanical and Manufacturing Engineering, University of Manitoba, Winnipeg, Manitoba, Canada R3T 5V6. E-mail: q_wang@umanitoba.ca
First published on 18th May 2011
Abstract
Dispersion of carbon nanotubes with sodium dodecyl sulfate (SDS) surfactant is reported by molecular mechanics simulations from an energy perspective. The interaction energy of carbon nanotubes in a tube bundle is first calculated to estimate the force sufficient to separate it from the bundle. The binding energy between increasing numbers of SDS molecules with a carbon nanotube is next estimated to identify the threshold number of surfactant molecules for a possible dispersion. With the help of ultrasonication, a sufficient number of SDS molecules are found to penetrate into an initial gap between a single tube and other nanotubes in the bundle. Owing to further congregation of the surfactants at the gap site, the gap becomes enlarged until complete dispersion. In addition to the dispersion observation in view of the interaction and binding energy perspectives, four congregation processes were identified to reveal the aggregation morphologies of SDS surfactants on the surface of carbon nanotubes as well as the effect of diameter of a carbon nanotube on the adsorption density.
Introduction
Carbon nanotubes (CNTs) are currently the focus of intense multidisciplinary research owing to their unique physical and chemical properties and their various potential applications. A major obstacle to such efforts is that CNTs aggregate into bundles because of highly attractive van der Waals (vdW) forces, which result in a poor dispersion of CNTs within most aqueous media.1,2 Recognizing this problem, extensive research has been reported in the literature on development of dispersion technologies based on both mechanical and chemical approaches. Mechanical agitation by ultrasonication produces temporary dispersion of CNTs in aqueous media, however it is often subsequently followed by agglomeration of the dispersed CNTs. Chemical approaches are designed to alter the surface energy of the CNT wall by either physically (non-covalent treatment) or chemically (covalent treatment). Aggressive chemical functionalization, such as the use of neat acids at high temperatures, might introduce structural defects resulting in inferior properties for the tubes.3 Non-covalent treatment is particularly attractive because of the possibility of adsorbing various groups onto the CNT surface without disturbing the π system of the tube lattice. In the last few years, the combination of non-covalent surface treatment by surfactants/polymers and ultrasonication has been widely used in the preparation of both aqueous and organic solutions to obtain high weight fraction of individually dispersed CNTs.4Surfactants disperse CNTs in aqueous solutions mainly through hydrophobic/hydrophilic interactions, in which the hydrophobic tail of a surfactant molecule adsorbs on the surface of CNT bundles while its hydrophilic head associates with water for dissolution.5 Dozens of surfactants6–21 have been tested, including NaDDBS (C12H25C6H4SO3Na), NaOBS (C8H17C6H4SO3Na), NaBBS (C4H9C6H4SO3Na), sodium benzoate (C6H5CO2Na), SDS (CH3(CH2)11-OSO3Na), and Triton X-100. Various processing conditions have been investigated using many different approaches, including direct microscopic imaging, UV-Vis absorption spectroscopy, viscosity, dynamic light scattering, zeta potential, TGA measurements, and size exclusion chromatography, etc5 with the following aims: (1) what is the dispersion capacity of surfactants; (2) what are the aggregate morphologies of surfactant molecules on the surface of CNTs and (3) what is the dispersion mechanism or process. Table 1 summarizes experimental data on dispersion of CNTs using SDS surfactants from public literatures.
| Authors | SDS concentration (g L−1) | dispersed CNT concentration (mg L−1) | ratio of SDS to CNTs | Aggregate morphology |
|---|---|---|---|---|
| Tan et al.16 | 10 | 200 | 50.00 | N A |
| Moore et al.17 | 20 | 9.9 | 2020.20 | N A |
| Oconnell et al.10 | 10 | 20 | 500.00 | Cylindrical |
| Yurekli et al.7 | 1 | 7 | 142.86 | Random |
| Yurekli et al.7 | 2.5 | 9 | 277.78 | Random |
| Yurekli et al.7 | 5 | 12 | 416.67 | Random |
| Yurekli et al.7 | 10 | 25 | 400.00 | Random |
| Islam et al.6 | 0.5 | 100 | 5.00 | Hemimicelles |
| Grossiord et al.18 | 1.8 | 1000 | 1.80 | Cylindrical or hemispherical |
| Grossiord et al.18 | 10 | 5000 | 2.00 | Cylindrical or hemispherical |
| Sun et al.19 | 10 | 1000 | 10.00 | N A |
| Steinmetz et al.15 | 10 | 8000 | 1.25 | N A |
| Vigolo et al.14 | 10 | 3500 | 2.86 | N A |
| Richard et al.12 | 10 | 1000 | 10.00 | Cylindrical |
| Jiang et al.9 | 20 | 5000 | 4.00 | N A |
| Hertel et al.8 | 10 | 100 | 100.00 | N A |
| Blanch et al.21 | 5 | 50 | 100.00 | N A |
It can be seen that the ratio of SDS to CNTs ranges from 1.25 to 2020. This large diversity indicates that a direct comparison of dispersion capacity of SDS among experimental data is not possible due to many factors involved in the dispersion process that are rarely reported.16 Regarding the aggregate morphology of SDS surrounding CNTs, which still remains a challenging topic of debate as shown in Table 1, three of the most probable configurations are proposed in the literature:7 cylindrical micelles, hemispherical micelles and random layer. Therefore, the two questions on the dispersion capacity of SDS and their corresponding aggregation morphologies still remain unsolved and further research is needed.
Strano et al.22 visualized the dispersion mechanism as follows: ultrasonication firstly provides a high local shear to fray the CNT bundle end and hence creates a gap between CNTs. The surfactant molecules are adsorbed onto the gap, keeping the two connected CNT entities partially separated. As the individual CNTs move relative to the bundle through Brownian motion, the surfactant continues to progress along the CNT length until a complete separation occurs. Evidence for this “unzippering” type of mechanism has been captured by cryo -TEM in the work of Bandyopadhyaya and co-workers.23 From an energy point of view, there are three distinct statuses in terms of the interaction between SDS molecules and CNTs in the above visualization; i.e. the bundle status, the micelle status, and the unzippering status. In the bundle status, CNTs are aggregated in a bundle, in which tube-tube interaction is dominant. In the micelle status, the individual CNTs are coated with SDS molecules, in which the interaction between SDS molecules and CNTs becomes important. In the unzippering status, CNT bundles are unzipped with the adsorption of SDS molecules around the gaps between CNT bundles caused by the ultrasonication. Both ultrasonic energy and adsorption energy between the SDS molecules and CNTs are required, leading to a final dispersion of the CNT bundle. This paper will investigate these three statuses from a binding energy perspective using molecular mechanics (MM) simulations. First of all, the interaction energy between adjacent CNTs within a CNT bundle is calculated. Then, adsorption energy between a CNT and SDS molecules in the micelle status is investigated with regards to adsorption density and diameters of the CNT. By energy comparison, i.e. comparing the adsorption energy to the interaction energy in a bundle, the minimum amount of SDS molecules needed to stabilize a CNT and their corresponding aggregate morphologies are justified. Finally, the aggregate morphologies of SDS molecules surrounding two CNTs in the unzippering status are revealed to verify the above energy comparison.
The approach outlined in this paper could be feasible to study the interaction between CNTs with achiral surfactants that have differing molecular tails: a hydrocarbon chain, an alkyl ether chain, a fluorocarbon chain, or a siloxane chain. The surfactants with a hydrocarbon tail may behave like SDS molecules. The approach could also be extended to study the wrapping of CNTs with chiral surfactants such as ssDNA,24–28 sodium cholate,29–31 and diporphyrins.32 Chiral surfactants behave differently with left-handed or right-handed CNTs and they have been intensively used in the purification and sorting of CNTs. Zheng et al. investigated the dispersion and sorting of CNTs using ssDNA.26,28 Sodium cholate (SC) has been used to separate enantiomers of CNTs based on the difference in the buoyant density of the dispersed CNT-SC hybrid.30,31 Peng et al.32 reported that the enantiomers of chiral surfactants display different affinity and dispersion ability of CNTs with a given chirality. Introducing chirality of CNTs and surfactants in the proposed approach could bring interesting findings in future studies. The research approach could also lead to new insights in the interaction of CNTs with bio-nano-systems, organic polymer composites, and ceramic matrices, and to assist other researchers towards better understanding and applying the physical and chemical properties of CNTs in the design of CNTs based devices and composites more efficiently.
Methods
Due to the increase in computer power over the last few years, molecular simulations have become an important tool for the study of complex interfacial nano-systems. Computer techniques allow us to extract more information about thermal and structural properties of interfacial problems from a molecular level that sometimes is not easy to be obtained from real experiments. Therefore, simulations ranging from fully atomistic to coarse-grain models33–40 on the interaction between CNTs and various surfactants and polymers like LPC, DPPC, DHPC, peptide, and SDS have been reported in the literature.41 Most of the previous computer simulations focus on the self-assembly process of surfactants on the surface of CNTs while the binding energy of surfactants and CNTs does not receive much consideration.MM simulations adopted in this paper mainly involve a geometry optimization (using the conjugate-gradient method) with the aim towards finding the minimum energy and the corresponding morphologies in the bundle status, the micelle status, and the unzippering status. In all the simulations, the water molecules are ignored because recent simulations show that there is no existence of water within the interface between a CNT and surrounding SDS molecules.10 The atomic interaction is modeled by the COMPASS force field (Condensed-phased Optimized Molecular Potential for Atomistic Simulation Studies),42 which is the first ab initio force field that was parameterized and validated using condensed-phase properties. This force field has been proven to be applicable in describing the mechanical properties of CNTs.43,44 In the COMPASS force field, the total potential energy E is expressed in eqn. 1 as follows:42
 | (1) |
• Contributions from each of the internal valence coordinates, i.e. ∑ E(b), ∑ E(θ), ∑ E(ϕ), and ∑ E(χ), and
• Cross-coupling terms between internal coordinates, i.e. ∑ E(bb′), ∑ E(bθ), ∑ E(bϕ), ∑ E(b′ϕ), ∑ E(θθ′), ∑ E(θϕ) and ∑ E(θθ′ϕ), and
• Nonbonded interactions, i.e. the van der Waals energy, ∑ E(vdw), and the Coulomb electrostatic energy, ∑ E(elec). It should be noted that the vdW energy is represented by a sum of repulsive and attractive Lennard-Jones terms.45
In the simulation of the micelle status, the SDS molecules are placed around a CNT with their tails perpendicular to the CNT axis. As an example shown in Fig. 1, a (10, 10) CNT with length of 49.19 Å is surrounded by 35 SDS molecules in a focused pattern. Seven SDS molecules within one plane are positioned around the CNT with a gap of 3.4 Å between the SDS tail groups and the CNT surface. There are a total of 5 planes along the axial direction of the CNT. Such an initial configuration has been widely used in the investigation of the self-assembly process of SDS molecules on a CNT surface.34,38,39,41,46,47
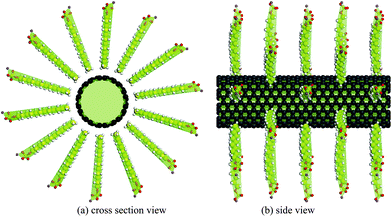 | ||
| Fig. 1 Initial configuration of 35 SDS molecules surrounding a (10, 10) CNT. | ||
The unzippering model proposed by Strano et al.22 for the transition from a bundle to individual CNTs is adopted here for the simulation on the adsorption of SDS molecules around two CNTs in the unzippering status. Ultrasonication is taken into account by setting an initial gap between two CNTs. The simulations are conducted in two stages: in the first stage, two fixed (10, 10) CNTs are placed in a parallel pattern with various initial gaps ranging from 6.5 Å to 10 Å. The minimum gap value of 6.5 Å, which admits the penetration of SDS molecules, is estimated from our MM simulations. The value is slightly smaller compared with 7.4 Å, predicated based on vdW packing radius of two carbon atoms and a CH3 group48 and consistent with 6.0 Å calculated by Tummala et al.49 and Xu et al.38 With each specific gap, different numbers of SDS molecules are placed around the gap as the example shown in Fig. 2. The whole system is then optimized and the penetration of SDS molecules into the gap is observed. Subsequently the CNTs are released from the fixed state and the whole system is re-optimized again to determine the change of the gap between CNTs with the penetration of SDS molecules.
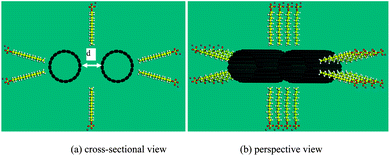 | ||
| Fig. 2 Initial configurations of two (10, 10) CNTs with a gap of d and 24 SDS molecules. | ||
Results and discussions
Interaction energy in the bundle status
Because of the vdW attractions, the CNTs tend to form close packed bundles50–53 as shown in Fig. 3 for 2-, 3-, 4- and 7-CNT bundles. The binding energy δE between one tube with the adjacent ones are calculated as shown in Table 2, and is defined as δE = potential energy of the CNT bundle minus potential energy of the CNT to be considered minus potential energy of other adjacent CNTs in the bundle. The present calculations are in excellent agreement with the binding energy of two infinitely long parallel tubes calculated by Girifalco et al.54 using Lennard-Jones potential45 also shown in Table 2. From the comparison of the binding energies between 4-tubes and 7-tubes, it can be seen that the tube-tube interactions are considered to be negligible (less than 0.7% of the binding energy)54 at distances between centers that are twice the radius of a CNT, and hence the bundle can be treated as if only the nearest neighbors are interacting. Therefore there are only three scenarios for the interaction in the CNTs bundle due to the hexagonal pattern of CNTs: i.e. one tube to one tube [Fig. 3(a)], one tube to two tubes [Fig. 3(b)], and one tube to three tubes [Fig. 3(c)]. | ||
| Fig. 3 Interaction between (a) tube-tube, (b) tube-two tubes, (c) tube-three tubes and (d) tube-six tubes. | ||
| Tube type | Radius (Å) | Length (Å) | Interaction energy (eV Å−1) in bundle | |||||
|---|---|---|---|---|---|---|---|---|
| 2 tubes54 | 2 tubesa | 3 tubesa | 4 tubesa (a) | 7 tubesa (b) | [(b) − (a)]/(a)% | |||
| a present calculation with tube spacing 3.347 Å. | ||||||||
| (4, 4) | 2.714 | 98.38 | −0.0897 | −0.0869 | −0.1718 | −0.2586 | −0.2602 | 0.63 |
| (6, 6) | 4.071 | 98.38 | −0.1101 | −0.1044 | −0.2089 | −0.3133 | −0.3134 | 0.02 |
| (8, 8) | 5.428 | 98.38 | −0.1274 | −0.1198 | −0.2394 | −0.3592 | −0.3592 | 0.00 |
| (10, 10) | 6.785 | 98.38 | −0.1428 | −0.1349 | −0.2690 | −0.4040 | −0.4040 | 0.00 |
| (12, 12) | 8.142 | 98.38 | −0.1568 | −0.1484 | −0.2969 | −0.4453 | −0.4453 | 0.00 |
| (14, 14) | 9.499 | 98.38 | −0.1698 | −0.1612 | −0.3219 | −0.4831 | −0.4831 | 0.00 |
| (16, 16) | 10.856 | 98.38 | −0.1820 | −0.1732 | −0.3454 | −0.5185 | −0.5185 | 0.00 |
| (18, 18) | 12.213 | 98.38 | −0.1935 | −0.1837 | −0.3674 | −0.5510 | −0.5510 | 0.00 |
| (20, 20) | 13.570 | 98.38 | −0.2043 | −0.1938 | −0.3897 | −0.5835 | −0.5835 | 0.00 |
| (22, 22) | 14.927 | 98.38 | −0.2146 | −0.2047 | −0.4091 | −0.6137 | −0.6137 | 0.00 |
| (24, 24) | 16.283 | 98.38 | −0.2245 | −0.2144 | −0.4289 | −0.6433 | −0.6433 | 0.00 |
| (26, 26) | 17.640 | 98.38 | −0.2340 | −0.2235 | −0.4464 | −0.6699 | −0.6699 | 0.00 |
| (28, 28) | 18.997 | 98.38 | −0.2431 | −0.2324 | −0.4637 | −0.6961 | −0.6961 | 0.00 |
To reveal the possible absorption of SDS molecules in two CNTs in the unzippering status, the interaction energy between two (10, 10) tubes with varying distances are computed and shown in Fig. 4. Comparing with carbon bond energy, the interaction energy between two CNTs has a long range, i.e. approaches zero after the gap between two CNTs closes to 10 Å, indicating a complete separation of the two CNTs.
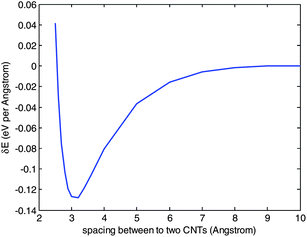 | ||
| Fig. 4 Tube-tube interaction potentials for (10, 10) CNTs. | ||
Binding energy and aggregation process of SDS on a CNT surface in the micelle status
The SDS molecule that was modeled in this study has a tail of 12 carbon atoms attached to a sulfate group, giving the molecule amphiphilic properties: the hydrophobic group, –CH3, of the SDS molecule, adsorbs on the surface of a CNT tube, while the hydrophilic head, –SO4, associates with water for dissolution. As abovementioned, three aggregation morphologies of surfactant molecules surrounding CNTs, i.e. cylindrical micelle, hemimicelle, and random layer, have been proposed to describe the interaction between surfactants and a CNT. In this section, we calculate the binding energy between increasing number of SDS molecules and a CNT tube, and their corresponding aggregation morphologies. The possible aggregation morphologies are identified based on the energy principle: a stable dispersion of CNTs with SDS requires the binding energy between a CNT and the surrounding SDS molecules be higher than that between a CNT and its adjacent tubes, as calculated in the above section. Hence there exists a critical threshold of the number of SDS molecules needed for the dispersion of an individual CNT from a bundle.The variation of binding energies of a (10, 10) CNT with its surrounding SDS molecules are calculated as shown in Fig. 5. A total of 31 cases with increasing number of SDS molecules, changing from 6 to 204, are considered. The binding energy is defined as δE = potential energy of the CNT and surrounding SDS molecules minus potential energy of the CNT minus potential energy of surrounding SDS molecules. Selected morphologies of SDS molecules on the surface of the (10, 10) CNT are provided in Fig. 6. From Fig. 5, four stages of the binding energy are found and will be discussed for an understanding of the absorption process. In the stage (a), the number of SDS molecules on the CNT surface is relatively small, ranging from 6 to 15. The corresponding binding energy is linearly increased with the number of surfactants. As shown in Fig. 6(a), 12 SDS molecules (corresponding to 0.57 molecules per nm2) are randomly adsorbed on the surface of the CNT in the axial direction and wrap into a circular alignment in the circumferential direction. It is found that the binding energy of 8 SDS molecules (corresponding to 0.38 molecules per nm2) with one tube is closer to the tube-tube interaction energy, −0.1349 eV Å−1, as shown in Table 2, indicating a possible separation of one tube with 8 SDS molecules from a 2-tube bundle. The separation of a 2 tube bundle will be further elaborated in the next section.
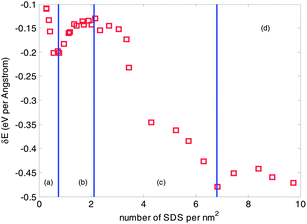 | ||
| Fig. 5 Variation of binding energy with respect to the number of SDS on the surface of a (10, 10) CNT. | ||
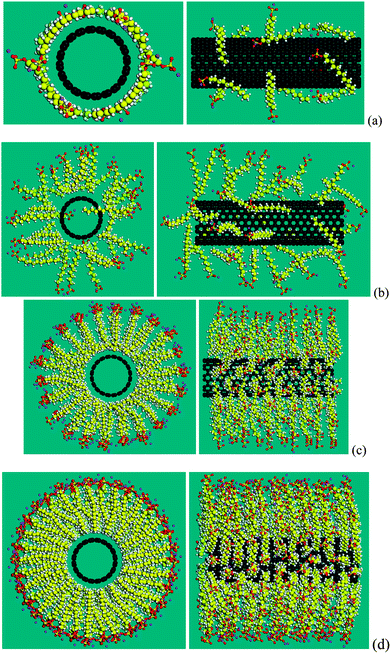 | ||
| Fig. 6 Typical aggregation morphologies of SDS molecules surrounding a (10, 10) CNT. Four morphologies correspond to four stages in variation of binding energy in terms of adsorption density as shown in Fig. 5: (a) 0.57 SDS per nm2 (corresponding to 12 SDS molecules), (b) 1.67 SDS per nm2 (35 SDS), (c) 5.25 SDS per nm2 (110 SDS), and (d) 9.73 SDS per nm2 (204 SDS). | ||
With the increase of the number of SDS molecules, the aggregation morphology starts to transit to a cylindrical micelle, as shown in Fig. 6(b). 35 SDS molecules (corresponding to 1.67 molecules per nm2) are randomly attached to the CNT surface. However, in contrast to the wrapping shape in Fig. 6(a), these molecules adhere to the surface of the CNT in a “standing” way; i.e. the hydrophobic tails of SDS molecules are attached to the surface of CNTs and their axial directions are aligned in the perpendicular manner. The SDS molecules are not sufficient to cover the whole area of the CNT in its circumferential direction, resulting in a decreased number of carbon atoms attaching to the CNT surface. Therefore the binding energy decreases in Fig. 5, stage (b) when compared to that in stage (a).
When the number of SDS molecules is further increased, the alignment of the SDS molecules is shown to be a cylindrical micelle. The aggregation morphology of 110 SDS molecules (corresponding to 5.25 molecules per nm2) on the CNT is provided in Fig. 6(c). It is seen that the axes of SDS molecules continue to be perpendicular to the axial direction of the CNT tube, similar to the stage (b), however they commence congregation on the surface of the CNT, resulting in an approximately proportional increase in the binding energy with respect to the number of SDS molecules, as shown in Fig. 5 stage (c). At this stage, it is found that the dispersion of a (10, 10) 3-tube or a 4-tube bundle with SDS molecules becomes possible. The binding energy of 78 SDS molecules (corresponding to 3.72 molecules per nm2) and 124 SDS molecules (corresponding to 5.93 molecules per nm2) are greater than the interaction energy of a 3-tube bundle, −0.2690 eV Å−1 and a 4-tube bundle, −0.4040 eV Å−1, respectively, as shown in Table 2, indicating a possible separation of one tube from a 3-tube bundle and 4-tube bundle.
If the number of SDS molecules continues to increase, there is little variation of binding energy, as shown by a plateau in Fig. 5, stage (d). The binding energy remains almost constant with the increasing number of SDS molecules, indicating a limitation on the adsorption density. The aggregation morphology of 204 SDS molecules (corresponding to 9.73 molecules per nm2) on the CNT is provided in Fig. 6(d). The SDS molecules are closely packed into a cylindrical micelle, with a slight expansion in the axial direction.
In order to study the effect of curvature of a CNT tube on binding energy, the binding energy of a (6, 6) and a (20, 20) CNT, with increasing number of SDS molecules, are calculated as shown in Fig. 7. It can be seen that the four stages in variation of binding energy, previously identified in the case of the (10, 10) CNT, still applies to the case of the (20, 20) CNT, while the boundaries of the four stages are not clear in the case of the (6, 6) CNT. The reason may be attributed to the bending rigidity of the carbon chain in SDS molecules. When the curvature of a CNT tube is small, for example the (20, 20) CNT, there is no preferred structural geometry for an SDS molecule to be: either wrapped around or standing on the CNT surface. There are clear transitions between wrapping mode to standing mode in the aggregation process of the binding energy of the (10, 10) and (20, 20) CNTs. In contrast, an SDS molecule is more prone to the standing mode if the curvature of the CNT is large, for example the (6, 6) CNT, resulting in a rather weak transition between wrapping mode and standing mode. Another observation is that the adsorption density of SDS molecules is dependent on curvature; for example, it has coverage up to 10 molecules per nm2 with the (6, 6) CNT, and while the curvature become smaller, it goes down to 6 molecules per nm2 with the (20, 20) CNT. The range of 6 to 10 molecules per nm2 is close to the range of 11.6–22.5 predicted by Matarredona et al.,55 and higher than those for a flat interface in the published literature: 1.94 molecules per nm2 (determined from surface tension data), 2.51 molecules per nm2 (from film pressure studies), 2.87 molecules per nm2 (based on cubic packing of sulfonate head group), 2.2∼2.9 molecules per nm2 (from Maron's titration), and fluorescence probe (4 molecules per nm2).18,56–59
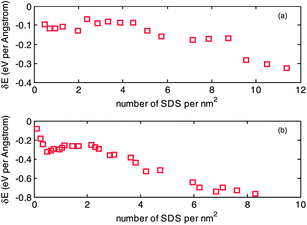 | ||
| Fig. 7 Variation of binding energy with respect to adsorption density of SDS on the surface of (a) a (6, 6) CNT and (b) a (20, 20) CNT. | ||
Separation process of 2 (10, 10) CNTs using SDS molecules in the unzippering status
In the earlier two sections, we discussed the bundle status and micelle status, visualized by Strano et al.,22 from an energy point of view. It is concluded that there is a minimum number of SDS molecules to enable separation of the CNT bundles to form individual CNTs. In this section, the penetration of SDS molecules into the initial gap between two parallel CNTs is explored to verify the above conclusion.Results show that, with the initial gap of 6.5 Å, 8 SDS molecules can penetrate and warp onto the surface of the CNT, as shown in Fig. 8(a), which is in line with the morphology as shown in Fig. 6(a). We find that 8 SDS molecules are the minimum number to keep the separation distance of 6.5 Å and the two CNTs will approach toward each other if the number of SDS is less than 8. With 8 SDS molecules, the individual CNTs are not able to re-attach to form a bundle, but have a slight misalignment. As the spacing between two CNTs increases, more SDS molecules attach to the gap. Finally, when the gap between two CNTs reaches 10 Å, 18 SDS molecules are required to keep the gap open, as shown in Fig. 8(b). The two initially parallel CNTs are completely misaligned, with a shortest distance of around 10 Å. Two tubes are separated due to negligible interaction energy, as shown in Fig. 4. It is thus concluded that for a pair of bundled CNTs (i.e. two-CNT bundle), at least 9 SDS are required to separate the bundle, which complies with our calculations.
 | ||
| Fig. 8 Separation of two (10, 10) CNTs with (a) 24 SDS molecules, (b) 34 SDS molecules. | ||
Conclusion
In summary, we performed MM simulations from an energy perspective on SDS assisted dispersion of a single CNT from a bundle. It is demonstrated that a CNT tube can be dispersed by a sufficient number of SDS surfactant molecules owing to the binding energy between the surfactants and the CNT. Four congregation processes are identified by an energy comparison to reveal the minimum number of SDS molecules needed to stabilize the CNT dispersion and their corresponding aggregation morphologies on a CNT surface. The minimum number of SDS is verified through the separation of two tubes. Moreover, it is found that the initial gap between two tubes caused by prior ultrasonication is essential for the dispersion. The research findings disclose the driving force in dispersion of CNT bundles from the binding energy calculations and reveal the dispersion process by providing a congregation description from molecular simulations.Acknowledgements
WHD thanks the financial support from the Australia Research Council. QW thanks the financial support from the Canada Research Chairs Program (CRC) and the National Science and Engineering Research Council (NSERC).References
- C. Thauvin, S. Rickling, P. Schultz, H. Celia, S. Meunier and C. Mioskowski, Nat. Nanotechnol., 2008, 3, 743–748 CrossRef CAS.
- B. Li, L. Y. Li, B. B. Wang and C. Y. Li, Nat. Nanotechnol., 2009, 4, 358–362 CrossRef CAS.
- J. N. Coleman, U. Khan, W. J. Blau and Y. K. Gun'ko, Carbon, 2006, 44, 1624–1652 CrossRef CAS.
- L. Vaisman, H. D. Wagner and G. Marom, Adv. Colloid Interface Sci., 2006, 128, 37–46 CrossRef.
- H. Wang, Curr. Opin. Colloid Interface Sci., 2009, 14, 364–371 CrossRef CAS.
- M. F. Islam, E. Rojas, D. M. Bergey, A. T. Johnson and A. G. Yodh, Nano Lett., 2003, 3, 269–273 CrossRef CAS.
- K. Yurekli, C. A. Mitchell and R. Krishnamoorti, J. Am. Chem. Soc., 2004, 126, 9902–9903 CrossRef CAS.
- T. Hertel, A. Hagen, V. Talalaev, K. Arnold, F. Hennrich, M. Kappes, S. Rosenthal, J. McBride, H. Ulbricht and E. Flahaut, Nano Lett., 2005, 5, 511–514 CrossRef CAS.
- L. Jiang, L. Gao and J. Sun, J. Colloid Interface Sci., 2003, 260, 89–94 CrossRef CAS.
- M. J. O'Connell, S. M. Bachilo, C. B. Huffman, V. C. Moore, M. S. Strano, E. H. Haroz, K. L. Rialon, P. J. Boul, W. H. Noon, C. Kittrell, J. Ma, R. H. Hauge, R. B. Weisman and R. E. Smalley, Science, 2002, 297, 593–596 CrossRef CAS.
- C. A. Dyke and J. M. Tour, Chem.–Eur. J., 2004, 10, 812–817 CrossRef CAS.
- C. Richard, F. Balavoine, P. Schultz, T. W. Ebbesen and C. Mioskowski, Science, 2003, 300, 775–778 CrossRef CAS.
- P. Poulin, B. Vigolo and P. Launois, Carbon, 2002, 40, 1741–1749 CrossRef CAS.
- B. Vigolo, A. Penicaud, C. Coulon, C. Sauder, R. Pailler, C. Journet, P. Bernier and P. Poulin, Science, 2000, 290, 1331–1334 CrossRef CAS.
- J. Steinmetz, M. Glerup, M. Paillet, P. Bernier and M. Holzinger, Carbon, 2005, 43, 2397–2400 CrossRef.
- Y. Tan and D. E. Resasco, J. Phys. Chem. B, 2005, 109, 14454–14460 CrossRef CAS.
- V. C. Moore, M. S. Strano, E. H. Haroz, R. H. Hauge, R. E. Smalley, J. Schmidt and Y. Talmon, Nano Lett., 2003, 3, 1379–1382 CrossRef CAS.
- N. Grossiord, P. van der Schoot, J. Meuldijk and C. E. Koning, Langmuir, 2007, 23, 3646–3653 CrossRef CAS.
- Z. Sun, V. Nicolosi, D. Rickard, S. D. Bergin, D. Aherne and J. N. Coleman, J. Phys. Chem. C, 2008, 112, 10692–10699 CrossRef CAS.
- S. D. Bergin, Z. Y. Sun, P. Streich, J. Hamilton and J. N. Coleman, J. Phys. Chem. C, 2010, 114, 231–237 CrossRef CAS.
- A. J. Blanch, C. E. Lenehan and J. S. Quinton, J. Phys. Chem. B, 2010, 114, 9805–9811 CrossRef CAS.
- M. S. Strano, V. C. Moore, M. K. Miller, M. J. Allen, E. H. Haroz, C. Kittrell, R. H. Hauge and R. E. Smalley, J. Nanosci. Nanotechnol., 2003, 3, 81–86 CrossRef CAS.
- R. Bandyopadhyaya, E. Nativ-Roth, O. Regev and R. Yerushalmi-Rozen, Nano Lett., 2002, 2, 25–28 CrossRef CAS.
- S. Taeger, O. Jost, W. Pompe and M. Mertig, in Electronic Properties of Synthetic Nanostructures, ed. H. Kuzmany, J. Fink, M. Mehring and S. Roth, 2004, vol. 723, pp. 185–188 Search PubMed.
- B. Gigliotti, B. Sakizzie, D. S. Bethune, R. M. Shelby and J. N. Cha, Nano Lett., 2006, 6, 159–164 CrossRef CAS.
- M. Zheng, A. Jagota, M. S. Strano, A. P. Santos, P. Barone, S. G. Chou, B. A. Diner, M. S. Dresselhaus, R. S. McLean, G. B. Onoa, G. G. Samsonidze, E. D. Semke, M. Usrey and D. J. Walls, Science, 2003, 302, 1545–1548 CrossRef CAS.
- S. Li, P. He, J. Dong, Z. Guo and L. Dai, J. Am. Chem. Soc., 2005, 127, 14–15 CrossRef CAS.
- M. Zheng, A. Jagota, E. D. Semke, B. A. Diner, R. S. McLean, S. R. Lustig, R. E. Richardson and N. G. Tassi, Nat. Mater., 2003, 2, 338–342 CrossRef CAS.
- S. Ghosh, S. M. Bachilo and R. B. Weisman, Nat. Nanotechnol., 2010, 5, 443–450 CrossRef CAS.
- A. A. Green, M. C. Duch and M. C. Hersam, Nano Res., 2009, 2, 69–77 CrossRef CAS.
- A. A. Green and M. C. Hersam, Nano Lett., 2008, 8, 1417–1422 CrossRef CAS.
- X. B. Peng, N. Komatsu, T. Kimura and A. Osuka, J. Am. Chem. Soc., 2007, 129, 15947–15953 CrossRef CAS.
- R. Qiao and P. C. Ke, J. Am. Chem. Soc., 2006, 128, 13656–13657 CrossRef CAS.
- E. J. Wallace and M. S. P. Sansom, Nano Lett., 2007, 7, 1923–1928 CrossRef CAS.
- E. J. Wallace and M. S. P. Sansom, Nanotechnology, 2009, 20, 045101 CrossRef.
- N. R. Tummala and A. Striolo, Phys. Rev. E: Stat., Nonlinear, Soft Matter Phys., 2009, 80 Search PubMed.
- M. Calvaresi, M. Dallavalle and F. Zerbetto, Small, 2009, 5, 2191–2198 CrossRef CAS.
- Z. J. Xu, X. N. Yang and Z. Yang, Nano Lett., 2010, 10, 985–991 CrossRef CAS.
- N. R. Tummala and A. Striolo, ACS Nano, 2009, 3, 595–602 CrossRef CAS.
- C. C. Chiu, G. R. Dieckmann and S. O. Nielsen, Biopolymers, 2009, 92, 156–163 CrossRef CAS.
- H. Domínguez, J. Phys. Chem. B, 2007, 111, 4054–4059 CrossRef CAS.
- D. Rigby, H. Sun and B. E. Eichinger, Polym. Int., 1997, 44, 311–330 CrossRef CAS.
- W. H. Duan, Q. Wang, K. M. Liew and X. Q. He, Carbon, 2007, 45, 1769–1776 CrossRef CAS.
- Q. Wang, W. H. Duan, K. M. Liew and X. Q. He, Appl. Phys. Lett., 2007, 90, 033110 CrossRef.
- J. E. Jones, Proceedings of the Royal Society of London Series a-Containing Papers of a Mathematical and Physical Character, 1924, 106, 463–477 Search PubMed.
- N. R. Tummala and A. Striolo, J. Phys. Chem. B, 2008, 112, 1987–2000 CrossRef CAS.
- M. Sammalkorpi, A. Z. Panagiotopoulos and M. Haataja, J. Phys. Chem. B, 2008, 112, 2915–2921 CrossRef CAS.
- J. N. Israelachvili, Intermolecular and surface forces, Academic Press, London; San Diego, 1991 Search PubMed.
- N. R. Tummala, B. H. Morrow, D. E. Resasco and A. Striolo, ACS Nano, 2010, 4, 7193–7204 CrossRef CAS.
- J. Tersoff and R. S. Ruoff, Phys. Rev. Lett., 1994, 73, 676–679 CrossRef CAS.
- S. N. Song, X. K. Wang, R. P. H. Chang and J. B. Ketterson, Phys. Rev. Lett., 1994, 72, 697–700 CrossRef CAS.
- J. C. Charlier, X. Gonze and J. P. Michenaud, Europhys. Lett., 1995, 29, 43–48 CrossRef CAS.
- D. Sanchez-Portal, E. Artacho, J. M. Soler, A. Rubio and P. Ordejon, Phys. Rev. B: Condens. Matter, 1999, 59, 12678–12688 CrossRef CAS.
- L. A. Girifalco, M. Hodak and R. S. Lee, Phys. Rev. B: Condens. Matter, 2000, 62, 13104–13110 CrossRef CAS.
- O. Matarredona, H. Rhoads, Z. R. Li, J. H. Harwell, L. Balzano and D. E. Resasco, J. Phys. Chem. B, 2003, 107, 13357–13367 CrossRef CAS.
- J. F. Scamehorn, R. S. Schechter and W. H. Wade, J. Colloid Interface Sci., 1982, 85, 463–478 CrossRef CAS.
- J. N. Israelachvili, D. J. Mitchell and B. W. Ninham, J. Chem. Soc., Faraday Trans. 2, 1976, 72, 1525–1568 RSC.
- M. A. McGregor and G. T. Barnes, J. Colloid Interface Sci., 1978, 65, 291–295 CrossRef CAS.
- P. Chandar, P. Somasundaran and N. J. Turro, Journal of Colloid and Interface Science, 1987, 117, 31–46 CrossRef CAS.
| This journal is © The Royal Society of Chemistry 2011 |
