DOI:
10.1039/C1SC00216C
(Edge Article)
Chem. Sci., 2011,
2, 1969-1975
Rapid fluorescence imaging of miRNAs in human cells using templated Staudinger reaction†
Received
4th April 2011
, Accepted 7th July 2011
First published on 4th August 2011
Abstract
It is generally accepted that microRNAs (miRNAs) play a crucial role in gene expression regulation and that their aberrant expression is intimately linked with pathologies, most notably cancer. There is thus significant interest in detecting and quantifying these important regulators. Herein, we report the fluorescence imaging of miRNAs within a few hours using a nucleic-acid templated Staudinger reaction. A good correlation between the level of miRNAs and the fluorescence intensity was observed across different cell lines. This method was shown to also be applicable for suspended cells with fluorescence quantification by flow cytometry.
Introduction
The detection of nucleic acids directly from intact cells holds tremendous potential with important applications in biology and clinical diagnostics. To this end, a direct fluorescence read-out is most appealing and specific nucleic acid sequences have generally been detected with molecular beacons1 or fluorescence in situ hybridization (FISH).2 More recently, an alternative strategy based on nucleic acid templated reactions has proven to be viable for the detection of highly expressed mRNA sequences or ribosomal RNA in human cells or bacteria.3–5 An intrinsic advantage of technologies based on nucleic acid templated reactions is the possibility to achieve signal amplification based on the fact that the template can act catalytically (Fig. 1).6 Moreover, false positive signals stemming from unspecific affinities of the probes are minimized since they do not promote the fluorescence yielding reaction. Another advantage is the speed of the procedure which does not require lengthy hybridization or washing steps. MiRNAs are endogenous small non-protein-coding RNAs which are primary regulators of gene expression in many basic cellular processes including proliferation, differentiation and apoptosis. These single stranded short RNAs (∼21–24 nt) negatively regulate their targets in several ways, depending on the degree of complementarity between miRNAs and their targets. As one miRNA can target several mRNAs, it is predicted that 20–30% of all human genes are partially regulated viamiRNAs.7 There are roughly 1,000 miRNAs encoded in the human genome comprising around 4% of all expressed human genes. This makes miRNAs one of the largest classes of regulators. Many alterations in miRNA expression or miRNA mutations correlate with various human cancers indicating that miRNAs can function as tumour suppressors or oncogenes.8 Recently, miRNA expression patterns have been shown to be valuable diagnostic and prognostic markers. Classification of tumour subtypes based on miRNA expression profiles has proven to be even more accurate than classification based on the expression profiles of protein coding genes.9 The crucial role of miRNAs requires methods to efficiently image and quantify their presence and distribution. However, their size impose additional challenges as compared to mRNA or rRNA. First and foremost, miRNAs can diffuse out of cells during the long incubation and washing steps of in situ hybridization protocol thus requiring additional cross-linking steps.10 Second, the short nature of miRNAs preclude signal amplification by multiple complementary probes along a single nucleic acid sequence.11 Currently, most probes designed to image miRNAs rely on a locked nucleic acid (LNA) to increase the affinity of the probes in order to achieve detection.10,12 We have shown that peptide nucleic acid (PNA) is well suited for nucleic acid imaging by templated Staudinger reaction.4,5,13,14 Herein we report the application of this approach with a new azide-quenched rhodamine for the detection of miR-21 and miR-31 in different cell populations and demonstrate its applicability in flow cytometry.
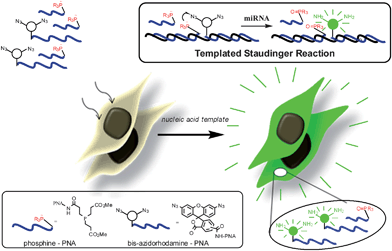 |
| | Fig. 1 Schematic representation of nucleic acid-templated reduction of bis-azidorhodamine for miRNA imaging. Cells incubated with PNA-probes designed to interrogate the presence of a specific miRNA sequence will become fluorescent if the appropriate template (miRNA) catalyzes the conversion of quenched bis-azidorhodamine-PNA to rhodamine by action of the phosphine-PNA. | |
Results and discussion
General design principles
PNA is an analogue of natural nucleic acids with enhanced affinity and selectivity in hybridization to RNA and DNA as well as excellent metabolic stability by virtue of its non-natural peptoid backbone.15 Additionally, modification of the peptoid backbone with guanidine residues (GPNA) confers cell permeability to oligomers.16 These features had led us to explore PNA-GPNA hybrids as a platform in templated reactions and we had shown that probes as short as 6 mer provided sufficient duplex stability to promote a Staudinger reaction.4,13 Our previous design used a rhodamine dye quenched by a single azide which provided a greater than 30 fold enhancement of fluorescence upon Staudinger reduction. To further enhance signal to noise ratio as well as sensitivity of the system, we explored a bis-azidorhodamine as shown in Fig. 1. This fluorophore was found to have 120 fold changes in the intensity of its emission upon reduction and hence provides a four-fold enhancement over the previous design. Furthermore, it is prepared in one pot from commercially available 5(6)-carboxy rhodamine 110 albeit in modest yield. Preliminary experiments evaluating the kinetics of the sequential azide reduction using 1 equivalent of phosphine for 1 equivalent of bis-azidorhodamine did not show an accumulation of the monoazidorhodamine suggesting that the reduction of the second azide is fast relatively to the reduction of the first one. We then turned our attention to the detection of miRNAs and selected miR-21 as a prototypical sequence based on the fact that it is one of the miRNAs which is most frequently found to be over-expressed in solid tumours.17 Moreover it was shown to target key tumour-suppressive pathways such as components of p53, transforming growth factor β (TGF-β) and mitochondrial tumour-suppressive pathways.18 Increased levels of miR-21 have been identified in diverse cancer types such as breast, liver, pancreatic cancer and glioblastoma. The suppression of miR-21 by the use of LNA-antimir-21 oligonucleotides in glioblastoma cells implanted into nude mice led to a sharp reduction in glioma burden when compared with undisturbed tumour proliferation. In addition, this treatment also sensitized glioma to cytotoxic drugs through enhanced apoptosis.19 Also for breast cancer, tumours derived from cells treated with anti-miR-21 oligonucleotides grew substantially slower in xenograft carcinoma mouse models.20 Taken together, these reports demonstrate that miR-21 is not only up-regulated in tumour cells, but also strongly contributes to tumour growth and progression.
Development of probes for miRNA-21 sensing
For a reaction to be promoted by a nucleic acid template, the duplex between the template and the reagents must have a half-life which is attuned with the rate of reaction. We had previously shown that good reaction rate and turn-over could be achieved with six to eight nucleotide probes. As our new fluorophore design contains two azides and requires two equivalents of phosphine, we reasoned that its PNA conjugate would benefit from a greater stability with the template than the phosphine probe in order to achieve the double reduction. Furthermore, it has been reported that GPNA of 12 to 14 mer accumulate around the ER of human cells21 which could be used to achieve higher signal by avoiding diffusion of the product. To this end, we investigated several lengths (14, 10, 8 and 6 mer) for the probe carrying the quenched fluorophore while maintaining a relatively short length for the probe carrying the phosphine (7 mer). Experiments evaluating the kinetics of the reactions with the bis-azidorhodamine using the 14 mer probe revealed that the conversion of the bis-azidorhodamine was fast, achieving nearly 100% conversion within 10 min using 1 equivalent of template (Fig. 2). The reaction remained fast with substoichiometric template. Despite the higher Tm of these probes, the template did turnover efficiently affording over 10-fold signal amplification and could be detected down to low nM concentration. Next we compared the sensitivity of the reaction rate to a mismatch in the template at 37 °C (Fig. 3). At this temperature, the 14 mer probe differentiated poorly between a perfect matched template and a template carrying a single mutation. This can be rationalized by the fact that the 14 mer probe has a Tm greater than 70 °C and the destabilization incurred by a single or even double mismatch is not enough to abrogate duplex formation at 37 °C. Shorter probes on the other hand afforded better discrimination between the perfect matched template and the mismatched template.
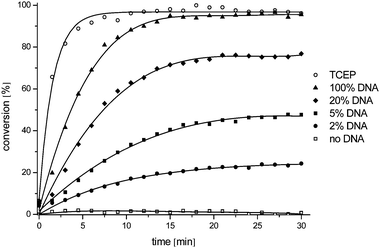 |
| | Fig. 2 Evaluation of the templated reaction in vitro. Templated reaction in solution: 100 nM Lys(N3RhN3) GT*CTG*ACT*ACA*ACT*Arg; 400 nM Arg AT*CG*AA*T dmTCEP, DNA template corresponding to miRNA21 (2, 5, 20 or 100 nM), 37 °C, pH = 7.4. The extent of the reaction was calculated in relation to the maximum fluorescence obtained using a large excess of TCEP. * denote PNA residue carrying a guanidinium modification (GPNA). | |
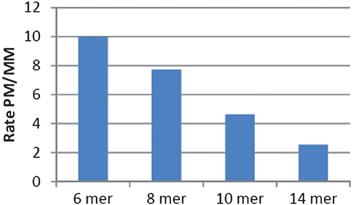 |
| | Fig. 3 Comparing reaction fidelity of different probe lengths. The rate of the reaction catalyzed by a perfect match template (PM) compared to a mismatched template (MM) using 20% template. The slope of the initial rate of reaction was used as a first order approximation of reaction rate. | |
Imaging miR-21 in MCF-7, a breast cancer cell line
We next investigated the templated reaction in a breast cancer cell line (MCF-7) known to express high levels of miR-21. To avoid cell detachment and facilitate imaging, a short fixation procedure (3.7% formaldehyde for 20 min) was used. We established that a minimum of 1 h incubation was necessary and that the maximum intracellular concentration of profluorescent probes was reached within 2–3 h incubation. The samples were then treated with solutions of the perfect match or the mismatch phosphine probes to evaluate the specificity of the reaction. A high concentration of a cell permeable phosphine (tmTCEP) was used to establish the maximum fluorescence level. Each reaction was allowed to proceed for 1.5 h (Fig. 4a). To quantify the observed fluorescence, we used the measurement module of NIS Elements Advanced Research software and calculated mean fluorescence intensity of cells on photos from three average points of dish (Fig. 4b). The yield of each reaction was calculated by its fluorescence intensity relative to the tmTCEP treated sample. A matrix of different concentrations of bis-azidorhodamine probe (100 of 300 nM) and phosphine probes (2 to 4 equivalent) was tested. Quantification of obtained signal revealed that the reaction gave the highest contrast between the perfect match and mismatch reaction when using 100 nM of the rhodamine probe and 200 nM of the phosphine probe. Using these conditions, an average 16-fold difference between the perfect match probe and the mismatched probe was reproducibly obtained.
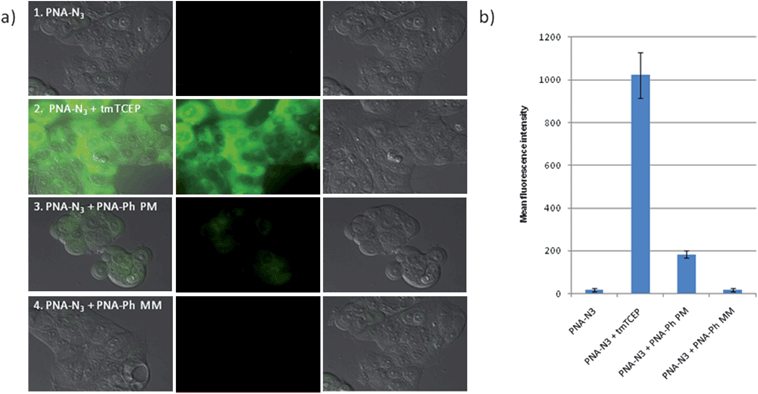 |
| | Fig. 4
miR21 imaging in MCF-7 cells. a) From left to right: merged image, fluorescence – Rho110 channel, DIC of cells treated with 1) first 100 nM Lys(N3RhN3) C*TG*AC*TA*C Arg then PBS alone (which were used as a negative control); 2) first Lys(N3RhN3) C*TG*AC*TA*C Arg then 1 mM tmTCEP (a cell permeable phosphine - these conditions were used as a positive control to define the maximum fluorescence); 3) first 100 nM Lys(N3RhN3) C*TG*AC*TA*C Arg then 200 nM Arg AT*CG*AA*T dmTCEP (the perfect match probe - PM); 4) first 100 nM Lys(N3RhN3) C*TG*AC*TA*C Arg then 200 nM Arg AT*GA*AA*T dmTCEP (the mismatched probe - MM). b) Quantification of fluorescence based on the average fluorescence at three distinct areas within the culture dish (error bars represent the standard deviations). The conversion with the perfect match probe and mismatch probe was calculated by taking the fluorescence intensity divided by the maximum intensity (maximum fluorescence - positive control) corrected for the background fluorescence (negative control). MCF-7 afforded 16% conversion with the perfect match probe and 1% conversion for the mismatch probe. | |
Imaging miR-21 in different cell lines
To assess the utility of the technology in discriminating between cell lines with high and low levels of miR-21, the optimized protocol was used to compare five different cell lines (Fig. 5a): MCF-7, BT474, JIMT-1 (all three breast cancer cell lines), HeLa (cervix cancer cell line) and HEK293T (immortalized human embryonic kidney cell line). It is known that MCF-7 and BT474 express high levels of miR-21, HeLa moderate levels and JIMT-1 and HEK293T only express low levels of miR-21 as confirmed by quantitative PCR (RT-qPCR) (Fig. 5b). Qualitatively, the conversion yield of the reaction with the perfect match probes is significantly higher in MCF-7 and BT474 than in JIMT1 and HEK293T (see Fig. S1–4† for complete set of images including positive and negative controls as well as mismatched probes). To further refine this qualitative assessment, the yield of the perfect match reaction was divided by the yield of the mismatch reaction in order to subtract unspecific background reaction (see Fig. S5† for raw quantification data of fluorescence). This ratio of conversion was then plotted against the relative level of miR-21 determined by qRT-PCR. As can be seen in Fig. 5c, there is a good correlation between the levels of specific reaction versus miR-21 concentration. In the most intense cell line (MCF-7), there is 16 fold more reaction between the perfect match reaction and the mismatched reaction whereas JIMT-1, another breast cancer cell line but with low levels of miR-21 has only marginal reaction which is indistinguishable from the background. HEK293T which expresses only very low levels of miR-21 did not afford any reaction. The good correlation between miRNA levels and relative reaction suggests that the fluorescence observed is a direct reflection of the miRNA level. Nevertheless, other differences amongst the cell lines could contribute to changes in reactivity. To evaluate the difference of fluorescence intensity in response to different miR-21 levels within the same cell line, HeLa cells, which were measured to have a moderate level of miR-21-expression by qRT-PCR, were transfected with an expression plasmid encoding for miR-21. A control group was transfected with an empty vector. Cells from both groups were then treated with PNA probes targeting miR-21 following the same incubation protocol as used previously. While the transfection with both, the control vector and miR-21 expression vector, resulted in a higher conversion for the mismatched probes relatively to the untransfected HeLa cells, a clear difference in the intensity of the perfect match probe was observed between the miR-21 expression plasmid transfected cells and the control vector transfected cells (Fig. 6, see Fig. S6† for complete set of images including positive and negative controls as well as mismatched probes and Fig. S7† for raw fluorescent quantification data).
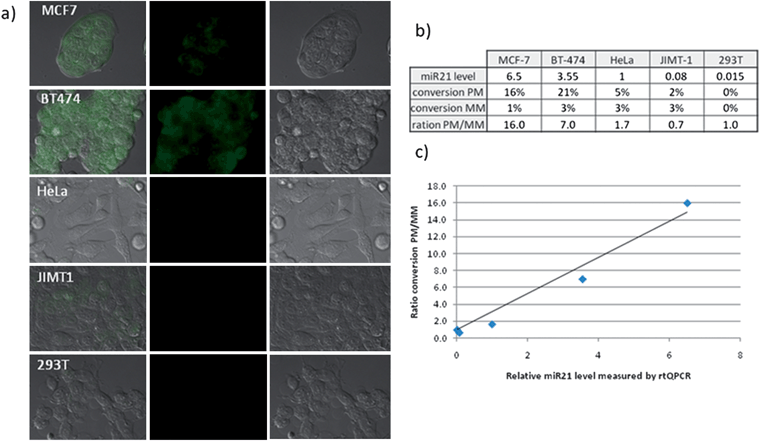 |
| | Fig. 5 Quantification of miR-21 in different cell lines. All experiments were performed as described for Fig. 4. a) From left to right: merged image, fluorescence - Rho110 channel, DIC of different cell lines treated with first 100 nM of bis-azidorhodamine probes followed by the perfect match phosphine probe (see Fig. S1–4† for images of positive and negative controls as well as MM probes). b) Quantification of reaction yield for each cell line (see Fig. S5† for fluorescent quantification data and error bars) and comparison with results obtained by qRT PCR (relative scale where miR-21 expression level in HeLa cells has been taken as 1). c) Plot between the ratio of conversion achieved with matching and mutated PNA-phosphine probeversus miR-21 levels measured by qRT-PCR. | |
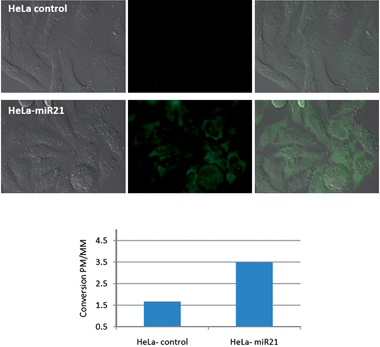 |
| | Fig. 6 Monitoring changes in miR-21 levels in HeLa cells following transfection. Top two rows, from left to right: DIC, fluorescence - Rho110 channel, merged images of HeLa cells transfected with the vector alone (HeLa control) or vector + miR-21 (see SI† for images of positive and negative controls as well as MM probes). The experiments and imaging were performed according to the same conditions as described in Fig. 4; Bottom: Comparison of specific reaction (ratio of conversion between the perfect match (PM) probes and mismatched probes (MM)) for both transfected cell lines – see SI6–7† for all images and fluorescent quantification data with error bars. | |
Imaging miR-31 in cells as additional specifity control
To further establish the reliability of the templated Staudinger reaction to image different miRNAs, detection of miRNA-31 was investigated. MiRNA-31 is also known to be implicated in neoplastic development and metastasis, particularly in cervical cancer.22 Quantification of miR-31 by rtQPCR in MCF-7 cells showed low expression level relatively to HeLa cells (over 100 fold higher expression) as opposed to miR-21 which showed the opposite trend. Probes for the miR-31 templated Staudinger reaction were prepared following the same design as for miR-21: 8 mer azidorhodamine probe and 7 mer phosphines probes (a perfectly matching and a mismatched one) that would hybridize to a template with 3 nucleotides spacing. The probes were tested with a synthetic DNA template to validate the templated reaction showing a high specificity and mismatch sensitivity in analogy to the miR-21detection (greater than 10 fold). When applied to cultured cells perfectly matching probes yielded strong fluorescent signal in HeLa cells (Fig. 7a; see Figure S8† for complete set of images including positive and negative controls) while almost no conversion was observed in MCF-7 cells (Fig. 7a; see Figure S9† for complete set of images including positive and negative controls). It is noteworthy that MCF-7 yielded the most intense signal when treated with miR-21 specific probes. The lack of reaction in this cell line with probes targeting miR-31 correlated with rtQPCR results (Fig. 7b) thus confirming the robustness of templated Staudinger reaction for miRNA imaging.
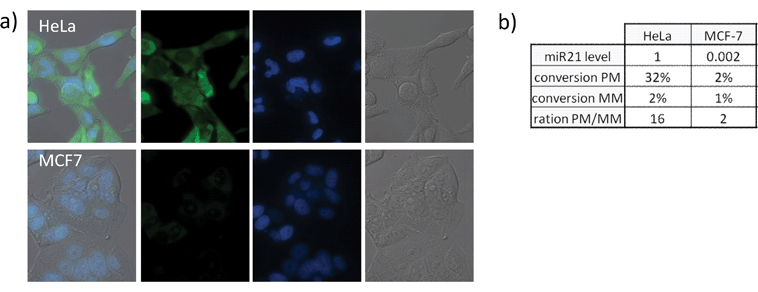 |
| | Fig. 7 Quantification of miR-31 in different cell lines. All experiments were performed as described for Fig. 4 with the following PNAs: (Lys(N3RhN3) C*CG*TA*TC*G; Arg CG*TT*CT*A dmTCEP (PM); Arg CG*TT*AT*A dmTCEP (MM)). a) From left to right: merged image, fluorescence - Rho110 channel, fluorescence - DAPI channel, DIC of different cell lines treated with first 100 nM of bis-azidorhodamine probe followed by the perfect match phosphine probe (see Fig. S8, 9† for images of positive and negative controls as well as MM probes). b) Quantification of reaction yield for each cell line (see Fig. S10† for fluorescent quantification data and error bars) and comparison with results obtained by qRT PCR (relative scale where miR-31 expression level in HeLa cells has been taken as 1). | |
MiR-21 quantification for cells in solution
In situ hybridization methods which allow direct detection of miRNA in cells can only be applied for adherent cells. To the best of our knowledge, there is no method which could be used for direct imaging of miRNAs in suspended cells. We then asked whether the present method based on templated reaction could fulfil this gap. To test this hypothesis we repeated miR-21 visualisation in BT474 cell suspension. Cells were detached with trypsin before addition of PNA probes and performing incubation steps in solution. As was done for the fluorescent microscopy imaging, the cells were separated in four groups and treated with the azidorhodamine probe followed by 1) buffer as a negative control (phosphine omitted) in order to establish the baseline fluorescence; 2) an excess of cell permeable phosphine (tmTCEP) to establish the maximum fluorescence; 3) the perfect match probe; 4) the mismatched probe. Each group was then analysed by flow cytometry to quantify the fluorescence intensity (Fig. 8). Concurring the results obtained by microscopy, a significant shift in fluorescence (6-fold) is observed between the perfect match probes and mismatched probes. Importantly, the suitability of the present miRNA detection method with flow cytometry opens the possibility to use mixed population of cells with differentiating markers for multi-parametric analysis.
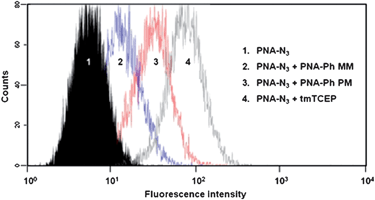 |
| | Fig. 8 MiR-21 detection by flow cytometry in BT474 cell line. MiR-21 expression levels were determined in BT474 cells by flow cytometry. The experiments were carried out according to the same procedure as described in Fig. 4. PBS alone upon PNA-Azide treatment was used as a negative control (1). A cell permeable phosphine (tmTCEP) was used as a positive control to define the maximum fluorescence (4). Cells treated with the perfect match phosphine (PNA-phosphine-PM) show increased fluorescence intensity (3) compared to cells treated with the mismatched probe (PNA-phosphine-MM, 2). Shown is one representative experiment out of three biological replicates. | |
Conclusions
Rapid and simple technologies to assess miRNA expression dynamics are critical to broaden our understanding of the role of these regulators in normal and pathological processes. The results demonstrate that nucleic acid templated reaction can be used to visualize the level of miRNAs in cells with good correlation between fluorescence intensities and miRNA levels. The approach reported relies on bioorthogonal templated Staudinger reaction between two PNA probes which offers a simple readout by fluorescence microscopy or flow cytometry together with a relatively short protocol without the need of extensive washing nor enzymatic amplification. The suitability of the protocols to flow cytometry should enable multi-parametric analysis. The novel bis-azidorhodamine reported herein offer significant advantages in terms of sensitivity relatively to the previously reported azidorhodamine and should be broadly applicable in other contexts.
Experimental
PNA
probes preparation
PNA synthesis was performed in a fully automated fashion in MultiPep RS (Intavis) synthesizer. Standard Fmoc chemistry with HATU as a coupling agent was used (except loading of first residue and dmTCEP coupling where DIC/HOBt activation was used). Loading of NovaPEG (NovaBiochem) Rink amide resin was decreased to 0.2 mmol g−1 by attachment of first residue, Fmoc-Lys(Mtt)-OH or Fmoc-Arg(Pbf)-OH. Azidorhodamine was coupled after selective deprotection of Mtt from side chain of lysine with 50% HFIP in dichloroethane.
Templated reactions
DNA templates were purchased from Eurogentec as desalted 100 μM solutions in deionised water. Black 96-well plates (Nunc) (500 μL/well) were used to perform the templated reactions. Stock PNA and DNA solutions at 10 μM and 1 μM were prepared in deionised water and stored at 4 °C. They were diluted to their final concentrations with buffer containing 10 mM PBS, 154 mM NaCl, 25 mM MgCl2, 0.05% TWEEN 20 (pH = 7,4; equivalent to physiological buffer, prepared as follow: 25 ml of 0,2 M PBS pH = 7.4, 15.4 ml of 5 M NaCl, 25 ml of 1 M MgCl2 and 250 mL mg of TWEEN 20 was added to a 447 ml of deionised water, buffer was filtered through Millipore Express PLUS and stored at 4 °C). First wells were filled with 240 μL of the PNA-dmTCEP solution containing appropriate DNA. After 240 μL of N3-Rh-PNA solutions was added using multichannel pipette and the plate was placed in a fluorometer (SpectraMax GeminiXS, Molecular Devices) pre-heated to 37 °C and the fluorescence readout was recorded immediately. All experiments were performed in duplicates and each individual experiment included a positive control (phosphine-PNA solution was replace with TCEP solution in buffer, final concentration 20 mM), two negative control (no DNA template and random DNA template), and a background florescence measurement (reaction without PNA-dmTCEP). The fluorescence level corresponding to 100% conversion was measured by treating all reactions with large excess of TCEP (final concentration 20 mM). The fluorescence measurements of the templated reactions were performed using 495 nm (excitation) and 525 nm (emission) at 37 °C. The curves shown represent the average of the duplicate measurements.
Cell culture
Cells were cultured in DMEM supplemented with 10% FBS and 1% PenStrep at 37 °C in humidified atmosphere containing 5% CO2. Special media additives: BT-474 (10% NCTC 135 Medium, Invitrogen; 1% non-essential amino acids; 1% L-Glutamine); JIMT-1 (1% L-Glutamine, 0.001% Bovine Insulin); HeLa (1% L-Glutamine).
Effectene transfection
HeLa cells were seeded 24 h before on 35 mm glass bottom dishes (300 000 cells/dish). Then, they were transfected with the miR21 expression plasmid pcDNA-miR-21-long (kindly provided by Dr Sven Diederichs) or with empty vector (pcDNA3.1, Invitrogen) for control (both 0.5 μg/dish), using Effectene reagent (Invitrogen) and following manufacturer protocol. After 24 h medium was removed and fresh portion of medium supplemented with additional 10% FBS was added. Medium refreshment was repeated after 24 h and cells were submitted to standard miRNA imaging protocol 60 h after transfection.
MiRNA imaging in adherent cells
Cells were seeded on 35 mm glass bottom dishes 12 h before the experiment. Then they were washed with PBS and fixed with 3.7% formaldehyde (20′). After washing with PBS (3 × 5′) they were treated with 100 nM PNA-azidorhodamine probe in PBS for 3 h at 37 °C. Then incubation solution was removed, cells were washed with PBS and treated with 200 nM PNA-phosphine (or 1 mM tmTCEP – positive control; PBS alone – negative control) for 1.5 h at 37 °C. Optionally cells were then incubated with 1 μM DAPI for 10 min. After final washing with PBS cells were imaged with 60× oil immersion objective using a Nikon Eclipse Ti inverted fluorescent microscope (for Rho110 FITC filter set: excitation 460–500 nm, emission 510–560 nm, 200 ms exposure time; for DAPI: excitation 325-375 nm, emission 435–485 nm, 50 ms exposure time).
Image analysis
Images were acquired and analysed using NIS Elements Advance Research Software. All images were processed in an identical way. Mean fluorescence intensity of background was subtracted from all images and green channel intensity was doubled. Object selection was done manually or by thresholding and verified using brightfield images. Intensity values presented on plots represent average of quantification of three representative images acquired from different regions of a sample.
MiRNA
purification and qRT-PCR (TaqMan)
Total RNA and miRNA were isolated using the miRNeasy Mini kit (Qiagen) according to the manufacturer's instructions. Reverse transcription of miRNAs was performed using the TaqMan MicroRNA Reverse Transcription kit and the miR-21 and miR-31 TaqMan miRNA assays (Applied Biosystems). For each RT reaction, 4 ng of total RNA were used and mixed with the corresponding TaqMan miRNA assay RT primer. Two additional reactions for RNU44 and RNU48 were performed for each cell line, as housekeeping controls. The RT reactions were performed at the following conditions: 16 °C for 30 min, 42 °C for 30 min and 85 °C for 5 min. The cDNA products were then 1![[thin space (1/6-em)]](https://www.rsc.org/images/entities/char_2009.gif) :
:![[thin space (1/6-em)]](https://www.rsc.org/images/entities/char_2009.gif) 5 diluted and 2μl of the cDNA were used as template for TaqMan reaction along with the corresponding TaqMan 20× assay of each TaqMan miRNA Assay. The TaqMan reaction conditions were: 15 min at 95 °C, followed by 45 cycles of 15 s at 95 °C and 60 s at 60 °C. MiR-21 and miR-31 values were normalized by RNU44 and RNU48 levels.
Cells were seeded in 6-well plates 24 h before the experiment. Cells were trypsinized, washed with PBS and fixed with 3.7% formaldehyde for 20 min at room temperature. After washing with PBS (3 × 5 min), cells were treated with 100 nM PNA-azidorhodamine probe in PBS for 3 h at 37 °C with mild agitation. Incubation solution was removed and cells were washed with PBS. Treatment with 200 nM PNA-phosphine (or 1 mM tmTCEP – positive control; PBS alone – negative control) followed for 1.5 h at 37 °C with mild agitation. After final washing with PBS, cells were resuspended in 300 μl of PBS and fluorescence intensity was measured by flow cytometry.
5 diluted and 2μl of the cDNA were used as template for TaqMan reaction along with the corresponding TaqMan 20× assay of each TaqMan miRNA Assay. The TaqMan reaction conditions were: 15 min at 95 °C, followed by 45 cycles of 15 s at 95 °C and 60 s at 60 °C. MiR-21 and miR-31 values were normalized by RNU44 and RNU48 levels.
Cells were seeded in 6-well plates 24 h before the experiment. Cells were trypsinized, washed with PBS and fixed with 3.7% formaldehyde for 20 min at room temperature. After washing with PBS (3 × 5 min), cells were treated with 100 nM PNA-azidorhodamine probe in PBS for 3 h at 37 °C with mild agitation. Incubation solution was removed and cells were washed with PBS. Treatment with 200 nM PNA-phosphine (or 1 mM tmTCEP – positive control; PBS alone – negative control) followed for 1.5 h at 37 °C with mild agitation. After final washing with PBS, cells were resuspended in 300 μl of PBS and fluorescence intensity was measured by flow cytometry.
Acknowledgements
This work was supported by a grant from the European Research Council (ERC 201749). The Institut Universitaire de France (IUF) is gratefully acknowledged for its support. A fellowship Boehringer Ingelheim Fonds (to K.G.) is gratefully acknowledged. In addition, this work was supported by the National Genome Research Network (grants 01GS0864 and 01GS0816) of the German Federal Ministry of Education and Research (BMBF). We thank Dr Sven Diederichs for kindly providing the pcDNA-miR-21-long plasmid.
Notes and references
- S. Tyagi, Nat. Methods, 2009, 6, 331–338 CrossRef CAS; S. Tyagi and F. R. Kramer, Nat. Biotechnol., 1996, 14, 303–308 CrossRef.
- R. H. Singer and D. C. Ward, Proc. Natl. Acad. Sci. U. S. A., 1982, 79, 7331–7335 CrossRef CAS; H. J. Tanke, R. W. Dirks and T. Raap, Curr. Opin. Biotechnol., 2005, 16, 49–54 CrossRef.
- A. P. Silverman and E. T. Kool, Chem. Rev., 2006, 106, 3775–3789 CrossRef CAS; H. Abe and E. T. Kool, Proc. Natl. Acad. Sci. U. S. A., 2006, 103, 263–268 CrossRef.
- Z. Pianowski, K. Gorska, L. Oswald, C. A. Merten and N. Winssinger, J. Am. Chem. Soc., 2009, 131, 6492–6497 CrossRef CAS.
- R. M. Franzini and E. T. Kool, J. Am. Chem. Soc., 2009, 131, 16021–16023 CrossRef CAS; K. Furukawa, H. Abe, K. Hibino, Y. Sako, S. Tsuneda and Y. Ito, Bioconjugate Chem., 2009, 20, 1026–1036 CrossRef.
- T. N. Grossmann, A. Strohbach and O. Seitz, ChemBioChem, 2008, 9, 2185–2192 CrossRef CAS.
- J. Winter, S. Jung, S. Keller, R. I. Gregory and S. Diederichs, Nat. Cell Biol., 2009, 11, 228–234 CrossRef CAS.
- L. J. Chin, E. Ratner, S. Leng, R. Zhai, S. Nallur, I. Babar, R. U. Muller, E. Straka, L. Su, E. A. Burki, R. E. Crowell, R. Patel, T. Kulkarni, R. Homer, D. Zelterman, K. K. Kidd, Y. Zhu, D. C. Christiani, S. A. Belinsky, F. J. Slack and J. B. Weidhaas, Cancer Res., 2008, 68, 8535–8540 CrossRef CAS; A. Esquela-Kerscher and F. J. Slack, Nat. Rev. Cancer, 2006, 6, 259–269 CrossRef.
- C. Jay, J. Nemunaitis, P. Chen, P. Fulgham and A. W. Tong, DNA Cell Biol., 2007, 26, 293–300 CrossRef CAS.
- J. T. G. Pena, C. Sohn-Lee, S. H. Rouhanifard, J. Ludwig, M. Hafner, A. Mihailovic, C. Lim, D. Holoch, P. Berninger, M. Zavolan and T. Tuschl, Nat. Methods, 2009, 6, 139 CrossRef CAS.
- A. M. Femino, F. S. Fay, K. Fogarty and R. H. Singer, Science, 1998, 280, 585–590 CrossRef CAS.
- J. C. R. Politz, F. Zhang and T. Pederson, Proc. Natl. Acad. Sci. U. S. A., 2006, 103, 18957 CrossRef CAS.
- For nucleic acid sensing systems, see: Z. L. Pianowski and N. Winssinger, Chem. Commun., 2007, 3820–3822 RSC; K. Gorska, A. Manicardi, S. Barluenga and N. Winssinger, Chem. Commun., 2011, 47, 4364–67 RSC.
- For other examples of templated Staudinger reaction, see: J. F. Cai, X. X. Li, X. Yue and J. S. Taylor, J. Am. Chem. Soc., 2004, 126, 16324–16325 CrossRef CAS . For examples of templated Staudinger reaction using DNA probes, see: K. Furukawa, H. Abe, J. Wang, M. Uda, H. Koshino, S. Tsuneda and Y. Ito, Org. Biomol. Chem., 2009, 7, 671–677 Search PubMed; R. M. Franzini and E. T. Kool, Chem.–Eur. J., 2011, 17, 2168–2175 CrossRef ; and ref. 5. For recent reports of alternative methods for nucleic acid sensing based on PNA, see: D. Arian, E. Clo, K. V. Gothelf and A. Mokhir, Chem.–Eur. J., 2010, 16, 288–295 CrossRef; S. Kummer, A. Knoll, E. Socher, L. Bethge, A. Herrmann and O. Seitz, Angew. Chem., Int. Ed., 2011, 50, 1931–1934 CrossRef.
- P. E. Nielsen, Mol. Biotechnol., 2004, 26, 233–248 CrossRef CAS; M. Egholm, O. Buchardt, L. Christensen, C. Behrens, S. M. Freier, D. A. Driver, R. H. Berg, S. K. Kim, B. Norden and P. E. Nielsen, Nature, 1993, 365, 566–568 CrossRef.
- P. Zhou, A. Dragulescu-Andrasi, B. Bhattacharya, H. O'Keefe, P. Vatta, J. J. Hyldig-Nielsen and D. H. Ly, Bioorg. Med. Chem. Lett., 2006, 16, 4931–4935 CrossRef CAS; P. Zhou, M. Wang, L. Du, G. W. Fisher, A. Waggoner and D. H. Ly, J. Am. Chem. Soc., 2003, 125, 6878–6879 CrossRef; A. Dragulescu-Andrasi, P. Zhou, G. He and D. H. Ly, Chem. Commun., 2005, 244–246 RSC; A. Dragulescu-Andrasi, S. Rapireddy, G. He, B. Bhattacharya, J. J. Hyldig-Nielsen, G. Zon and D. H. Ly, J. Am. Chem. Soc., 2006, 128, 16104–16112 CrossRef.
- S. Volinia, G. A. Calin, C. G. Liu, S. Ambs, A. Cimmino, F. Petrocca, R. Visone, M. Iorio, C. Roldo, M. Ferracin, R. L. Prueitt, N. Yanaihara, G. Lanza, A. Scarpa, A. Vecchione, M. Negrini, C. C. Harris and C. M. Croce, Proc. Natl. Acad. Sci. U. S. A., 2006, 103, 2257–2261 CrossRef CAS.
- T. Papagiannakopoulos, A. Shapiro and K. S. Kosik, Cancer Res., 2008, 68, 8164–8172 CrossRef CAS.
- M. F. Corsten, R. Miranda, R. Kasmieh, A. M. Krichevsky, R. Weissleder and K. Shah, Cancer Res., 2007, 67, 8994–9000 CrossRef CAS.
- M. L. Si, S. Zhu, H. Wu, Z. Lu, F. Wu and Y. Y. Mo, Oncogene, 2007, 26, 2799–2803 CrossRef CAS.
- B. Sahu, V. Chenna, K. L. Lathrop, S. M. Thomas, G. Zon, K. J. Livak and D. H. Ly, J. Org. Chem., 2009, 74, 1509–1516 CrossRef CAS.
- S. Valastyan and R. A. Weinberg, Cell Cycle, 2010, 9, 2124–2129 CrossRef CAS; E. J. Lee, M. Baek, Y. Gusev, D. Brackett, G. J. Nuovo and T. D. Schmittgen, RNA, 2008, 14, 35–42 CrossRef.
Footnote |
| † Electronic supplementary information (ESI) available: Complete set of images used to calculate conversion, full quantification data with standard deviation for the cell lines, experimental procedures and characterization of bis-azidorhodamine as well as PNA probes. See DOI: 10.1039/c1sc00216c |
|
| This journal is © The Royal Society of Chemistry 2011 |
Click here to see how this site uses Cookies. View our privacy policy here. 


![[thin space (1/6-em)]](https://www.rsc.org/images/entities/char_2009.gif) :
:![[thin space (1/6-em)]](https://www.rsc.org/images/entities/char_2009.gif) 5 diluted and 2μl of the cDNA were used as template for TaqMan reaction along with the corresponding TaqMan 20× assay of each TaqMan miRNA Assay. The TaqMan reaction conditions were: 15 min at 95 °C, followed by 45 cycles of 15 s at 95 °C and 60 s at 60 °C. MiR-21 and miR-31 values were normalized by RNU44 and RNU48 levels.
5 diluted and 2μl of the cDNA were used as template for TaqMan reaction along with the corresponding TaqMan 20× assay of each TaqMan miRNA Assay. The TaqMan reaction conditions were: 15 min at 95 °C, followed by 45 cycles of 15 s at 95 °C and 60 s at 60 °C. MiR-21 and miR-31 values were normalized by RNU44 and RNU48 levels.
