Electrocatalytic reaction of hydrogen peroxide and NADH based on poly(neutral red) and FAD hybrid film†
Kuo Chiang
Lin
,
Yu Ching
Lin
and
Shen Ming
Chen
*
Electroanalysis and Bioelectrochemistry Lab, Department of Chemical Engineering and Biotechnology, National Taipei University of Technology, No.1, Section 3, Chung-Hsiao East Road, Taipei 106, Taiwan. E-mail: smchen78@ms15.hinet.net; Fax: (+886)-2-27025238; Tel: (+886)-2-27017147
First published on 2nd November 2011
Abstract
A simple method to immobilize poly(neutral red) (PNR) and flavin adenine dinucleotide (FAD) hybrid film (PNR/FAD) by cyclic voltammetry is proposed. The PNR/FAD hybrid film can be easily prepared on an electrode surface involving electropolymerization of neutral red (NR) monomers and the electrostatic interaction between the positively charged PNR and the negatively charged FAD. It exhibits electroactive, stable, surface-confined, pH-dependent, nano-sized, and compatible properties. It provides good electrocatalytic properties to various species. It shows a sensitivity of 5.4 μA mM−1 cm−2 and 21.5 μA mM−1 cm−2 for hydrogen peroxide (H2O2) and nicotinamide adenine dinucleotide (NADH) with the linear range of 0.1 μM–39 mM and 5 × 10⁻⁵ to 2.5 × 10⁻⁴ M, respectively. It shows another linear range of 48.8–355.5 mM with the sensitivity of 12.3 μA mM−1 cm−2 for H2O2. In particular, the PNR/FAD hybrid film has potential to replace some hemoproteins to be a cathode of biofuel cells and provide the biosensing system for glucose and ethanol.
1. Introduction
The detection of hydrogen peroxide (H2O2) has become extremely important because of its wide and varied applications. As a well-known oxidizing agent, H2O2 is employed in textiles, cleaning products, organic compounds, the food industry, and for environmental treatments.1–3 Several analytical methods have been developed to detect and quantify H2O2, including spectrometry,4,5titrimetry,6 chemiluminescence,7–9 and electrochemistry.10–12 Among these, electrochemical methods have emerged as preferable due to their relatively low cost, high efficiency, high sensitivity, and ease of operation.Horseradish peroxidase, cytochrome C, hemoglobin, and myoglobin have been widely used to construct various amperometric biosensors for H2O2 detection due to their high sensitivity and selectivity.13–18 However, there are several disadvantages of the enzyme-modified electrodes, such as instability, high cost of enzymes and complicated immobilization procedure. The activity of enzymes can be easily affected by temperature, pH value, and toxic chemicals. In order to solve these problems, considerable attention has been paid to develop non-enzymatic electrodes, for instance, noble metals, metal alloys, and metal nanoparticles.19–21 However, these kinds of electrodes have displayed the drawbacks of low sensitivity, poor selectivity and high cost. Therefore, the development of a cheap and highly sensitive catalyst for non-enzymatic H2O2 detection (without HRP) is still in great demand.
Some kinds of organic compounds with π-conjugated structures, such as redox dyes, are also employed in the construction of mediated amperometric biosensors. Due to the conjugative parent ring structure, interest in conjugated polymers containing azine ring structure has been sparked by the promise of a new group of conducting polymers. Several redox dyes including methylene blue, brilliant cresyl blue and thionine have been used for the modification of electrode surfaces, since they possess stable redox-active properties.22–24 Neutral red (NR) a phenazine redox dye, with an amino group located on the heteroaromatic phenazine ring, makes it amenable to facilitate electropolymerization.25 Poly(neutral red) (PNR) pertains to a new kind of electroactive polymers derived from the neutral red monomers. Their polymerization takes place by the oxidation of the monomer cation to form a radical species that initiates the process.26 The electrocatalytic and the electro-oxidative behavior of electrodes modified with PNR have also been described.27 Spectroscopic studies proved that PNR films retain the phenazine ring structure which is supposed to be responsible for the electrochemical properties of the films.28
Flavin adenine dinucleotide (FAD) is a flavoprotein coenzyme that plays an important biological role in many oxidoreductases and in reversible redox conversions in biochemical reactions. It consists of the nucleotide adenine, the sugar ribose, and two phosphate groups. FAD and FADH2 have an isoalloxazine ring as the redox-active component that readily accepts and donates electrons. This makes it ideally suited to be an intermediate that is cyclically reduced and then re-oxidized by the metabolic reactions. The adsorption of FAD has been studied on the Hg electrode,29 on the surface of titanium electrodes,30 and its electrochemical properties have been determined.31 The electrocatalytic reduction for H2O2 was found while a FAD-modified zinc oxide self-assembly film was studied in the absence/presence of hemoglobin.32 Recently, the FAD-based enzyme was also applied in biofuel cells.33–35Electron transfer mediators shuttling electrons between the enzyme active centers and electrodes are usually needed for the efficient electron transport of FAD dependent oxidases (e.g., glucose oxidase, GOx),36NAD(P)+-dependent dehydrogenases require the soluble NAD(P)+ cofactor and an electrode catalytically active for the oxidation of NAD(P)H and regeneration of NAD(P)+ to establish an electrical contact with the electrode. The FAD-based biofuel cell was also expected to improve the stability of the biofuel cell for long-term operation of genetically engineered FAD-based enzyme.37 It is worthy to further investigate the electrocatalytic reduction of H2O2 with FAD and its hybrid composite.
In this work, we report a simple method to construct and characterize the PNR/FAD composite. The electrocatalytic properties of this composite were investigated with H2O2, O2, NaClO, and NADH in neutral conditions was well as KBrO3 and KIO3 in acidic conditions. The preparation of electro-active PNR and FAD arranged on an electrode surface was discussed by electro-codeposition. This hybrid composite was characterized by cyclic voltammetry, scanning electron microscopy, atomic force microscopy, and UV-Visible spectroscopy. The applicability of this composite in a biosensing system and biofuel cell was also discussed.
2. Experimental
2.1 Materials and apparatus
Hydrogen peroxide (H2O2), flavin adenine dinucleotide (FAD), neutral red (NR), potassium chlorate (KClO3), potassium bromate (KBrO3), potassium iodate (KIO3), sodium hypochlorite (NaClO), nicotinamide adenine dinucleotide (NADH), were purchased from Sigma-Aldrich (USA). All other chemicals (Merck) used were of analytical grade (99%). Double-distilled deionized water was used to prepare all the solutions. A phosphate buffer solution (PBS) of pH 7 was prepared using Na2HPO4 (0.05 mol L−1) and NaH2PO4 (0.05 mol L−1).All electrochemical experiments were performed using CHI 1205a potentiostats (CH Instruments, USA). A three-electrode system, which was composed of an Ag/AgCl (KCl saturated) electrode as the reference electrode, a platinum foil counter electrode, and a bare glassy carbon electrode (GCE) or modified GCE as a working electrode, was used. The BAS (Bioanalytical Systems, Inc., USA) GCE with a diameter of 0.3 cm was used for all electrochemical experiments except for the amperometric experiments (which used the GCE with a diameter of 0.6 cm). All potentials in this paper were measured and reported versusAg/AgCl. The buffer solution was entirely altered by deaerating using nitrogen gas atmosphere. The electrochemical cells were kept properly sealed to avoid oxygen interference from the atmosphere. The morphological characterization of composite films was examined by means of SEM (S-3000H, Hitachi) and AFM images were recorded with a multimode scanning probe microscope (Being Nano-Instruments CSPM-4000, China). UV-Vis spectra were measured using a Hitachi model U-3300 spectrophotometer. Indium tin oxide (ITO) glass was used as the substrate for different films for UV-Vis spectroscopy, SEM, and AFM analysis.
2.2 Preparation of PNR/FAD modified electrode
Prior to the experiments, the GCE was polished with 0.05 μm alumina powder and ultrasonically cleaned in double-distilled deionized water. When preparing the PNR/FAD hybrid film, the cleaned GCE was immersed in 0.1 M PBS (pH 7) containing 2.5 × 10⁻⁵ M NR and 5 × 10⁻⁵ M FAD. The PNR was firstly formed on electrode surface due to NR electropolymerization (−0.85 ∼ +0.85 V, 0.1 V s−1). Then, FAD was co-deposited on the PNR electrode surface by the electrostatic interaction between the positive PNR and the negative FAD. Finally, the PNR/FAD film modified electrode was prepared and used in the work.3. Results and discussion
3.1 Cyclic voltammogram of poly(neutral red) and FAD film formation
Poly(neutral red) and FAD hybrid film can be prepared on electrode surface using glassy carbon electrode in neutral aqueous solution. The hybrid film is abbreviated as PNR/FAD for convenience. Fig. 1 shows the cyclic voltammograms of the (a) PNR/FAD and (b) FAD in 0.1 M PBS (pH 7). Curve 1a is the continuous cyclic voltammogram of PNR/FAD co-deposition using GCE controlled in the potential range of −0.85 ∼ +0.85 V, with a scan rate of 0.1 V s−1, and 30 scan cycles. Considering the electrochemical process, there are two anodic peaks at −0.55 V and − 0.39 V and two cathodic peaks at −0.59 V and − 0.45 V for the first cycle (curve a). The anodic peak at ca. 0.68 V corresponds to the formation of the radical cation dye. The anodic peak current at about 0.06 V and the corresponding cathodic peak current at ca. 0.02 V increase with the number of potential cycles, indicating a successive increase in the amount of the poly(neutral red) film. Therefore, three redox couples are found at the formal potential of E10′ = 0.025 V, E20′ = −0.43 V, and E30′ = −0.559 V in the cyclic voltammogram (curve a) of PNR/FAD formation. The redox couple 2 can be recognized by the FAD voltammogram (curve 1b). Compared with the previous reference, the redox couple 1 and 3 (E10′ = 0.025 V and E30′ = −0.559 V) can be also confirmed by the well known poly(neutral red) and neutral red monomer,26 respectively. Based on the mechanism of NR electropolymerization,38 the relatively negative redox peaks (Epa3, Epc3) can be assigned to NR monomer redox peaks similar to previous results (NR redox peaks, Om and Rm).39 The oligomer appeared was ascribed to radical-cations produced by the electro-initiation. Then the radical-cation lost a hydrogen ion to generate a radical, and the latter reacted with each other to form an oligomer that could be more easily oxidized at a lower potential. A radical-cation generation required higher potential, so the new peaks did not appear on the electrode in the potential range of +0.4 to −0.85 V. Curve 1a displays the obvious current development of these redox peaks after scanning to the positive potential at +0.85 V. The redox couple 1 (E10′ = 0.025 V) did not appear in the first scan segment (+0.4 V to −0.85 V). This is because the potential is not positive enough to electro-oxidize the NR monomer to generate PNR redox peaks (Epa1, Epc1). With enough positive potential (+0.85 V), the positive redox peaks (Epa1 and Epc1) conformed to the redox reaction of the oligomer.39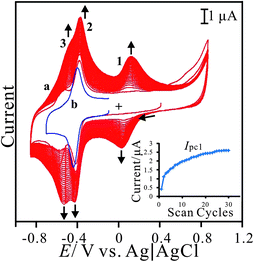 | ||
| Fig. 1 (a) Repeated cyclic voltammograms of PNR/FAD electro-codeposition using GCE in 0.1 M PBS (pH 7) containing 2.5 × 10⁻⁵ M NR and 5 × 10⁻⁵ M FAD. (b) Cyclic voltammogram of 5 × 10⁻⁵ M FAD in 0.1 M PBS (pH 7) using bare GCE, scan rate = 0.1 V s−1. Inset shows the plot of the current of cathodic peak 1 versus scan cycles. | ||
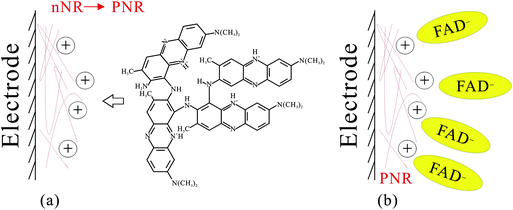
Additionally, the redox couple 2 (with formal potential, E20′ = −0.43 V) is known for the FAD redox couple32,40 which is also similar to curve 1b (the redox couple of FAD in 0.1 M PBS). Although FAD cannot be electropolymerized on the electrode surface, using our method FAD can be further immobilized by the electrostatic interaction between the negative charge of the phosphate of FAD and the positive charge of PNR which had been formed on the electrode surface. It was concluded that the hybrid film was prepared by the electropolymerization of neutral red and the electrostatic interaction between FAD and PNR. This procedure resulted in PNR/FAD co-immobilization on the electrode surface.
3.2 Characterization of poly(neutral red) and FAD hybrid film
The electrochemical properties of the PNR/FAD modified electrode were studied by cyclic voltammetry. Fig. 2 shows the cyclic voltammograms of PNR/FAD/GCE obtained with various scan rates in 0.1 M PBS (pH 7). The electrochemical response of PNR/FAD exhibited redox peaks, which can be attributed to the electron transformation between PNR and FAD in the hybrid film. The influence of the PNR/FAD redox peaks at different scan rates was investigated with the linear correlation (as shown in the inset of Fig. 2A).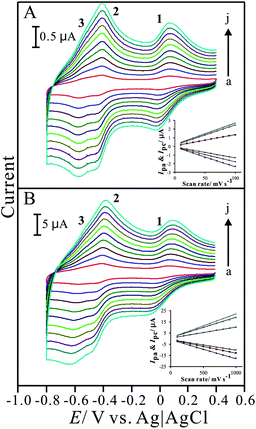 | ||
| Fig. 2 Cyclic voltammograms of PNR/FAD/GCE examined in 0.1 M PBS (pH 7) with different scan rates of (A) low scan rate: (a) 0.01, (b) 0.02, (c) 0.03, (d) 0.04, (e) 0.05, (f) 0.06, (g) 0.07, (h) 0.08, (i) 0.09, and (j) 0.1 V s−1; and (B) high scan rate: (a) 0. 1, (b) 0.2, (c) 0.3, (d) 0.4, (e) 0.5, (f) 0.6, (g) 0.7, (h) 0.8, (i) 0.9, and (j) 1 V s−1, respectively. Insets show the plot of anodic and cathodic peak current (Ipa and Ipc) vs. scan rate. | ||
In the scan rates of 10–100 mV s−1, the cathodic and anodic peak currents are both proportional to the scan rate (peak 1 is used to study), implying that the electrochemical kinetics is a surface-controlled process. As can be known from the CVs (Fig. 2A and 2B), the electrochemical behaviour of the PNR/FAD/GCE, including both the peak current (Ip) and the peak separation (ΔEp) was enhanced with the increase of scan rate. The peak current of redox couples is directly proportional to scan rates up to 1000 mV s−1 (insets of Fig. 2A and 2B) as expected for a surface-confined process. The anodic peak current and scan rate can be expressed as:
Anodic peak 1:
| Ipa1 = −0.0102v − 0.3318 (R2 = 0.9928) | (1) |
Anodic peak 2:
| Ipa2 = −0.0128v − 0.4192 (R2 = 0.9971) | (2) |
Anodic peak 3:
| Ipa3 = −0.0178v − 0.4792 (R2 = 0.9973) | (3) |
For a surface process, according to Laviron's equation,41Ip = n2F2vAΓ/4RT, and the slope of the Ip–v curve, the surface coverage (Γ) of PNR and FAD were estimated. Under the condition of 30 cycles assuming a flat surface, they were estimated as about 5.3 × 10⁻¹¹ mol cm−2 and 4.9 × 10⁻¹¹ mol cm−2 for PNR and FAD, respectively. It means that almost the same amount of PNR and FAD cover on the electrode surface was present.
From the slopes of above expressed equations, all of them are a linear correlation between the current and scan rate. This means a diffusion-less control. Moreover, the ratio of oxidation-to-reduction peak current is nearly unity and formal potential is not changed with increasing scan rate under this pH condition. The result shows that the PNR/FAD film is both stable and electrochemically active in neutral aqueous buffer solution.
Fig. 3 displays the pH-dependent voltammograms of the PNR/FAD modified electrode. In order to ascertain this, the voltammetric responses of PNR/FAD/GCE were obtained in the solutions of pH 1–13. As can be seen in Fig. 3, three redox couples are pH-dependent and their formal potential (E0′) are shifted negatively as increasing pH values. This means that the film is stable in pH 1–13. The inset of Fig. 3 shows the formal potential (E10′, E20′, and E30′) plotted over a pH range of 1–13. For convenience, E10′, E20′, and E30′ are marked by the order from the relatively positive to the relatively negative potential.
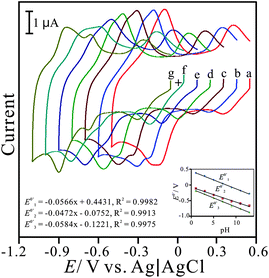 | ||
| Fig. 3 Cyclic voltammograms of PNR/FAD/GCE examined in various pH conditions of: (a) pH 1, (b) pH 3, (c) pH 5, (d) pH 7, (e) pH 9, (f) pH 11, and (g) pH 13, respectively, scan rate = 0.1 V s−1. Inset: the plot of formal potential of PNR/FAD/GCE vs. pH (E10′, E20′, and E30′ represent formal potential of three redox couples marked from positive to negative potential). | ||
The PNR redox couples (with a formal potential of E10′ and E30′) exhibit the significant slopes of −56.6 mV pH−1 and −58.4 mV pH−1 (for redox couple 1 and redox couple 3), respectively. The FAD redox couple (E20′) is also found to be pH-dependent with a slope of −47.2 mV pH−1 with the increase of pH value. These slopes are close to that given by the Nernstian equation, for two electrons and two protons involved in the redox reaction. In this case, two electrons and two protons were involved in the PNR redox couple,38 whereas two electrons and two protons were involved in the FAD redox couple.40Scheme 1 and 2 represent the reduction and oxidation states for neutral red and FAD, respectively.
 | ||
| Scheme 1 The redox reaction of neutral red. | ||
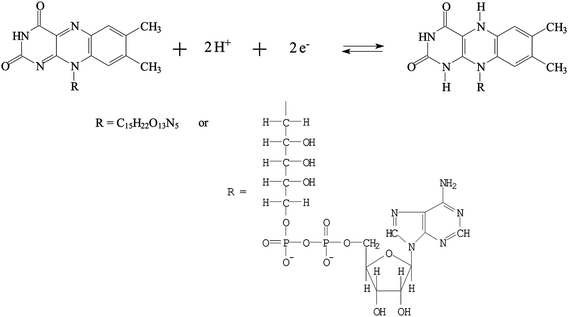 | ||
| Scheme 2 The redox reaction of FAD. | ||
3.3 SEM and AFM images analysis of poly(neutral red) and FAD hybrid film
Scanning electron microscopy (SEM) and atomic force microscopy (AFM) were utilized to study the morphology of the active surface of the electrodeposited PNR films with/without FAD, and compared with the bare GCE or ITO, as shown in Fig. 4.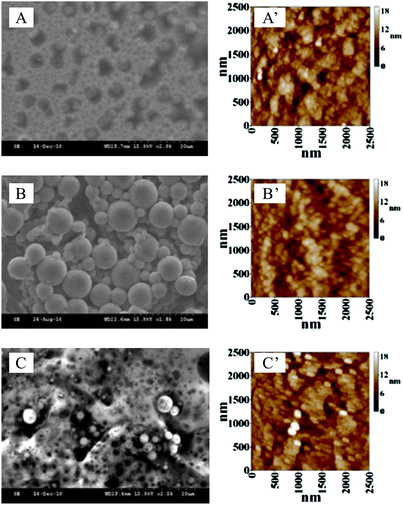 | ||
| Fig. 4 SEM images of (A) PNR/ITO, (B) FAD/ITO, and (C) PNR/FAD/ITO; tapping mode AFM images of (A′) PNR/ITO, (B′) FAD/ITO, and (C′) PNR/FAD/ITO. | ||
In contrast with the SEM images (Fig. 4A–C) of PNR, FAD, and PNR/FAD film modified ITO electrodes, they exhibit significant morphology. The PNR (prepared by electropolymerization) has a unique porous structure which might be due to the interlocking and stacking of PNR polymer chains. FAD (prepared by adsorption) exhibits globular structure might be due to the aggregation of FAD molecules. In particular, the PNR/FAD (co-immobilized by electro-codeposition) shows a much more compact and uniform structure than both PNR and FAD. It looks like the cavities of the porous PNR structure were occupied by the globular FAD structure.
These film modified electrodes were further studied on the microscale by AFM. The AFM images (Fig. 4A′–C′) of these films were found to have a morphology similar to their relevant SEM images. Average diameters of these composites were found with 36.58 nm, 33.37 nm, and 38.98 nm for PNR, FAD, and PNR/FAD, respectively. From an average height estimation, they were found to be 10.7 nm, 21.1 nm, and 13.9 nm in the same order. They have a similar particle size (average diameter). In particular, the average height of PNR/FAD is found to be between PNR and FAD. This means that PNR/FAD is formed more compactly and might be due to the film formation process with the porous and positive-charge PNR structure filling up with the negative-charge FAD. One can conclude that the PNR/FAD film forms compactly through the electrostatic interaction between the electropolymerized PNR (positive charge) and FAD (negative charge) during the electro-codeposition.
Here we proposed the mechanism of PNR/FAD formation as Scheme 3. By electropolymerization of neutral red monomers, dimers form first and lead to a PNR polymer chain on the electrode surface (as shown in Scheme 3a). The formed PNR would have a positive charge and attract the negatively charged FAD in the solution (as shown in Scheme 3b). Based on the result of PNR/FAD surface coverage and the morphology, the negative FAD might be the dopant anion entering the film to form the compact structure.
3.4 UV-Visible spectra analysis
The experiment was designed to understand the spectra of these materials in the solution or coated on ITO by UV-Visible spectroscopy. Fig. 5A shows the spectra of these materials dissolved in 0.1 M PBS (pH 7). Curve a shows the baseline of buffer solution in Fig. 5A. Two main absorption peaks are found at 466 nm and 532 nm in curve b resulting from the NR monomer solution. The maximal absorption at λmax = 532 nm reveals the neutral red monomer reported by Schlereth and Karyakin.26 The FAD spectrum (curve c) shows absorption peaks at 382 nm and 455 nm, similar to the result of previous work.40 Curve d shows the addition of NR spectra and FAD spectra without new peaks. Moreover, the main absorption peaks (at 466 nm and 562 nm) were found to be similar to the previous spectra of NR in pH 7.5 aqueous solution.40 This means that the addition of FAD slightly affects the pH condition (from pH 7 to 7.5) so that NR turned to the basic form. One can conclude that no other interaction occurs when mixing NR and FAD in neutral solution.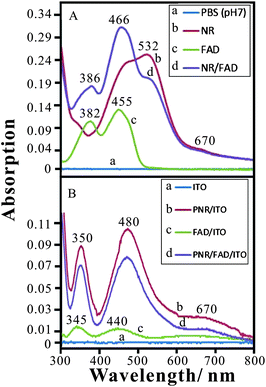 | ||
| Fig. 5 (A) Absorption spectra of (a) baseline (0.1 M PBS, pH 7), (b) 2.5 × 10⁻⁵ M NR, (c) 5 × 10⁻⁵ M FAD, and (d) 2.5 × 10⁻⁵ M NR + 5 × 10⁻⁵ M FAD in 0.1 M PBS (pH 7) using quartz cell, path length = 1 cm. (B) Absorption spectra of (a) baseline (ITO), (b) PNR/ITO, (c) FAD/ITO, and (d) PNR/FAD/ITO. | ||
Considering these materials prepared on ITO, Fig. 5B shows the UV-Vis spectra of (a) ITO (baseline), (b) PNR/ITO, (c) FAD/ITO, and (d) PNR/FAD/ITO, respectively. The absorption peaks are different from those in aqueous solution. In the spectra of these modified ITO films, PNR/ITO exhibits absorption peaks at 350 nm, 480 nm, and 670 nm while FAD/ITO exhibits adsorption peaks at 345 nm, 440 nm, and 670 nm. The PNR/FAD/ITO shows absorption peaks similar to that of PNR/ITO. One may conclude that the PNR/FAD hybrid film maintains the structures of PNR and FAD. However, it is noticed that the absorption peak height is lower than that of PNR/ITO. This is caused by the different PNR deposition amount between the electro-codeposition of PNR/FAD and the electropolymerization of PNR. Finally, one can conclude that there is no other chemical reaction between FAD and NR in both the neutral solution and the electro-codeposition. The PNR/FAD film can be stably immobilized on the electrode surface.
3.5 Electrocatalytic properties of poly(neutral red) and FAD hybrid film
The electrocatalytic reduction of hydrogen peroxide, oxygen, hypochlorite, chlorate, bromate, and iodate was investigated with the PNR/FAD hybrid film in different pH conditions. The redox process of this film can be expressed as in the following equations:| PNR(oxidized form)/FAD + 2H+ + 2e− → PNR(reduced form)/FAD | (4) |
| PNR(oxidized form)/FAD + 2H+ + 2e− → PNR(oxidized form)/FADH2 | (5) |
| PNR(oxidized form)/FAD + 4H+ + 4e− → PNR(reduced form)/FADH2 | (6) |
At pH 7 (0.1 M PBS), Fig. 6A–C displays the voltammetric responses for hydrogen peroxide, oxygen, and hypochlorite, respectively. In the presence of hydrogen peroxide, Fig. 6A shows the voltammogram of PNR/FAD with two electrocatalytic peaks at −0.42 V and −0.55 V. The electrocatalytic reaction can be expressed as the following equation:
| PNR(reduced form)/FADH2 + 2H2O2 → PNR(oxidized form)/FAD + 4H2O | (7) |
Compared with the bare GCE electrode (curve a′), this film modified electrode shows unique electrocatalytic peaks of these species. It means that the PNR/FAD hybrid film can effectively lower the over-potential and enhance the electrocatalytic current. As a result, the PNR/FAD hybrid film can be a good choice to detect hydrogen peroxide. This hybrid composite can be used as a substitute for HRP and those hemoproteins to catalyze the reduction of H2O2. By application of PNR/FAD, it is easier and probably without generation of interfering signal from some hemoproteins interfering materials. Based on the reduction property of this FAD-based composite, it also has the potential to replace some hemoproteins33 to be a cathode of biofuel cells.34,35
![Cyclic voltammograms of PNR/FAD/GCE examined in 0.1 M PBS (pH 7) or 0.1 M KHP (pH 4) in the presence of: (A) [H2O2] = (a) 0 M, (b) 2 × 10⁻² M, (c) 4 × 10⁻² M, (d) 6 × 10⁻² M, (e) 8 × 10⁻² M, and (f) 1 × 10⁻¹ M; (B) [O2] = (a) 0 mg L−1 (0%), (b) 0.8 mg L−1 (10%), (c) 1.6 mg L−1 (20%), and (d) 2.4 mg L−1 (30%); (C) [NaClO] = (a) 0 M, (b) 4 × 10⁻³ M, (c) 8 × 10⁻³ M, (d) 1.2 × 10⁻² M, (e) 1.6 × 10⁻² M, and (f) 2 × 10⁻² M; (D) [KClO3] = (a) 0 M, (b) 9 × 10⁻³ M, (c) 1.8 × 10⁻² M, (d) 2.7 × 10⁻² M, (e) 3.6 × 10⁻² M, and (f) 4.5 × 10⁻² M; (E) [KBrO3] = (a) 0 M, (b) 1.5 × 10⁻² M, (c) 3 × 10⁻² M, and (d) 4.5 × 10⁻² M; (F) [KIO3] = (a) 0 M, (b) 1 × 10⁻² M, (c) 2 × 10⁻² M, and (d) 3 × 10⁻² M, respectively; (a′) is the cyclic voltammogram of the bare GCE examined in the maximal concentration of reactants in each case (A–F), scan rate = 0.1 V s−1.](/image/article/2012/AN/c1an15739f/c1an15739f-f6.gif) | ||
| Fig. 6 Cyclic voltammograms of PNR/FAD/GCE examined in 0.1 M PBS (pH 7) or 0.1 M KHP (pH 4) in the presence of: (A) [H2O2] = (a) 0 M, (b) 2 × 10⁻² M, (c) 4 × 10⁻² M, (d) 6 × 10⁻² M, (e) 8 × 10⁻² M, and (f) 1 × 10⁻¹ M; (B) [O2] = (a) 0 mg L−1 (0%), (b) 0.8 mg L−1 (10%), (c) 1.6 mg L−1 (20%), and (d) 2.4 mg L−1 (30%); (C) [NaClO] = (a) 0 M, (b) 4 × 10⁻³ M, (c) 8 × 10⁻³ M, (d) 1.2 × 10⁻² M, (e) 1.6 × 10⁻² M, and (f) 2 × 10⁻² M; (D) [KClO3] = (a) 0 M, (b) 9 × 10⁻³ M, (c) 1.8 × 10⁻² M, (d) 2.7 × 10⁻² M, (e) 3.6 × 10⁻² M, and (f) 4.5 × 10⁻² M; (E) [KBrO3] = (a) 0 M, (b) 1.5 × 10⁻² M, (c) 3 × 10⁻² M, and (d) 4.5 × 10⁻² M; (F) [KIO3] = (a) 0 M, (b) 1 × 10⁻² M, (c) 2 × 10⁻² M, and (d) 3 × 10⁻² M, respectively; (a′) is the cyclic voltammogram of the bare GCE examined in the maximal concentration of reactants in each case (A–F), scan rate = 0.1 V s−1. | ||
Fig. 6B displays the electrocatalytic reduction of oxygen using the PNR/FAD electrode in 0.1 M PBS (pH 7). It clearly shows the electrocatalytic current response for 2.4 mg L−1oxygen with two cathodic peaks at −0.42 V and −0.55 V. Fig. 6C displays the electrocatalytic reduction of hypochlorite using the PNR/FAD electrode in 0.1 M PBS (pH 7). It shows the specific catalytic current for 2 × 10⁻² M hypochlorite with three cathodic peaks at −0.1 V, −0.42 V, and −0.55 V. According to these significant results, we can apply these specific potentials to determine these species with appropriate calculation. The electrocatalytic reactions can be expressed as the following equations:
| PNR(reduced form)/FADH2 + O2 → PNR(oxidized form)/FAD + 2H2O | (8) |
| PNR(reduced form)/FADH2 + 2ClO− → PNR(oxidized form)/FAD + 2Cl− + 2H2O | (9) |
At pH 4 (0.1 M KHP), the electrocatalytic reduction was also studied by PNR/FAD/GCE. Fig. 6D–F displays the PNR/FAD voltammetric responses to chlorate, bromate, and iodate, respectively. By the result, the PNR/FAD electrocatalytically reduces bromate and iodate excepting chlorate. It is noticed that the different electrocatalytic properties are especially good for iodate. One can conclude that the PNR/FAD has electrocatalytic activities dependent on the atomic number of the halide reactants ([KIO3] > [KBrO3] > [KClO3]). The electrocatalytic reactions can be expressed as the following equations:
| PNR(reduced form)/FADH2 + BrO3− → PNR(oxidized form)/FAD + Br− + 2H2O + 1/2O2 | (10) |
| PNR(reduced form)/FADH2 + IO3− → PNR(oxidized form)/FAD + I− + 2H2O + 1/2O2 | (11) |
Fig. 7 displays the PNR/FAD voltammetric response to NADH in 0.1 M PBS (pH 7). Compared with the bare electrode, it shows an obvious electrocatalytic oxidation current to NADH at about 0.1 V. From the result, one can conclude that the PNR/FAD is a good electro-active species for NADH oxidation. According to our experimental results, the reaction mechanism when using a PNR/FAD hybrid film as a catalyst can be described as follows:
| PNR(oxidized form)/FAD + 2NADH → PNR(reduced form)/FAD + 2NAD | (12) |
As the result shown in Table 1, we conclude that the PNR/FAD hybrid film is a good electro-active material due to good electro-catalytic reaction for hydrogen peroxide, oxygen, hypochlorite, bromate, iodate, and NADH. In particular, it can be developed as a multi-functional sensor for these species. A simple, HRP-free, and low-cost hydrogen peroxide sensor was further studied by amperometry.
![Cyclic voltammograms of PNR/FAD/GCE examined in 0.1 M PBS (pH 7) in the presence of [NADH] = (a) 0 M, (b) 1.4 × 10⁻⁴ M, (b) 2.8 × 10⁻⁴ M, (c) 4.2 × 10⁻⁴ M, (d) 5.6 × 10⁻⁴ M, (e) 7 × 10⁻⁴ M, (f) 8.4 × 10⁻⁴ M, (g) 9.8 × 10⁻⁴ M, (h) 1.12 × 10⁻³ M, and (i) 1.26 × 10⁻³ M, respectively; (a′) is cyclic voltammogram of the bare GCE examined in the maximal concentration in this case, scan rate = 0.1 V s−1.](/image/article/2012/AN/c1an15739f/c1an15739f-f7.gif) | ||
| Fig. 7 Cyclic voltammograms of PNR/FAD/GCE examined in 0.1 M PBS (pH 7) in the presence of [NADH] = (a) 0 M, (b) 1.4 × 10⁻⁴ M, (b) 2.8 × 10⁻⁴ M, (c) 4.2 × 10⁻⁴ M, (d) 5.6 × 10⁻⁴ M, (e) 7 × 10⁻⁴ M, (f) 8.4 × 10⁻⁴ M, (g) 9.8 × 10⁻⁴ M, (h) 1.12 × 10⁻³ M, and (i) 1.26 × 10⁻³ M, respectively; (a′) is cyclic voltammogram of the bare GCE examined in the maximal concentration in this case, scan rate = 0.1 V s−1. | ||
In this work, one main goal we try to complete is the development of a multi-functional sensor using the PNR/FAD hybrid film. So, the electrocatalysis of hydrogen peroxide and NADH were further studied using this hybrid composite. It was studied by amperometry (in Section 3.6) due to their specific potentials.
Further study was focused on the electroactivity behaviour at FAD alone, PNR alone and the composite film. Since FAD cannot be directly electro-deposited on the electrode surface the FAD-layer modified electrode was prepared by adsorption. By comparison as shown in Table 2, the net current response was estimated and compared for each electrocatalysis at different modified electrodes including FAD/GCE, PNR/GCE, and PNR/FAD/GCE. The FAD-layer adsorbed electrode may be not stable so that might provide a relatively low net current response. Eliminating this point, one can find that the net current response of PNR/FAD was almost the sum of the net current response of FAD and PNR for each electrocatalysis experiment. This means that PNR/FAD can maintain the electroactivity of FAD and PNR at least. Hence this hybrid composite can be used as expected for electrocatalysis of these species.
| Net current responsea (ΔIi/ΔCj)/μA M−1 | NADH (pH 7) | H2O2 (pH 7) | O2 (pH 7) | NaClO (pH 7) | KBrO3 (pH 4) | KIO3 (pH 4) |
|---|---|---|---|---|---|---|
| a Net current response means that the current was contributed by the material i to analytej per unit concentration, ΔIi/ΔCj, in μA M−1. | ||||||
| FAD | — | 16 | 377 | 31 | 11.2 | 10.8 |
| PNR | 4275 | — | 22![[thin space (1/6-em)]](https://www.rsc.org/images/entities/char_2009.gif) 000 000 |
89 | 22 | 310 |
| PNR/FAD | 4594 | 30.8 | 30![[thin space (1/6-em)]](https://www.rsc.org/images/entities/char_2009.gif) 000 000 |
132 | 71.1 | 292.7 |
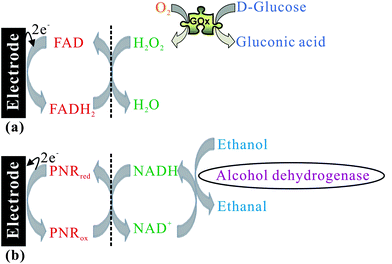
Based on the activity for hydrogen peroxide and NADH, it has the potential to be developed as a good biosensing system as shown in Scheme 4. By the FAD/FADH2 redox process, H2O2 can be electrocatalytically reduced to H2O while glucose is oxidised to gluconic acid by glucose oxidase (GOx) as shown in Scheme 4a. By the PNRred/PNRox redox process, NADH is electrocatalytically oxidized to NAD+ while alcohol is oxidized to acetaldehyde by alcohol dehydrogenase (ADH) as shown in Scheme 4b. It can provide the biosensing for glucose and ethanol using the PNR/FAD hybrid composite.
3.6 Amperometric responses for hydrogen peroxide, oxygen, hypochlorite and NADH using poly(neutral red) and FAD hybrid film
The determination of hydrogen peroxide using the PNR/FAD electrode was studied by amperometry. Amperometric response with several additions of hydrogen peroxide was tested to define the sensing abilities of the PNR/FAD film modified GCE electrode.Fig. 8A shows the amperometric responses of PNR/FAD/GCE for hydrogen peroxide in 0.1 M PBS (pH 7). An applied potential at −0.45 V with an electrode rotation speed of 1000 rpm, the amperometric response of PNR/FAD/GCE was tested as a blank during the initial period of 0–200 s. As sequential additions of 10−4 M hydrogen peroxide (time interval = 50 s) during 200–2000 s, the correlative amperometric responses are increasing significantly. By the result, the PNR/FAD/GCE has a detection limit of 0.1 μM (S/N = 3). It provides two linear concentration ranges of 0.1 μM–39 mM and 48.8–355.5 mM with the sensitivity of 5.4 μA mM−1 cm−2 and 12.3 μA mM−1 cm−2, respectively. The relative standard deviation (RSD) for determining H2O2 (n = 10) was 3.78%. It indicates that the senor has very good reproducibility at pH 7. As shown in Table 3, this electrode shows competitive sensitivity as compared with other enzyme-free (without HRP) H2O2 sensors. Having the above information, it is good for developing an HRP-free H2O2 sensor.
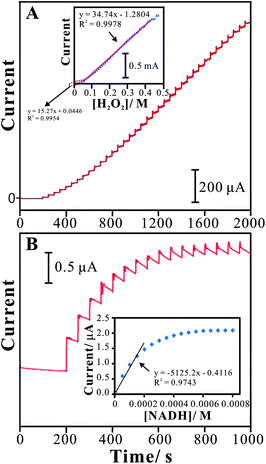 | ||
| Fig. 8 (A) Amperometric responses of sequential additions of H2O2 (each 10−4 M per time, time interval = 50 s) at the PNR/FAD/GCE in 0.1 M PBS (pH 7), rotation speed = 1000 rpm, Eapp = −0.45 V. Inset: the plot of peak current vs.H2O2 concentration. (B) Amperometric responses of sequential additions of NADH (each 5 × 10⁻⁵ M per time, time interval = 50 s) at the PNR/FAD/GCE in 0.1 M PBS (pH 7), Eapp = 0.1 V. Inset: the plot of peak current vs.NADH concentration. | ||
Fig. 8B shows the amperometric responses of PNR/FAD/GCE for NADH determination. The sensitivity, detection limit, and linear concentration range were estimated to be about 21.5 μA mM−1 cm−2, 10−5 M (S/N = 3), and 5 × 10⁻⁵ to 2.5 × 10⁻⁴ M for NADH. The relative standard deviation (RSD) for determining NADH (n = 10) was 4.8%. It indicates that the senor has very good reproducibility for NADH determination at pH 7.
As the result, this hybrid composite can be used as a multi-functional sensor to determine H2O2 and NADH.
3.7 Stability study of poly(neutral red) and FAD hybrid film
Repetitive redox cycling experiments were done to determine the extent of stability relevant to PNR/FAD/GCE in 0.1 M PBS solution (pH 7). This investigation indicated that after 100 continuous scan cycles with a scan rate of 0.1 V s−1, the peak heights of the cyclic voltammograms decreased by less than 5%. This electrode was also monitored and compared with its initial current response when kept in 0.1 M PBS solution (pH 7) for more than one month. A decrease of 8% was observed in the current response of the electrode at the end of the 30th day. And the electrocatalytic response current of PNR/FAD for H2O2, NADH, KBrO3, KIO3, and NaClO can retain more than 90% of its original current response. The analytical applicability of the sensor was evaluated by determining the recoveries of five H2O2 samples with different concentrations by the standard addition method. The results were satisfactory, with an average of 99.68%, as listed in Table 3. As the result, this hybrid composite is more stable and different from the neutral red monomer which might be due to the more compact PNR/FAD structure.4. Conclusions
Here we report a simple method to fabricate a multi-functional sensor for the determination of H2O2 and NADH based on the PNR/FAD nanocomposite. It can be an HRP-free H2O2 sensor due to the good electrocatalytic reduction of H2O2 without the HRP enzyme and shows a lower over-potential and higher current response. It has the potential to replace some hemoproteins to be a cathode of biofuel cells. It can provide the biosensing system for glucose and alcohol. In neural and acidic conditions, it can electrocatalytically reduce KBrO3, KIO3, O2, and NaClO, respectively. Moreover, the amperometric response of PNR/FAD/GCE is linearly dependent on the H2O2 and NADH concentration at different potentials. This proposed film shows a good electrocatalytic result to develop multi-functional sensors. It has the advantages of being enzyme-free, multi-functional, low cost, having a low over-potential, and high sensitivity.Acknowledgements
We acknowledge National Science Council (project no. NSC982113M027006MY3), Taiwan.References
- Y. Usui, K. Sato and M. Tanaka, Angew. Chem., Int. Ed., 2003, 42, 5623–5625 CrossRef CAS.
- M. I. Prodromidis and M. I. Karayannis, Electroanalysis, 2002, 14, 241–261 CrossRef CAS.
- D. J. Barrington and A. Ghadouani, Environ. Sci. Technol., 2008, 42, 8916–8921 CrossRef CAS.
- C. P. Rinsland, P. F. Coheur, H. Herbin, C. Clerbaux, C. Boone, P. Bernath and L. S. Chiou, J. Quant. Spectrosc. Radiat. Transfer, 2007, 107, 340–348 CrossRef CAS.
- K. F. Fernandes, C. S. Lima, F. M. Lopes and C. H. Collins, Process Biochem., 2005, 40, 3441–3445 CrossRef CAS.
- A. Brestovisky, E. KirowaEisner and J. Osteryoung, Anal. Chem., 1983, 55, 2063–2066 CrossRef CAS.
- N. Yamashiro, S. Uchida, Y. Satoh, Y. Morishima, H. Yokoyama, T. Satoh, J. Sugama and R. Yamada, J. Nucl. Sci. Technol., 2004, 41, 890–897 CrossRef CAS.
- D. Janasek and U. Spohn, Sens. Actuators, B, 1997, 39, 291–294 CrossRef.
- R. Pehrman, M. Amme and C. Cachoir, Czech J. Phys., 2006, 56, D373–D379 CAS.
- M. W. Shao, Y. Y. Shan, N. B. Wong and S. T. Lee, Adv. Funct. Mater., 2005, 15, 1478–1482 CrossRef CAS.
- Y. Qiao, G. Yang, F. Jian, Y. Qin and L. Yang, Sens. Actuators, B, 2009, 141, 205–209 CrossRef.
- Y. Shen, M. Trauble and G. Wittstock, Anal. Chem., 2008, 80, 750–759 CrossRef CAS.
- L. M. Li, S. J. Xu, Z. F. Du, Y. F. Gao, J. H. Li and T. H. Wang, Chem.–Asian J., 2010, 5, 919–924 CrossRef CAS.
- X. B. Lu, J. H. Zhou, W. Lu, Q. Liu and J. H. Li, Biosens. Bioelectron., 2008, 23, 1236–1243 CrossRef CAS.
- C. H. Wang, C. Yang, Y. Y. Song, W. Gao and X. H. Xia, Adv. Funct. Mater., 2005, 15, 1267–1275 CrossRef CAS.
- L. Zhang, Biosens. Bioelectron., 2008, 23, 1610–1615 CrossRef CAS.
- H. Y. Liu, J. F. Rusling and N. F. Hu, Langmuir, 2004, 20, 10700–10705 CrossRef CAS.
- X. Kang, J. Wang, Z. Tang, H. Wu and Y. H. Lin, Talanta, 2009, 78, 120–125 CrossRef CAS.
- Y. Y. Song, D. Zhang and X. H. Xia, Chem.–Eur. J., 2005, 11, 2177–2182 CrossRef CAS.
- J. J. Yu, J. R. Ma, F. Q. Zhao and B. Z. Zeng, Talanta, 2008, 74, 1586–1591 CrossRef CAS.
- H. F. Cui, J. S. Ye, W. D. Zhang, C. M. Li, J. H. T. Luong and F. S. Sheu, Anal. Chim. Acta, 2007, 594, 175–183 CrossRef CAS.
- M. A. Zanjanchi and S. H. Sohrabnezhad, Sens. Actuators, B, 2005, 105, 502–507 CrossRef.
- D. W. Yang and H. H. Liu, Biosens. Bioelectron., 2009, 25, 733–738 CrossRef CAS.
- S. Shahrokhiana and E. Asadiana, Electrochim. Acta, 2010, 55, 666–672 CrossRef.
- C. X. Chen and Y. H. Gao, Electrochim. Acta, 2007, 52, 3143–3148 CrossRef CAS.
- D. D. Schlereth and A. A. Karyakin, J. Electroanal. Chem., 1995, 395, 221–232 CrossRef.
- Y. Sun, B. Ye, W. Zhang and X. Zhou, Anal. Chim. Acta, 1998, 363, 75–80 CrossRef CAS.
- J. M. Bauldreay and M. D. Archer, Electrochim. Acta, 1983, 28, 1515–1522 CrossRef CAS.
- V. I. Birss, S. Guha-Thakurta, C. E. McGarvey, S. Quach and P. Vanysek, J. Electroanal. Chem., 1998, 456, 71–82 CrossRef.
- R. Garjonyte, A. Malinauskas and L. Gorton, Bioelectrochemistry, 2003, 61, 39–49 CrossRef CAS.
- Y. Wang, G. Zhu and E. Wang, Anal. Chim. Acta, 1997, 338, 97–101 CrossRef CAS.
- K. C. Lin and S. M. Chen, Biosens. Bioelectron., 2006, 21, 1737–1745 CrossRef CAS.
- A. Ramanavicius and A. Ramanviciene, Fuel Cells, 2009, 9, 25–36 CrossRef CAS.
- A. Ramanavicius, A. Kausaite and A. Ramanviciene, Biosens. Bioelectron., 2005, 20, 1962–1967 CrossRef CAS.
- A. Ramanavicius, A. Kausaite and A. Ramanviciene, Biosens. Bioelectron., 2008, 24, 761–766 CrossRef CAS.
- E. Katz, I. Willner and A. B. Kotlyar, J. Electroanal. Chem., 1999, 479, 64–68 CrossRef CAS.
- Z. Zhu, C. Momeu, M. Zakhartsev and U. Schwaneberg, Biosens. Bioelectron., 2006, 21, 2046–2051 CrossRef CAS.
- C. Yang, J. Yi, X. Tang, G. Zhou and Y. Zeng, React. Funct. Polym., 2006, 66, 1336–1341 CrossRef CAS.
- B. Lu, J. Bai, X. Bo, L. Yang and L. Guo, Electrochim. Acta, 2010, 55, 4647–4652 CrossRef CAS.
- K. C. Lin and S. M. Chen, J. Electroanal. Chem., 2005, 578, 213–222 CrossRef CAS.
- E. Laviron, J. Electroanal. Chem., 1974, 52, 355–393 CrossRef CAS.
Footnote |
| † This article is part of a web theme in Analyst and Analytical Methods on Future Electroanalytical Developments, highlighting important developments and novel applications. Also in this theme is work presented at the Eirelec 2011 meeting, dedicated to Professor Malcolm Smyth on the occasion of his 60th birthday. |
| This journal is © The Royal Society of Chemistry 2012 |

