Dual detection strategy for electrochemical analysis of glucose and nitrite using a partitionally modified electrode†
Jingyi
Wang
,
Peng
Diao
* and
Qi
Zhang
Key Laboratory of Aerospace Materials and Performance (Ministry of Education), School of Materials Science and Engineering, Beihang University, Beijing, 100191, China. E-mail: pdiao@buaa.edu.cn; Fax: +86-01-82339562; Tel: +86-01-82339562
First published on 7th November 2011
Abstract
A dual-region modified electrode was designed and fabricated by means of partitioned electrodeposition of gold and platinum nanoparticles on an indium tin oxide (ITO) conductive glass for dual-component electrochemical detection. The two differently modified regions were assigned to detect two analytes, separately and simultaneously. The gold nanoparticle modified ITO region (AuNPs/ITO) was used for glucose detection while the platinum nanoparticle modified ITO region (PtNPs/ITO) for nitrite detection. The glucose oxidation peak current at 0.10 V on AuNPs/ITO exhibited a linear dependence on the concentration of glucose and was used to determine the concentration of glucose in dual-detection. The nitrite reduction peak current at PtNPs/ITO showed a nonlinear dependence on the concentration of nitrite. A theoretical model combining the adsorption-controlled and the mass-transfer-controlled kinetics was proposed to quantitatively describe the nonlinear behavior. Though the presence of glucose interfered with the electrochemical detection of nitrite, it was demonstrated that the influence of glucose on nitrite detection can be corrected. On the basis of the proposed theoretical model, the simultaneous dual-detection of glucose and nitrite was accomplished at ITO electrodes partitionally modified with AuNPs and PtNPs.
Introduction
Traditional methods of dual- and multi-component chemical analysis involve the procedure of component separation, which is usually the slowest step that determines the efficiency of an analytical technique.1 Consequently, simultaneous determination of dual- or multi-components without a separation process is a challenging issue from the viewpoint of improving efficiency in chemical analysis. Electrochemical techniques are attractive in sensing applications because of their excellent sensitivity, rapid response, low cost and remarkable diversity. Electrochemical simultaneous detection of multi-analytes has been reported using different sensing systems such as individual working electrode devices2 and sensor arrays.3 One working electrode sensing devices usually work with differential pulse voltammetric2a,b or square wave voltammetric techniques2c to improve the separation of response peaks; however, this system has the limitation of only being able to detect a very small number of analyte species. As for sensor arrays, the difficulty is to synthesize the specific recognition elements and to generate unique response patterns for each analyte.4The application of microelectrode arrays has greatly improved the performance of electrochemical sensors, especially when different individual electrodes are composed of different materials.5 Different potentials can be applied to different individual electrodes to generate more information for target discrimination.3c Moreover, the microelectrodes can be separately modified with different films to generate surfaces with different chemical or physical properties. The separation step performed in situ at the modified surfaces through specific interactions adds new dimensions of information,6 and then enhances the power of electrochemical dual- or multi-component detection.
The chemical or physical modification can also be realized on different regions of one substrate, making it possible to fabricate an integrated electrode system with multi-component sensing properties. Multi-region modifications provide several micro-regions for multi-component recognition instead of the combination of microelectrode arrays, and the multi-region electrode system on a common substrate enhances the integration level of a sensor device. Multi-region modification (or micropatterning) on a substrate can be obtained through lithography7 and microcontact printing,8 which provide templates to guide the multi-region modification process. However, the size, shape and location of a pattern prepared by lithography are determined not by the features of the substrate but by the templates or stamps. Assembly methods for multi-region modification, such as combinatorial assembly,9 were also used to fabricate multi-region substrates, but these methods lacked the precise control over the location of the pattern on the substrate. We have developed a potential-assisted assembly technique to prepare different molecular monolayers on different substrate regions that were very close in space but insulated from each other.10 The advantage of this technique is that the size, shape, and location of the monolayer patterns are determined by the features of artificial structures prefabricated on the substrates. This strategy can be easily extended to the preparation of different micro- and nano-structures on different regions of one substrate, and therefore, has great potential in fabricating multi-component sensing devices.
Glucose and nitrite that coexist in body fluid and in foodstuffs play important roles in energy supply, signal transmission and modulation in human and animal body. Determining the concentration of glucose and nitrite is important not only in medicine but also in food safety and environment protection. In this work, we demonstrate a novel strategy for the simultaneous dual-detection of glucose and nitrite by using partitionally modified ITO electrodes.
Experimental
Chemicals and apparatus
Hydrogen tetrachloroaurate trihydrate (HAuCl4·3H2O) was obtained from Aldrich Co. Hydrogen hexachloroplatinate(IV) hexahydrate (H2PtCl6·6H2O) and all other chemicals were purchased from Sinopharm Chemical Reagent Beijing Co., Ltd. All the chemicals were of analytical grade. The aqueous solutions were prepared using deionized water. The indium tin oxide (ITO) coated glass slides obtained from CSG Holding Co. have a square resistance of 15 Ω.Electrochemical measurements
Electrochemical measurements were performed on a CHI750c electrochemical workstation (CH Instruments Co.). The electrodeposition and the cyclic voltammetric (CV) experiments were carried out in a conventional three-electrode cell at room temperature. A saturated calomel electrode (SCE) and a Pt foil were employed as reference and counter electrodes, respectively. All potentials are reported with respect to the SCE.Preparation of partitionally modified electrode
The glass substrates were pre-fabricated with two closely spaced ITO films that were insulated from each other, as shown schematically in Scheme 1. A home-made electrochemical cell was designed and used to prepare the partitionally modified ITO electrodes. As shown in Scheme 1, the electrochemical cell has a circular window on its bottom, which was used to expose the ITO substrate to electrolytes. The ITO substrate was pressed tightly to the cell bottom by a screw bolt, with the same areas of the two insulated films exposed to the solution. Prior to use, the whole substrates were cleaned by sonication in 0.5 M KOH and acetone for 5 min and 15 min, respectively.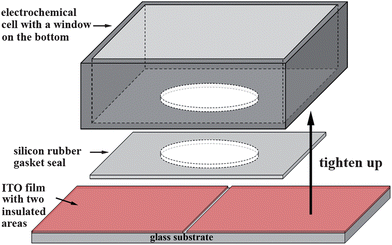 | ||
| Scheme 1 Schematic representation of the ITO substrates with two conductive areas insulated from each other and the electrochemical cell system used to prepare the partitionally modified electrodes. | ||
The strategy for the preparation of partitionally modified ITO electrodes is shown schematically in Scheme 2. Platinum nanoparticles (PtNPs) and gold nanoparticles (AuNPs) were electrodeposited onto two different ITO regions to obtain PtNP- and AuNP-modified electrodes (PtNPs/ITO and AuNPs/ITO), respectively. The deposition processes are as follows. First, the electrochemical cell was filled with 0.1 M HCl containing 10−4 M H2PtCl6. One of the two insulated ITO films was connected to the electrochemical workstation, and a deposition potential of −0.3 V was applied to this part of ITO film for 1800 s to generate PtNPs on its surface. During the electrodeposition, another part of ITO film was free from Pt deposition due to the insulating zone between two ITO films. Second, the conducting part of the substrate connected to the electrochemical workstation was changed to the PtNPs-free ITO film after the cell was cleaned and then refilled with 1 M KCl containing 10−4 M HAuCl4. A deposition potential of −0.6 V was applied to the PtNPs-free ITO film for 130 s to deposit AuNPs on the surface. The final electrodes were dual-region modified ITO electrodes and the two different ITO regions were denoted as PtNPs/ITO and AuNPs/ITO, respectively.
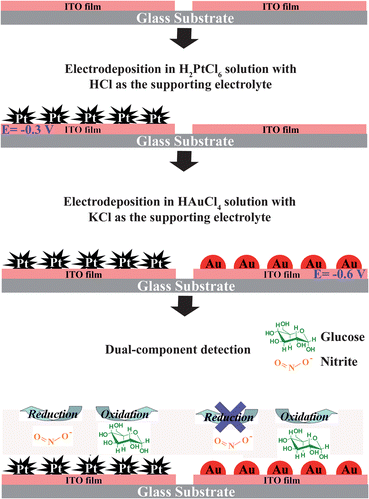 | ||
| Scheme 2 Schematic representation of the fabrication of a dual-region modified electrode and its application in dual-component detection. | ||
Electrochemical detection of nitrite and glucose
Electrochemical detection of nitrite and glucose was conducted using CV techniques in 0.5 M KOH containing analytes. Before CV measurements, the solution was saturated with high pure N2 at least for 20 min. During CV measurements, high pure N2 was bubbled continuously into the solution to rule out the influence of dissolved oxygen. Scheme 2 also shows the strategy for electrochemical dual detection, in which the concentration of glucose was determined by its oxidation current on AuNPs/ITO electrode, while the concentration of nitrite was determined by the reduction current on PtNPs/ITO. The dual-detection was carried out with a double-channel electrochemical workstation (CHI750c, CH Instruments Co.), but only one-channel was used. Though using two channels is more convenient for dual-detection, we intentionally used only one channel of electrochemical workstation because the one-channel potentiostat is the most commonly used electrochemical equipment and available in almost all electrochemical labs. The use of simple equipment will endow wider application of the detection strategy described in this work. To carry out dual detection by using only one-channel, PtNPs/ITO and AuNPs/ITO were connected together by wires to one channel of the electrochemical workstation during measurement. To normalize the current obtained for different samples, it is necessary to know the real surface areas of AuNPs and PtNPs. The details for the electrochemical determination of the real surface area of AuNPs and PtNPs are presented in the ESI†.Results and discussion
Single detection of glucose on AuNPs/ITO electrode
SEM characterization of the AuNPs/ITO and PtNPs/ITO (see ESI†) shows that both the AuNPs and PtNPs are uniformly dispersed on the ITO substrate. The AuNPs appear to be spherical with a mean diameter of ca. 40 nm. The PtNPs are more anisotropic in shape with a mean size of 56 nm (see the statistic analysis in the ESI†). The small noble metal nanoparticles provide large specific areas, which greatly improve the sensitivity of the modified electrodes toward target analytes.Fig. 1 shows the typical CV behaviors of AuNPs/ITO in 0.5 M KOH with and without glucose. In the absence of glucose, AuNPs/ITO exhibits CV features of a gold electrode (dashed line) and the current peak (peak β) at about −0.1 V is the intrinsic peak of AuNPs/ITO in 0.5 M KOH.11 While in the presence of glucose, two oxidation peaks (I and II) appear at about −0.35 and 0.10 V in the positive-going sweep, and a third oxidation peak (III) appears at about 0.05 V in the negative-going sweep. All three peaks reflect the electrooxidation of glucose. Peak I corresponds to a two-electron dehydrogenation of anomeric carbon process that produces gluconolactone (or gluconate, the hydrolysis product of gluconolactone).12 Peak II is believed to be originated from the direct oxidation of glucose on the –OH coated gold surface. As the potential moves positively to 0.1 V, more OH− are adsorbed on gold to form Au–OH bonds, which were well accepted to be the active sites for glucose oxidation on gold. Thus there are sufficient active sites on the hydroxyl coated gold surface to allow direct oxidation of glucose to generate both gluconolactone and oxalate.12a,13 Beyond the potential range of peak II, gold oxide species are formed on the surface of AuNPs, inhibiting the oxidation of glucose. During the cathodic sweep, the reduction of gold oxide species occurs and Au–OH active sites re-form on the surface of AuNPs.12b,13a As a result, glucose oxidation peak III appears. These three peaks are carefully studied in this work to establish a relationship between the oxidation peak current density (jp,ox) and glucose concentration (Cglucose).
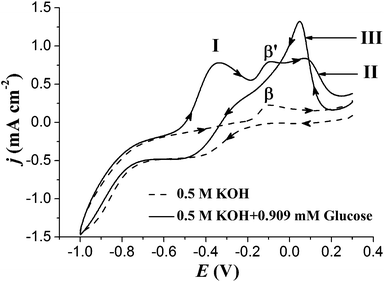 | ||
| Fig. 1 CV curves of AuNPs/ITO in 0.5 M KOH with (solid line) and without (dashed line) 0.909 mM glucose. Potential sweep rate: 0.1 V s−1. | ||
Fig. 2 demonstrates the CV curves of AuNPs/ITO in 0.5 M KOH with different Cglucose. To make each current peak clearly seen, CV responses in the positive and the negative scanning directions are separately shown in Fig. 2a and b. Besides peaks I, II and III which have been discussed above, a fourth peak (referred to as peak IV) appears in the case of high Cglucose at the same potential range of peak I, as can be seen in Fig. 2b. Its peak current increases with the increasing Cglucose, suggesting that Peak IV is also related to the glucose oxidation. This peak may originate from the oxidation of intermediate products generated at high potentials during the potential sweep. Because there are four current peaks related to the electrooxidation of glucose, it is necessary to determine which one is more suitable for glucose detection. Fig. 2c shows the dependence of jp,ox on Cglucose, which were obtained at different peaks. Only the jp,ox of peak II exhibits a nearly perfect linear correlation with Cglucose in the investigated concentration range.
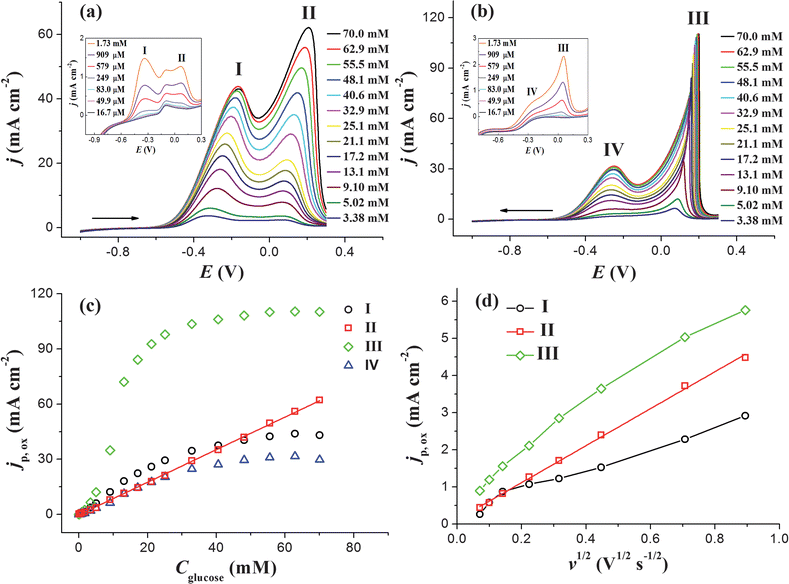 | ||
| Fig. 2 CV curves of AuNPs/ITO in 0.5 M KOH with different glucose concentrations in (a) positive scanning direction and (b) negative scanning direction. The potential at potential sweep rate is 0.1 V s−1. (c) jp,oxvs. Cglucose curve of different current peaks shown in (a) and (b). (d) The dependence of jp,ox on square root of potential sweep rate for different current peaks obtained at AuNPs/ITO in 0.5 M KOH with 1 mM glucose. | ||
In order to study the rate-determining step of the peaks I, II and III, CV curves were recorded at different potential sweep rates (v). The variations of jp,ox as a function of v1/2 for peaks I, II and III are shown in Fig. 2d. Only the jp,ox of peak II varies linearly with v1/2, suggesting that peak II reflects a linear diffusion-controlled process.14 This result is in good agreement with the proposed mechanism for peak II,12a,13 in which the Au–OH surface allows direct oxidation of glucose on AuNPs. For a diffusion-controlled irreversible electrode process at 25 °C, the current density in A cm−2, jp,ox, can be expressed as14
| jp,ox = 299nα1/2D1/2glucosev1/2Cglucose | (1) |
Single detection of nitrite on PtNPs/ITO electrode
Fig. 3 shows the CV responses of PtNPs/ITO in the absence and presence of nitrite in 0.5 M KOH. In the absence of nitrite, PtNPs/ITO exhibits CV features characteristic of a platinum electrode in alkaline solution.16 The reduction peak at about −0.3 V attributes to the reduction of surface platinum oxides formed in the positive-going sweep. In the presence of nitrite, a large reduction peak is observed at about −0.86 V in the negative-going sweep. This peak corresponds to the reduction of nitrite and the overall reaction consumes six electrons and occurs partly via adsorbed species.17 The reduction peak current at about −0.86 V on PtNPs/ITO electrode was used in this work to detect the concentration of nitrite.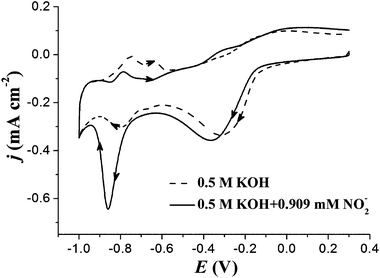 | ||
| Fig. 3 CV curves of PtNPs/ITO in 0.5 M KOH with (solid line) and without (dashed line) 0.909 mM nitrite. Potential sweep rate: 0.1 V s−1. | ||
Fig. 4a shows the negative-going sweep parts (from −0.7 V to −1.0 V) of CV curves obtained on PtNPs/ITO in 0.5 M KOH with different nitrite concentrations (CNO2−). The variation of the nitrite reduction peak current (jp,red) as a function of CNO2− can be obtained from Fig. 4a, and the result is shown in Fig. 4b, which clearly demonstrates a nonlinear correlation between jp,red and CNO2− in the investigated concentration regime from 0.00 μM to 9.11 mM. Although jp,red varies nonlinearly with CNO2− in the whole investigated concentration regime, a good linear dependence of jp,red on CNO2− is observed in the low (CNO2− < 0.1 mM) and the high (CNO2− > 4 mM) concentration range, as shown in the insets of Fig. 4b. The obtained linear relationship can be used to determine CNO2− in low and high concentration ranges. We believe that the nonlinear phenomenon is due to the involvement of surface adsorption during nitrite reduction.17
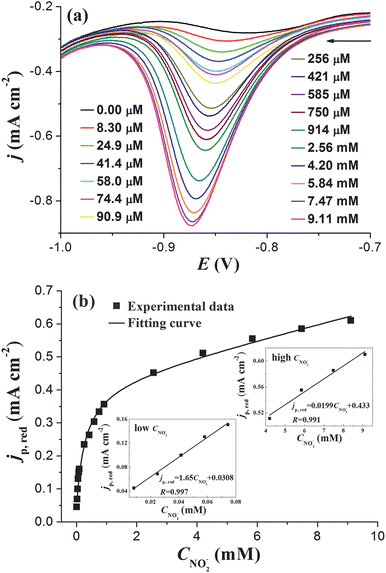 | ||
| Fig. 4 (a) Negative scanning parts of CV curves obtained at PtNPs/ITO in 0.5 M KOH with different CNO2−. (b) Variation of peak current density jp,red as a function of CNO2−. Insets in (b) show the linear dependence of jp,red on CNO2− in the low and the high concentration ranges. Potential sweep rate: 0.1 V s−1. | ||
Since the reduction of nitrite occurs partly via adsorbed species,17 it could be deduced that the electrode kinetics is controlled by the combination of an adsorption and a mass transportation process. When both the adsorbed and the dissolved forms of the same species are electrochemically active, they will both contribute to the current, and usually two peaks can be expected. However, when the difference in energies for the charge transfer reaction of adsorbed and dissolved species is small, only one current peak can be observed.14 Usually the electrochemical reaction of the adsorbed reactant occurs at a lower overpotential compared to the dissolved reactant. Therefore, in the case of nitrite, when its concentration is relatively low, the adsorbed nitrite dominates the reduction current and the peak appears at a more positive potential (lower overpotential). While with the increase of nitrite concentration, all the active sites for adsorption are saturated with adsorbed nitrite, more and more free nitrite in solution can directly transfer electrons to the electrode at the Pt surface where there is no adsorbed nitrite. Therefore, the peak position at high nitrite concentration shifts slightly to a more negative potential since the direct electrochemical reduction of nitrite needs more energies, as can be seen from Fig. 4a.
According to the above discussion, when nitrite reduction occurs, the whole PtNPs surface is served as the place both for nitrite adsorption and for direct nitrite reduction. The total surface area A can be expressed as A = Aads + Adiff, where Aads is the surface area for adsorbed nitrite reduction and Adiff for dissolved nitrite reduction.
For an irreversible electrode process in which only the adsorbed reactants are electrochemically active and the adsorption step is not fast enough, the peak current Ip,ads (A) of the adsorbed reactants at 25 °C can be expressed as:14
 | (2) |
 | (3) |
 | (4) |
Similar to eqn (1), the diffusion-control nitrite reduction current is given by:
 | (5) |
Hence, the total nitrite reduction current density (A cm−2) at the PtNPs/ITO electrode can be obtained by adding the diffusion controlled current density and the surface process controlled current density together:
 | (6) |
It can be deduced from eqn (6) that jp,red is proportional to CNO2− when the bulk nitrite concentration is very low. This is in good agreement with the experimental result obtained at low nitrite concentration (Fig. 4b). When the bulk nitrite concentration increases to a certain value, Aads is saturated with the adsorbed nitrite, and the current contribution from the adsorbed nitrite (the last term in eqn (6)) will keep constant even though the bulk concentration of nitrite is further increased. While in the meantime, current contribution from diffusion (the first right-hand term in eqn (6)) greatly increases because diffusion current is proportional to the concentration of the reactant. That is why we observe a linear relationship again between jp,red and CNO2− in the high concentration range (Fig. 4b). Therefore, with the increase of CNO2−, the electrode kinetics gradually changes from a surface dominated process to a diffusion dominated process. This change results in a decreasing tangent from 1.65 to 0.0199 in Fig. 4b. Moreover, a linear dependence of jp,red on v1/2 was also observed in 10 mM nitrite solution (see ESI†), further confirming that diffusion dominates the electrode process at high CNO2−. All the above discussion supports that eqn (6) can well describe jp,red during nitrite reduction.
Accordingly, we use eqn (6) to fit the experimental jp,red ∽ CNO2− data in Fig. 4b. The obtained fitting curve is also shown in Fig. 4b, from which it is seen that the fitting curve matches well with the experimental data. The fitting curve can be used to calculate the coefficients before CNO2− and v in each term in eqn (6). After introducing the obtained coefficients into eqn (6), we obtained the reduction current density in A cm−2:
 | (7) |
Dual detection of glucose and nitrite at partitionally modified electrode
To accomplish dual detection of glucose and nitrite, we need to know whether the presence of one analyte will interfere in the detection of the other. Effects of glucose on nitrite detection and nitrite on glucose detection are shown in Fig. 5a, from which it is seen that nitrite has no influence on the electrooxidation of glucose. However, on PtNPs/ITO, in the potential range of −1.0 V to −0.8 V,18glucose has an oxidation peak whereas nitrite is reduced. As a result, glucose will dramatically interfere with the detection of nitrite on PtNPs/ITO, as can be seen in Fig. 5b. Even though CNO2− is fixed to 10.9 mM, jp,red decreases linearly with the increase of Cglucose (inset of Fig. 5b).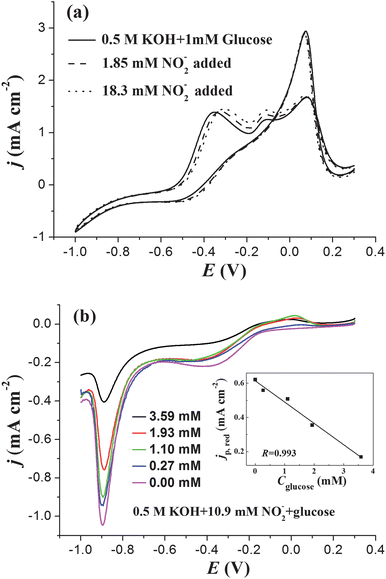 | ||
| Fig. 5 (a) CV curves of AuNPs/ITO in 0.5 M KOH containing 1 mM glucose and different nitrite concentrations. (b) Negative-going sweep part of CV curves obtained on PtNPs/ITO in 0.5 M KOH containing 10.9 mM nitrite and different Cglucose. The inset of (b) shows the linear decrease of jp,red with the increase of Cglucose. Potential sweep rate: 0.1 V s−1. | ||
Though the mechanism of the interference of glucose on the oxidation of nitrite is not quite clear, the linear correlation between jp,red and Cglucose suggests that all the influence of glucose on nitrite detection can be quantified if Cglucose is known. Accordingly, the jp,red obtained in a mixed solution of glucose and nitrite can be obtained by subtracting kCglucose from eqn (7):
 | (8) |
The simultaneous detection of both glucose and nitrite was carried out on a partitionally modified electrode by using one channel of a double-channel electrochemical workstation. There were two modification regions on the electrode, and the region modified with AuNPs was responsible for the detection of glucose while the PtNPs modified region was responsible for the detection of nitrite. The PtNPs/ITO region and the AuNPs/ITO region were connected by wires and this dual-region electrode was used to record the CV response in the mixed solution of glucose and nitrite. A typical CV response is shown in Fig. 6a. As we mentioned above, nitrite does not interfere with the detection of glucose, and therefore, Cglucose can be directly obtained by measuring the oxidation peak current at about 0.10 V in Fig. 6a. According to eqn (8), the nitrite concentration CNO2− can then be calculated by introducing the nitrite reduction peak current and the value of Cglucose that was obtained from the oxidation peak current.
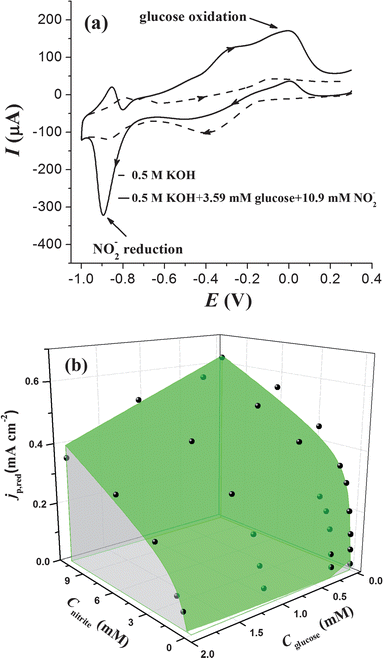 | ||
| Fig. 6 (a) CV curves recorded at a dual-region modified electrode with a potential sweep rate of 0.1 V s−1 in 0.5 M KOH (dashed line) and in 0.5 M KOH with 3.59 mM glucose and 10.9 mM nitrite (solid line). (b) The theoretical calibration surface of the reduction current peak of nitrite as a function of nitrite and glucose concentrations. The black spots represent the experimental data. | ||
According to the above discussion, it is clear that we need first to obtain the value of k before we use eqn (8) to calculate CNO2−. To obtain a precise k value, the linear correlation between jp,red and Cglucose was systematically studied at different nitrite concentrations, and the results show that, for all the nitrite concentrations examined, jp,red is linearly dependent on Cglucose with a constant slope of −0.120 A cm−2 M−1 (see ESI†). The constant slope provides further evidence that eqn (8) well describes the variation of jp,red with CNO2− and Cglucose. Therefore, introducing k = 0.120 A cm−2 M−1 into eqn (8), we obtain:
 | (9) |
Simultaneous detection results of artificial samples are shown in Table 1. The results reveal that the relative errors are in the range of 2.69–6.57% for glucose and 5.34–10.5% for nitrite. It should be pointed out that when the glucose concentration is high enough to counterbalance the nitrite reduction peak, simultaneous detection cannot be fulfilled. The dual-region modified electrode shows good reproducibility with the relative standard deviation less than 3% for five repeated measurements in the solution containing glucose and nitrite. Furthermore, the stability of dual-region modified electrode was also investigated. The freshly prepared electrodes exhibited higher sensitivity, and when they were used a second time, the current response decreased about 20% and 10% for nitrite and glucose, respectively. Several runs of detection indicates that the response of the electrodes remains almost the same as that of the second run, even though the electrodes were kept in dry air under environment temperature for one week. These results suggest an excellent stability for the dual-region modified electrodes.
Conclusions
The dual-region modified electrodes have been prepared by partitioned electrodeposition of AuNPs and PtNPs on an ITO substrate for simultaneous detection of glucose and nitrite. The AuNPs modified region was used to detect glucose while the PtNPs modified region was used to detect nitrite. The electrochemical oxidation of glucose at AuNPs/ITO shows four oxidation peaks in CV experiments, and the oxidation peak at about 0.10 V is suitable for quantitative glucose detection. The kinetics of electroreduction of nitrite at PtNPs/ITO is believed to be controlled by both surface adsorption and diffusion. A theoretical model, which can quantitatively describe the peak current density of nitrite reduction, was proposed and used to calculate nitrite concentration. The dual- or multi-region modified electrodes are desirable for the development of integrated electrode systems that are expected to have more than one detection functions. We believe that the strategy described in this work opens a new avenue for the development of electrochemical sensors in simultaneous dual- or multi-component detection.Acknowledgements
We gratefully acknowledge the financial support of this work by National Natural Science Foundation of China (NSFC 20973020, 20773007 and 21173016), Doctoral Fund of Ministry of Education of China (20101102110002), Program for New Century Excellent Talents in University (NCET-08-0034), Program for Changjiang Scholars and Innovative Research Team in University (IRT 0805), and Innovation Foundation of BUAA for PhD Graduates.Notes and references
- B. A. Snopok and I. V. Kruglenko, Thin Solid Films, 2002, 418, 21–41 CrossRef CAS
.
-
(a) K. Miyazaki, G. Matsumoto, M. Yamada, S. Yasui and H. Kaneko, Electrochim. Acta, 1999, 44, 3809–3820 CrossRef CAS
; (b) Y. Li, P. Wang, L. Wang and X. Lin, Biosens. Bioelectron., 2007, 22, 3120–3125 CrossRef CAS
; (c) R. N. Goyal, V. K. Gupta, M. Oyama and N. Bachheti, Talanta, 2007, 72, 976–983 CrossRef CAS
.
-
(a) J. R. Stetter, P. C. Jurs and S. L. Rose, Anal. Chem., 1986, 58, 860–866 CrossRef CAS
; (b) Q. Chen, J. Wang, G. Rayson, B. Tian and Y. Lin, Anal. Chem., 1993, 65, 251–254 CrossRef CAS
; (c) K. J. Albert, N. S. Lewis, C. L. Schauer, G. A. Sotzing, S. E. Stitzel, T. P. Vaid and D. R. Walt, Chem. Rev., 2000, 100, 2595–2626 CrossRef CAS
.
-
(a) N. T. Greene and K. D. Shimizu, J. Am. Chem. Soc., 2005, 127, 5695–5700 CrossRef CAS
; (b) Y. Vlasov, A. Legin, A. Rudnitskaya, C. Dinatale and A. D'amico, Pure Appl. Chem., 2005, 77, 1965–1983 CrossRef CAS
.
- R. S. Glass, S. P. Perone and D. R. Ciarlo, Anal. Chem., 1990, 62, 1914–1918 CrossRef CAS
.
- J. Wang, G. D. Rayson, Z. Lu and H. Wu, Anal. Chem., 1990, 62, 1924–1927 CrossRef CAS
.
-
(a) S. P. Fodor, J. L. Read, M. C. Pirrung, L. Stryer, A. T. Lu and D. Solas, Science, 1991, 251, 767–773 CAS
; (b) X. Sun and K. D. Gillis, Anal. Chem., 2006, 78, 2521–2525 CrossRef CAS
; (c) X. M. Lin, R. Parthasarathy and H. M. Jaeger, Appl. Phys. Lett., 2001, 78, 1915–1917 CrossRef CAS
.
-
(a) J. Tien, A. Terfort and G. M. Whitesides, Langmuir, 1997, 13, 5349–5355 CrossRef CAS
; (b) D. Qin, Y. Xia, B. Xu, H. Yang, C. Zhu and G. M. Whitesides, Adv. Mater., 1999, 11, 1433–1437 CrossRef CAS
; (c) L. Yan, X.-M. Zhao and G. M. Whitesides, J. Am. Chem. Soc., 1998, 120, 6179–6180 CrossRef CAS
; (d) X. Yan, J. Yao, G. Lu, X. Chen, K. Zhang and B. Yang, J. Am. Chem. Soc., 2004, 126, 10510–10511 CrossRef CAS
.
- B. E. Baker, N. J. Kline, P. J. Treado and M. J. Natan, J. Am. Chem. Soc., 1996, 118, 8721–8722 CrossRef CAS
.
- P. Diao, M. Guo, Q. C. Hou, M. Xiang and Q. Zhang, J. Phys. Chem. B, 2006, 110, 20386–20391 CrossRef CAS
.
- P. Diao, D. F. Zhang, M. Guo and Q. Zhang, J. Catal., 2007, 250, 247–253 CrossRef CAS
.
-
(a) M. Tominaga, T. Shimazoe, M. Nagashima and I. Taniguchi, Electrochem. Commun., 2005, 7, 189–193 CrossRef CAS
; (b) Y. Bai, W. Yang, Y. Sun and C. Sun, Sens. Actuators, B, 2008, 134, 471–476 CrossRef
; (c) M. Pasta, R. Ruffo, E. Falletta, C. M. Mari and C. D. Pina, Gold Bull., 2010, 43, 57–64 CrossRef CAS
; (d) S. B. Aoun, Z. Dursun, T. Koga, G. S. Bang, T. Sotomura and I. Taniguchi, J. Electroanal. Chem., 2004, 567, 175–183 CrossRef
.
-
(a) F. Xu, K. Cui, Y. Sun, C. Guo, Z. Liu, Y. Zhang, Y. Shi and Z. Li, Talanta, 2010, 82, 1845–1852 CrossRef CAS
; (b) H. Qiu and X. Huang, J. Electroanal. Chem., 2010, 643, 39–45 CrossRef CAS
.
-
A. J. Bard and L. R. Faulkner, Electrochemical Methods Fundamentals and Applications, John Wiley & Sons, Inc, New York, 2nd edn, 2003 Search PubMed
.
-
(a) S. Park, T. D. Chung and H. C. Kim, Anal. Chem., 2003, 75, 3046–3049 CrossRef CAS
; (b) J. S. Ye, Y. Wen, W. D. Zhang, L. M. Gan, G. Q. Xu and F. S. Sheu, Electrochem. Commun., 2004, 6, 66–70 CrossRef CAS
; (c) W. Zhao, J.-J. Xu, C.-G. Shi and H.-Y. Chen, Electrochem. Commun., 2006, 8, 773–778 CrossRef CAS
; (d) F. F. Zhang, Q. Wan, X. L. Wang, Z. D. Sun, Z. Q. Zhu, Y. Z. Xian, L. T. Jin and K. Yamamoto, J. Electroanal. Chem., 2004, 571, 133–138 CrossRef CAS
; (e) H. Zhang, J.-J. Xu and H.-Y. Chen, J. Phys. Chem. C, 2008, 112, 13886–13892 CrossRef CAS
; (f) T.-K. Huang, K.-W. Lin, S.-P. Tung, T.-M. Cheng, I. C. Chang, Y.-Z. Hsieh, C.-Y. Lee and H.-T. Chiu, J. Electroanal. Chem., 2009, 636, 123–127 CrossRef CAS
; (g) L. Meng, J. Jin, G. Yang, T. Lu, H. Zhang and C. Cai, Anal. Chem., 2009 Search PubMed
.
-
(a) B. A. L. de Mishima, D. Lescano, T. M. Holgado and H. T. Mishima, Electrochim. Acta, 1998, 43, 395–404 CrossRef
; (b) J. F. E. Gootzen, A. H. Wonders, W. Visscher, R. A. van Santen and J. A. R. van Veen, Electrochim. Acta, 1998, 43, 1851–1861 CrossRef CAS
.
-
(a) G. Horanyi and E. M. Rizmayer, J. Electroanal. Chem., 1985, 188, 265–272 CrossRef CAS
; (b) S. Ye, H. Hattori and H. Kita, Ber. Bunsen-Ges. Phys. Chem., 1992, 96, 1884–1886 CAS
; (c) S. Wasmus, E. J. Vasini, M. Krausa, H. T. Mishima and W. Vielstich, Electrochim. Acta, 1994, 39, 23–31 CrossRef CAS
.
-
(a) B. Beden, F. Largeaud, K. B. Kokoh and C. Lamy, Electrochim. Acta, 1996, 41, 701–709 CrossRef CAS
; (b) F. Largeaud, K. B. Kokoh, B. Beden and C. Lamy, J. Electroanal. Chem., 1995, 397, 261–269 CrossRef
; (c) H.-W. Lei, B. Wu, C.-S. Cha and H. Kita, J. Electroanal. Chem., 1995, 382, 103–110 CrossRef
.
Footnote |
| † Electronic supplementary information (ESI) available: Electrochemical determination of the real surface area of AuNPs and PtNPs; scanning electron microscopic characterization; typical SEM images and size distribution histograms of AuNPs and PtNPs; the dependence of nitrite reduction peak current density on potential sweep rate; the variation of the nitrite reduction peak current density as a function of glucose concentration in 0.5 M KOH. See DOI: 10.1039/c1an15758b |
| This journal is © The Royal Society of Chemistry 2012 |
