Characterizing the dual-wavelength dye indo-1 for calcium-ion sensing under pressure
Jordan
Ryan
a and
Paul
Urayama
*b
aDepartment of Physics, Miami University, Oxford, OH 45056, USA
bDepartment of Physics, Miami University, Oxford, OH 45056, USA. E-mail: urayampk@muohio.edu; Fax: +1 (513) 529-5629; Tel: +1 (513) 529-9274
First published on 19th October 2011
Abstract
Indo-1 is a dual-wavelength fluorophore widely used for calcium-ion sensing at ambient pressure. Because understanding the physico-chemical nature of high-pressure effects on probe dyes extends the range over which quantitative sensing is possible and informs the development of more robust probes, we report the high-pressure characterization of indo-1 for potential use in calcium-ion sensing under pressure. We find that indo-1 emission remains consistent with a two-state binding model when pressurized to 510 atm, accompanied by a decrease in calcium-binding affinity and an observation of piezochromic behavior. An estimate of the thermodynamic volume change of the indo-1 calcium dissociation reaction is consistent with values for other metal-ion chelators, and piezochromic shifts appear to be due to a pressure-induced change in solvent polarity versus a change in solvent viscosity. The two-state behavior and the linear response of parameters needed for dye calibration makes indo-1 amenable for use under pressure.
Introduction
Recent reviews have highlighted the scientific and technological importance of pressure effects on biological systems with applications in the food, pharmaceutical, biomedical, and biotechnological fields.1–7 Because ions play a central role in biochemical processes, the quantitative sensing of metabolic ions under pressure is of general interest to the development of these fields.Metabolic ions are routinely sensed at ambient pressure using fluorescent dyes.8 When pressurized however, the dye's ion-binding equilibrium and optical properties may be affected with possible errors in interpreting the dye signal as large as the pressure effect itself.9 Thus understanding the physico-chemical nature of high-pressure effects on probe dyes extends the range over which quantitative sensing may be possible and may inform the development of more robust probes.
For dyes that maintain two-state binding behavior, pressure effects on the thermodynamics of the reaction is readily modeled. For example, probe dyes for sensing near-neutral and acidic pH have been characterized and validated up to 600 atm9,10 (1 atm = 101.3 kPa), a pressure range suitable for investigating pressure effects on a large range of cellular processes.11,12 In addition to pH, probe dyes for divalent ions like calcium are of interest because calcium plays a significant role in biological signaling13,14 with a possible role in pressure-specific responses.15 Previously, calcium-sensitive dyes fluo-4 ({[2- (2- {2- [bis(carboxymethyl)amino]- 5- (2,7- difluoro- 6- hydroxy- 3- oxo- 3H- xanthen- 9- yl)phenoxy}ethoxy)- 4- methylphenyl](carboxymethyl)amino}acetic acid) and fluo-5F ({[2- (2- {2- [bis(carboxymethyl)amino]- 5- (2,7- difluoro- 6- hydroxy- 3- oxo- 3H- xanthen- 9- yl)phenoxy}ethoxy)- 4- fluorophenyl](carboxymethyl)amino}acetic acid) (Fig. 1), which use emission intensity as the sensing parameter, have been evaluated for sensing under pressure.16 These dyes, consisting of metal-chelating and fluorescent moieties, retain two-state binding behavior under pressure and show no pressure-induced change in the emission spectra. There is however a decrease in the calcium binding affinity when pressurized.
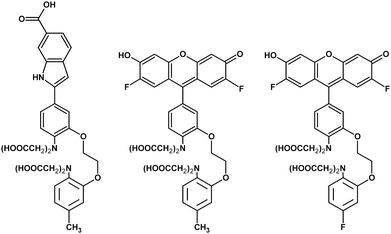 | ||
| Fig. 1 Chemical structures of indo-1, fluo-4, and fluo-5F (left to right, respectively). | ||
We contrast these results by presenting the high-pressure characterization of indo-1 (2-[4-(bis(carboxymethyl)amino)-3-[2-[2-(bis(carboxymethyl)amino)- 5-methylphenoxy]ethoxy]phenyl]-1H-indole-6-carboxylic acid) (Fig. 1), significant because it is a widely used dual-wavelengthdye for calcium-ion sensing. Dual-wavelength dyes reduce problems of quantification associated with optical scattering, local variations in probe concentration, and photobleaching.17 We find that indo-1 emission remains consistent with a two-state binding model when pressurized to 510 atm, accompanied by a decrease in calcium-binding affinity. An estimate of the thermodynamic volume change of the indo-1 calcium dissociation reaction is consistent with values for other metal-ion chelators. Further indo-1 exhibits piezochromic behavior. Shifts vary linearly with pressure in this range and appear to be due to a pressure-induced change in solvent polarity versus a change in solvent viscosity.
Interpreting dye emission
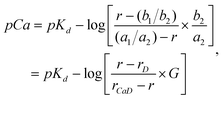
Presented in detail elsewhere,16,18 we outline a model for interpreting dye emission in a dual-wavelength sensing mode. Given the dissociation reaction CaD ↔ Ca2+ + D, where CaD and D are the calcium-bound and free forms of the dye, the dissociation constant Kd and the free calcium ion concentration [Ca2+] are related to the dye concentrations by a Henderson-Hasselbalch-type equation, | (1) |
Next, a model is used to relate [CaD]/[D] to the measured emission spectrum. In the dilute-dye limit, the total emission is the linear combination of emission from the bound and unbound forms, so
 | (2) |
 | (3) |
For a two-state reaction, pressure effects on the dissociation constant are modeled as
 | (4) |
Methods and materials
Indo-1, first described by Grynkiewicz et al.,18 was purchased from Invitrogen (cat no. I-1202) in its free-salt form and used without additional purification. Dye stock solutions were prepared by dissolving in deionized water and were stored in the dark at 4 °C.We control free calcium-ion concentration by using calibration buffer kits (cat. no. C-3008MP, Invitrogen) containing 10 mM EGTA (ethylene glycol tetraacetic acid, or 2,2′,2′′,2′′′-[ethane-1,2-diylbis(oxyethane-2,1-diylnitrilo)]tetraacetic acid), 100 mM KCl, 30 mM MOPS (3-(N-morpholino)propanesulfonic acid, or 3-morpholin-4-ylpropane-1-sulfonic acid), pH 7.2. The kits consist of calcium-free and 39-μM-calcium components which are combined in varying ratios to obtain buffered solutions between pCa 4.4 and 9.0. Calcium ion concentrations were not independently confirmed using an ion-selective electrode due to the low calcium-ion concentrations involved, however the measured pKd of indo-1 at ambient pressure was in close agreement with the literature.18 Final samples were prepared at a concentration of 5 μM dye in the calcium-buffered solutions, confirmed to be a concentration for which emission intensity was linear with dye concentration. Although not actively regulated, the temperature was measured to be 293 ± 2 K.
Excited-state emission spectra were collected using a custom-built high-pressure spectrofluorimeter system. The excitation source was a nitrogen discharge laser (model GL-3300, Photon Technology International) emitting at 337-nm wavelength. The sample was mounted on a Zeiss Axiovert 40 inverted fluorescence microscope, utilizing a Zeiss 40x LD A-Plan microscope objective. Despite being capable of epi-illumination, the sample was illuminated from the top with light delivered to the sample via fiber optic because microscope optics were observed to fluoresce when exposed to the UV laser light. Sample emission was collected from the microscope's video port then delivered via fiber optic to a spectrograph (model MS 125, Spectra-Physics/Newport) coupled to a gated intensified CCD (ICCD) (model iStar 734, Andor). The spectrograph utilized a 400-lp/mm grating, and the spectrograph-ICCD system had a measured spectral resolution of 2 nm over a 250-nm wavelength range. An ICCD gate width of 80 μs was used to reject ambient light during spectrum acquisition. Background was removed and a full spectrum was collected for each excitation pulse without the need for scanning, although spectra were averaged over multiple pulses to improve signal to noise.
The sample was housed in a high-pressure microscopy imaging chamber used as a spectroscopic cell.19 The chamber consisted of a 1.5 mm × 0.5 mm outer-to-inner diameter quartz capillary (cat. no. Q150-50-7.5, Sutter Instrument) epoxy-sealed to stainless-steel tubing. The chamber was flushed with several chamber-volumes of deionized water, dried, then overfilled with sample before sealing. The pressurizing medium was a 50–50 ethanol/deionized water mixture. Contact between the medium and sample was made at least 0.5 m downstream from the probe region, ensuring that no pressurizing medium mixed with the sample. Pressure was measured using a Bourdon strain gauge (cat. no. 6PG30, High Pressure Equipment). Samples were subject to various pressures up to 7500 psi (510 atm), equilibrated at a given pressure for at least 5 min.
The intensity ratio r was determined by integrating over 10-nm wavelength windows centered at 445 nm and 490 nm, which were the approximate peak-intensity wavelengths for the calcium-bound and unbound forms of indo-1 (Fig. 2). Pressure effects on emission spectra were reversible.
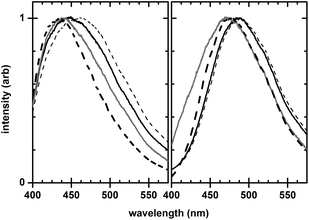 | ||
| Fig. 2 Excited-state emission spectra of indo-1 showing the piezochromic and solvatochromic nature of the calcium-bound (low pCa, left) and calcium-unbound (high pCa, right) forms, taken under the following conditions: 1 atm (solid black line), 510 atm (thin dashed line), 30 vol% glycerol (solid grey line), and 30 vol% methanol (thick dashed line). Samples are 5 μM indo-1 at 337-nm wavelength excitation; specific preparation details are described in the text. Spectra have been normalized to the peak intensity, and have not been smoothed. | ||
Results and discussion
Fig. 3 shows intensity ratios versus pressure for samples made at various pCa. Intensity ratios fit the two-state model (eqn (3)) well at both ambient and high pressures, and the response of intensity ratios is linear within this pressure range.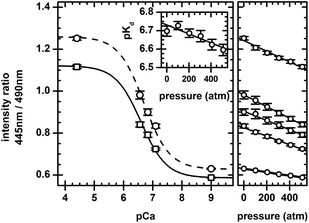 | ||
| Fig. 3 Intensity ratio versus pCa (left plot) and pressure (right plot) for 5 μM indo-1 in EGTA buffer. For the intensity ratio versus pCa plot, 1 atm (circle) and 510 atm (square) values are shown. 1-atm (dashed line) and 510-atm (solid line) fits to a two-state model (eqn (3)) are shown. pCa values have not been corrected for pressure-induced changes in pCa; discussions are in the text. The insert shows the pKd for indo-1versus pressure, along with a linear fit to the values. For the intensity ratio versus pressure plot, values correspond to samples used in the intensity ratio versus pCa plot. Linear fits are shown. All error bars are the standard deviation of multiple measurements. | ||
Estimation of thermodynamic volume change
To investigate whether the pressure-dependent shift in pKd is consistent with that of other metal-ion chelators, we estimate ΔV for the indo-1 calcium-dissociation reaction. Using pressure-dependent values for rCaD, and rD, we use eqn (3) to calculate pKd (and hence ΔV, using eqn (4)) as a function of pressure. Using this approach, the apparent volume change was −17.2 ± 3.2 ml mol−1, the uncertainty being the standard deviation calculated from measurements on multiple samples. Note that G was fixed at unity during the analysis for the reason that pKd and G cannot be determined independently. Regardless, G = 1 is approximately correct; the pKd for indo-1 obtained here at ambient pressure is similar to the literature value pKd = 6.6.18 Fixing G to a constant does not invalidate the estimate of ΔV because it is the rate of change in pKd upon pressurization that is relevant in eqn (4).We have neglected, however, to account for a pressure-dependent pCa; the dissociation constant of the chelator EGTA (pKEGTA) depends on pH and pressure.20,21 We estimate the pH change upon pressurization using
 | (5) |
Pressure also affects pKEGTA due to a thermodynamic volume change associated with EGTA's calcium dissociation reaction. Hasselbach and Stephan20 measured this at −20.4 ml mol−1 (pH 8.0, 20 °C), meaning the reaction favors dissociation under pressure. Thus pCa decreases upon pressurization, suggesting the change in pKd shown in Fig. 3 is an underestimation since the bufferpCa decreases upon pressurization.
By including these effects, the estimate for the ΔV for indo-1 becomes (−17.2 ml mol−1) + (+14.1 ml mol−1) + (−20.4 ml mol−1) = ca. −23.5 ml mol−1, comparable to ΔV values of other metal-ion chelators.20
Piezochromicity in indo-1
While the demonstration of two-state behavior (Fig. 3) evidences the analytic utility of indo-1 under pressure, additional insight is obtained by considering the piezochromic response of indo-1.Fig. 3 shows that intensity ratios for the lowest and highest pCa samples (pCa 4.4 and 9.0, respectively) are pressure dependent. Because these pCa's are well-removed from the dye's pKd, this dependence is not due to a shifting calcium-binding equilibrium, but rather to changes in the excited-state emission upon pressurization. Fig. 2 shows that the piezochromic shift is bathochromic for both low and high pCa forms of indo-1, with average shifts of +2.84 nm per 100 atm and +0.46 nm per 100 atm in the low and high pCa forms respectively.
We investigate the origins of this piezochromic behavior by considering the effects of methanol and propan-1,2,3-triol (glycerol) on indo-1 emission. These solvents have a large difference in viscosity (0.544 mPa·s for methanol, 943 mPa·s for glycerol, at 25 °C22), while having have similar dielectric constants (33.0 for methanol, 46.5 for glycerol, compared with 80.1 for water22), allowing us to distinguish between solvent-relaxation and dynamical effects on dye emission.
Solutions were made by mixing equal volumes of the EGTA calcium buffer with a mixture of either methanol or glycerol (both spectroscopic grade) in deionized water for samples that were either 30 vol% methanol or 30 vol% glyercol. The final dye concentration was 5 μM. Solvent-effect measurements were made at ambient pressure.
Fig. 2 shows spectra for both low and high pCa solutions with methanol and with glycerol, along with spectra obtained at 1 atm and 510 atm pressure. Note that the addition of either methanol or glycerol, both of which have comparable dielectric constants smaller than water, leads to a hypsochromic shift in indo-1 emission. Because shifts are comparable for both methanol- and glycerol-containing samples, solvent polarity appears to have a larger effect on indo-1 emission shifts than does solvent viscosity. Given that increasing pressure results in a bathochromic shift in indo-1 emission and that increasing pressure increases the dielectric constant of water,23 a pressure-induced change in solvent polarity as opposed to a pressure-induced change in solvent viscosity appears to be the reason for piezochromic shifts in indo-1.
The argument was checked for consistency by investigating whether intensity-based calcium-sensitive dyes fluo-4 and fluo-5F (Fig. 1, described previously in the literature24,25), which do not exhibit piezochromic shifts,16 have solvatochromic shifts in methanol- or glycerol-containing solutions. Similar to indo-1, fluo-dyes have a BAPTA-like calcium chelating moiety, however, have a fluorescein-like rather than an indole-like fluorophore. (BAPTA (1,2-bis(o-aminophenoxy)ethane-N,N,N′,N′-tetraacetic acid, or 2,2′,2′′,2′′′-[ethane-1,2-diylbis(oxy-2,1-phenylenenitrilo)]tetraacetic acid) is a calcium-specific chelator.) Solutions of fluo-4 and fluo-5F containing 30 vol% methanol or 30 vol% glycerol where prepared in a manner identical to the corresponding indo-1 solutions, with samples excited at 500-nm wavelength, rather than at 337-nm wavelength, using a nitrogen-laser-pumped dye laser as the excitation source.16 That the probe dyes that lack piezochromic behavior, fluo-4 and fluo-5F, also lack solvatochromic shifts (Fig. 4) suggests a framework with which to understand the overall solvato- and piezochromic responses in calcium-sensitive probe dyes—that the mechanism leading to solvatochromic shifts also accounts for piezochromic behavior. Studies on indole and its derivatives in a viscous solvent confirm that solvatochromic shifts are due to solvent relaxation.26 Analogous mechanisms may be at play for indo-1. By comparison, the lack of solvatochromic shifts in the fluo-dyes may be due to the symmetry of fluorophore, resulting in similar dipole moments for the ground and excited states.
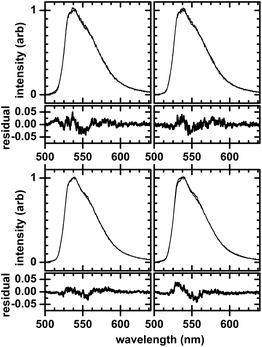 | ||
| Fig. 4 Emission spectra showing the absence of solvatochromic behavior in intensity-based fluo-4 (top row) and fluo-5F (bottom row) dyes. Solvents used are 30 vol% methanol (left column) and 30 vol% glyercol (right column). Two spectra, both with and without either methanol or glyercol, are shown on each plot and have been scaled to intensity. Residual plots are shown underneath each spectra; the spectrum without either methanol or glycerol is the reference. All spectra are of 5 μM dye at 500-nm wavelength excitation. | ||
Although it is the case here that the dual-wavelength dye is piezochromic and the intensity-based dyes are not, we note that not all dual-wavelength dyes are piezochromic.16
Considerations for indo-1 use under pressure
Findings reported here facilitate the use of indo-1 under pressure. For example, by confirming that indo-1 retains two-state binding behavior under pressure, eqn (3) can used when interpreting the excited-state emission response to calcium ions. As is the case at ambient pressure, a minimum three-point calibration is needed if the probe dye is used at a fixed, high pressure since the two-state model does not have an explicit pressure dependence. For a pressure-dependent calibration, findings here confirm that linear modeling of pressure-sensitive parameters, rCaD, rD, and pKd (Fig. 3), is a reasonable approximation for this physiologically-relevant pressure range, suggesting a minimum six-point calibration.Whether high-pressure corrections are needed when interpreting the emission spectrum depends on the level of quantification required of the measurement. Note that for a reaction with ΔV = +10 ml mol−1, ΔpK = +0.017 per 100 atm at 295 K (eqn (4)). Biochemical reactions typically have thermodynamic volume changes 1,6 comparable to those of probe dyes, and so pressure effects on probe dyes are significant.
Conclusions
Ions play a central role in biochemical processes; therefore, the quantitative sensing of metabolic ions under pressure is of general interest to high-pressure bioscience and biotechnology fields. Indo-1 is widely used at ambient pressure as a dual-wavelength dye for calcium-ion sensing. Because pressurization may affect its calcium-binding equilibrium and optical properties, we report the high-pressure characterization of indo-1 for potential use in calcium-ion sensing under pressure.Fig. 3 illustrates how indo-1 emission remains consistent with a two-state binding model when pressurized to 510 atm. A decrease in calcium-binding affinity and piezochromic behavior is observed upon pressurization. An estimate of the thermodynamic volume change of the indo-1 calcium dissociation reaction (ca. −23.5 ml mol−1) is consistent with values for other metal-ion chelators, and piezochromic shifts appear to be due to a pressure-induced change in solvent polarity versus a change in solvent viscosity (Fig. 2).
While pressure does affect dye operation, effects can be modeled, and the pressure response of measurement parameters needed for dye calibration varies linearly in this pressure range. Results are useful either in the quantitative sensing of metabolic ions under pressure, or in the development of new probes for sensing under pressure.
Acknowledgements
This research was supported by an award from the Research Corporation, and by funds from Miami University's College of Arts and Science, Committee on Faculty Research, and Undergraduate Summer Scholars program. This material is based upon work supported by the National Science Foundation under Grant No. 0957675.References
- F. Abe and K. Horikoshi, Trends Biotechnol., 2001, 19, 102 CrossRef CAS.
- M. Podar and A. L. Reysenbach, Curr. Opin. Biotechnol., 2006, 17, 250 CrossRef CAS.
- M. Ferrer, O. Golyshina, A. Beloqui and P. N. Golyshin, Curr. Opin. Microbiol., 2007, 10, 207 CrossRef CAS.
- N. K. Rastogi, K. Raghavarao, V. M. Balasubramaniam, K. Niranjan and D. Knorr, Crit. Rev. Food Sci. Nutr., 2007, 47, 69 CrossRef CAS.
- A. Aertsen, F. Meersman, M. E. G. Hendrickx, R. F. Vogel and C. W. Michiels, Trends Biotechnol., 2009, 27, 434 CrossRef CAS.
- N. Rivalain, J. Roquain and G. Demazeau, Biotechnol. Adv., 2010, 28, 659 CrossRef CAS.
- G. Demazeau and N. Rivalain, J. Appl. Microbiol., 2011, 110, 1359 CrossRef CAS.
- Fluorescent and Luminescent Probes for Biological Activity, ed. W. T. Mason, Academic Press, San Diego, 1999 Search PubMed.
- M. Salerno, J. J. Ajimo, J. A. Dudley, K. Binzel and P. Urayama, Anal. Biochem., 2007, 362, 258 CrossRef CAS.
- H. M. DePedro and P. Urayama, Anal. Biochem., 2009, 384, 359 CrossRef CAS.
- D. H. Bartlett, Biochim. Biophys. Acta, Protein Struct. Mol. Enzymol., 2002, 1595, 367 CrossRef CAS.
- F. Abe, Biosci., Biotechnol., Biochem., 2007, 71, 2347 CrossRef CAS.
- R. W. Tsien and R. Y. Tsien, Annu. Rev. Cell Biol., 1990, 6, 715 CrossRef CAS.
- D. E. Clapham, Cell, 1995, 80, 259 CrossRef CAS.
- O. Friedrich, K. R. Kress, M. Hartmann, B. Frey, K. Sommer, H. Ludwig and R. H. A. Fink, Cell Biochem. Biophys., 2006, 45, 71 CrossRef CAS.
- P. Urayama, E. W. Frey, and S. R. Savage, in High-Pressure Bioscience and Biotechnology - Fifth International Conference, ed. D. H. Bartlett, Annals of the New York Academy of Sciences, 2010, vol. 1189, pp. 104–112 Search PubMed.
- G. R. Bright, G. W. Fisher, J. Rogowska and D. L. Taylor, J. Cell Biol., 1987, 104, 1019 CrossRef CAS.
- G. Grynkiewicz, M. Poenie and R. Y. Tsien, J. Biol. Chem., 1985, 260, 3440 CAS.
- E. C. Raber, J. A. Dudley, M. Salerno and P. Urayama, Rev. Sci. Instrum., 2006, 77, 096106 CrossRef.
- W. Hasselbach and L. Stephan, Zeitschrift Fur Naturforschung C, 1987, 42, 641 CAS.
- D. M. Bers, C. W. Patton and R. Nuccitelli, Methods Cell Biol., 1994, 40, 3 CrossRef CAS.
- Handbook of Chemistry and Physics, ed. D. R. Lide, CRC Press, Boca Raton, 2001 Search PubMed.
- W. B. Floriano and M. A. C. Nascimento, Braz. J. Phys., 2004, 34, 38 CrossRef CAS.
- A. Minta, J. P. Y. Kao and R. Y. Tsien, J. Biol. Chem., 1989, 264, 8171 CAS.
- K. R. Gee, K. A. Brown, W. N. U. Chen, J. Bishop-Stewart, D. Gray and I. Johnson, Cell Calcium, 2000, 27, 97 CrossRef CAS.
- H. Lami and N. Glasser, J. Chem. Phys., 1986, 84, 597 CrossRef CAS.
| This journal is © The Royal Society of Chemistry 2012 |
