DOI:
10.1039/C1AY05523B
(Paper)
Anal. Methods, 2012,
4, 217-221
A specific UPLC-ESI-MS/MS method for analysis of cyadox and its three main metabolites in fish samples
Received
22nd August 2011
, Accepted 12th November 2011
First published on 15th December 2011
Abstract
A rapid and sensitive ultra-performance liquid chromatography tandem mass spectrometry (UPLC-MS/MS) method was developed for the determination of cyadox (CYX) and its three major metabolites, quinoxaline-2-carboxylic acid (QCA), 1-desoxycyadox (1-DCYX) and 1,4-bisdesoxycyadox (BDCYX) in fish. Samples were extracted with acetonitrile–0.5 M hydrochloric acid (9 + 1) and cleaned up using Oasis MAX cartridges. The total time taken for separation by UPLC was less than 5 min. The four target compounds were then determined by ESI-MS/MS. At the fortified levels of 2–50 μg kg−1 in fish, recoveries of all the compounds ranged from 80.2% to 88.2%, with a relative standard deviation of 6.8 to 14.6%. Limits of detection for CYX, QCA, 1–DCYX and BDCYX were 0.52, 1.07, 0.69 and 0.38 μg kg−1, respectively.
1. Introduction
Cyadox (CYX), a synthetic quinoxaline 1,4-dioxide derivative, is a new antimicrobial agent which can effectively improve growth and feed efficiency in animal and fish.1CYX is less toxic than the well known quinoxaline-1,4-dioxides, carbadox (CBX) and olaquindox (OLA).2 Compared to older quinoxaloines CYX is a promising safe and effective candidate for use in animal and fish.3 Presently, more and more CYX is used in cultivated fish and other aquatic products. Some published papers have shown that CYX could be converted into several metabolites in swine.4 The reported main metabolites of cyadox are 1-desoxycyadox (1-DCYX), 4-desoxycyadox (4-DCYX), 1,4-bisdesoxycyadox (BDCYX) and quinoxaline-2-carboxylic acid (QCA).5,6 However, no reports have been published on the study of the metabolites of CYX in fish. For practice use and food safety concerns, it is necessary to develop sensitive and accurate methods for the quantification of CYX and its metabolites(Fig.1) in fish.
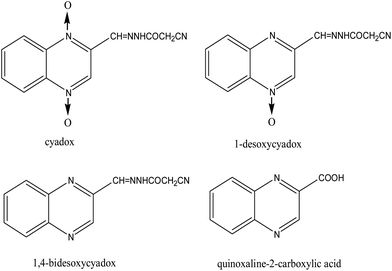 |
| | Fig. 1 Chemical structures of cyadox and its three metabolites. | |
No liquid chromatography-mass spectrometry (LC-MS) methods have been reported for the simultaneous determination of CYX and its three metabolites in bio-samples. The reported chromatographic methods only concerned high-performance liquid chromatography (HPLC). Two papers have been published on the analysis of CYX in animal feeds but no metabolites were mentioned.4,7 Three papers have been published on the determination of CYX and its two main metabolites, BDCYX and QCA in swine plasma, chicken plasma, swine tissues, chicken tissues and goat tissues.1,5–9 However, all these methods involved an independant and different extraction and clean-up procedure for QCA than that used for CYX and BDCYX. These methods were time consuming and have low sample throughput. Additionally, 1-DCYX was not included in these methods, even though it is also important in the metabolism of CYX.
The purpose of this study was to develop a rapid and sensitive UPLC-MS/MS method for the quantitative analysis of CYX and its three main metabolites, 1-DCYX, BDCYX and QCA in fish. All compounds should be simultaneously extracted, cleaned-up, separated and detected in a single procedure. The present method should be suitable for routine analytical purposes.
2. Experimental
2.1. Chemicals and reagents
CYX (99.5%) was obtained from the College of Veterinary Medicine, Huazhong Agricultural University (Wuhan, China). Quinoxaline-2-carboxylic acid (97%) was purchased from Sigma-Aldrich (Milwaukee, WI, USA). 1-Desoxycyadox (97%) was synthesized at the College of Science, China Agricultural University (Beijing, China). Acetonitrile and formic acid were both of HPLC grade and were purchased from Dima Technology Inc. (Muskegon, MI, USA). Water was purified with a Milli-Q system (Millipore, MA, USA). Hydrochloric acid and other reagents were of analytical grade and were supplied by Beijing Reagent Corporation (Beijing, China).
2.3. Instrumentation and chromatographic conditions
The analysis was performed on an ACQUITY UPLC™ system (Waters Co., MA, USA), coupled with a Quattro LC triple quadrupole tandem mass spectrometer equipped with a Z-spray ESI interface (Micromass, Manchester, UK). The chromatographic separation was accomplished with an ACQUITYUPLC™ BEH C18 column (50 mm × 2.1 mm i.d., 1.7 μm particle size; Waters, Milford, MA, USA) at a column temperature of 30 °C. The flow rate was 0.3 mL min−1. Elution solvents used were 0.1% formic acid (A) and methanol/0.1% formic acid in water (B) with the following gradient: 0, 90% B; 0–3 min, linear increase to 70% B; 3–5 min, linear decrease to 90% B. The injection volume was 10 μL. An auto sampler was used for injection.
Analytes were detected in multiple react monitoring (MRM) mode by positive electrospray ionization (ESI+). Capillary voltage 2.5 kV, desolvation gas flow 475 L h−1, desolvation temperature 300 °C, source temperature 300 °C and collision gas (argon) 25 L h−1 were selected for analysis after optimization. The precursor and product ions are listed in Table 1, together with the other optimum mass spectrometric parameters. A 0.3 s scan time was used for data acquisition.
Table 1 Accurate mass measurements of molecular ions of target compounds in a standard solution in ESI+ mode
| Peak no. |
Compound |
Elemental composition |
Retention time (min) |
Parent ion (m/z) |
Daughter ions (m/z) |
Cone voltage (V) |
Collision energy (eV) |
| 1 |
CYA |
C12H10N5O3 |
1.52 |
272.10 |
188.06 |
40 |
35 |
| 238.09 |
38 |
32 |
| 2 |
QCA
|
C9H7N2O2 |
1.79 |
175.05 |
129.05 |
40 |
35 |
| 157.05 |
40 |
33 |
| 3 |
1-DCYA
|
C12H10N5O2 |
2.35 |
256.10 |
172.07 |
40 |
36 |
| 215.07 |
39 |
32 |
| 4 |
BDCYA
|
C12H10N5O
|
3.30 |
240.10 |
156.07 |
40 |
35 |
| 199.08 |
40 |
33 |
An homogenized sample (2 g) was weighed into a 50 mL polypropylene centrifuge tube. 10 mL of acetontrile–0.2 mol L−1hydrochloric acid (9 + 1) was added to the tube. The mixture was vortexed for 2 min and centrifuged for 15 min at 6000g. The supernatant was collected into a pear-shaped flask. The extraction was repeated with another 10 mL of acetontrile–0.2 mol L−1hydrochloric acid (9 + 1). The combined extract was evaporated to dryness at 40 °C. 300 μL of methanol was added to the pear-shaped flask and the flask was vortexed for 2 min. Then 10 mL of 0.2 mol L−1phosphate buffer was added into the same pear-shaped flask and the flask was vortexed to dissolve the residue. The mixed solution was ready for purification by solid phase extraction (SPE).
Oasis MAX SPE cartridges were conditioned with 3 mL of methanol followed by 5 mL of phosphate buffer (0.2 M, pH 7.6). The prepared sample was aspirated through the cartridge. Column washing was carried out with 3 mL of water. Sample elution was effected with 3 mL of acetonitrile containing 2% formic acid. The eluant was evaporated to dryness under a stream of nitrogen in a 40 °C water bath. 1 mL of acetonitrile containing 0.1% formic acid was added to the sample tube followed by mixing for 1 min. The sample was filtered through an HPLC-filter (Gelman GHP, Acrodisc 13 mm, 0.2 μm). 10 μL of sample was injected into the UPLC-MS/MS system.
2.6. Calibration
Analytical standards of 2, 10, 20, 40,100, 200, 1000 μg L−1 were prepared from 10 μg mL−1 of a mixed standard solution of CYX, 1-DCYX BDCYX and QCA, diluted with acetonitrile containing 0.1% formic acid. All analytical standards were injected into the UPLC-MS/MS system to give the calibration curve data.
3. Results and discussion
In previously reported methods, the sample preparation procedure used for QCA was completely different to that used for CYA and BDCYA.5,6 In fact, one of these methods involved the use of two independent extraction and purifying procedures for QCA and the other CYAs thereby increasing the amount of reagent and materials required, and increasing the amount of time taken in comparison with a method suitable for the simultaneous preparation of QCA and the other CYAs. In our research, an acetonitrile–hydrochloric acid mixture was used for the simultaneous extraction of QCA and other CYA compounds. Hydrochloric acid played the role of acidolysis. Then, the sample protein was degenerated by acetonitrile and all the target compounds were extracted effectively. Purification was done simultaneously by SPE. Phosphate buffer was used as a loading solution for two reasons. Firstly for the removal of precipitated proteins before loading. Secondly for outstanding resistance to sample clogging, with no loss of analytes. A MAX SPE column was selected from three kinds of SPE columns (MAX, C18 and HLB) for the best recoveries obtained. The washing and elution conditions were achieved in excellent efficiency.
3.2. Separation and detection
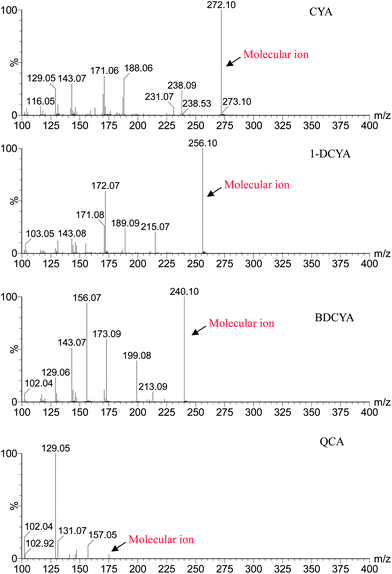
With UPLC, four target compounds were successfully separated in 5 min by gradient elution. Electrospray ionization with positive ion detection was developed for analysis. Initially a full scan was carried out of the mixed standard. Mass spectra of all the compounds are shown in Fig. 2. After carefully optimizing the procedure, MRM monitoring in the MS/MS mode was carried out for detection. A summary of the significant characteristic ions and other MS/MS conditions useful for confirmation of CYXs in swine liver are shown in Table 1. For CYX, the parent ion of m/z 272.10 is fragmented to yield two product ions (m/z 188.06 and m/z 238.09). For 1-DCYX, the parent ion of m/z 256 is fragmented to yield product ions of m/z 172.07 and m/z 215.07. For BDCYX, the parent ion of m/z 240 is fragmented to yield product ions of m/z 156.07 and m/z 199.08. For QCA, the parent ion of m/z 175 is fragmented to yield product ions of m/z 129.05 and m/z 157.05.
3.3. Method validation
To determine the linearity of response working standard calibration curves (n = 5) over the concentration ranges of 2–500 μg L−1 were analysed. Peak areas obtained for seven different concentrations of CYXs were used for calculation. The high values obtained for the correlation coefficients is indicative of the linear relationships between the analyte concentration and the peak area. Correlation coefficients of over 0.99 were obtained. The calibration regression equations are shown in Table 2.
Table 2 Quantitative parameters of cyadox and its three metabolites
| Compound |
Calibration range (μg L−1) |
Calibration curve equation |
r
2
|
LOD (μg kg−1) |
LOQ (μg kg−1) |
| CYA |
2–500 |
y = 222.52x − 1429.1 |
0.9992 |
0.52 |
1.73 |
|
QCA
|
2–500 |
y = 23.356x + 101.13 |
0.9915 |
1.07 |
3.57 |
|
1-DCYA
|
2–500 |
y = 55.233x + 57.696 |
0.9995 |
0.69 |
2.30 |
|
BDCYA
|
2–500 |
y = 509.46x − 7350.6 |
0.9935 |
0.38 |
1.27 |
The limit of detection (LOD) and the limit of quantification (LOQ) for CYXs were established at a signal-noise-ratio (S/N) of 3![[thin space (1/6-em)]](https://www.rsc.org/images/entities/char_2009.gif) :
:![[thin space (1/6-em)]](https://www.rsc.org/images/entities/char_2009.gif) 1 and 10
1 and 10![[thin space (1/6-em)]](https://www.rsc.org/images/entities/char_2009.gif) :
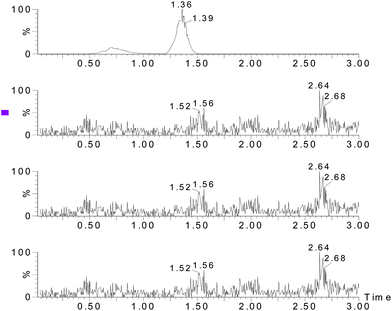
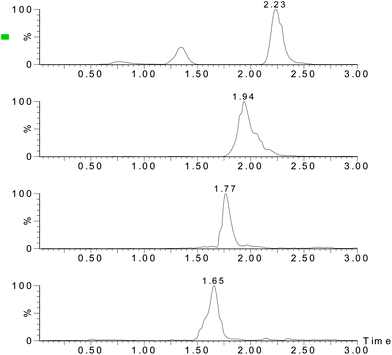
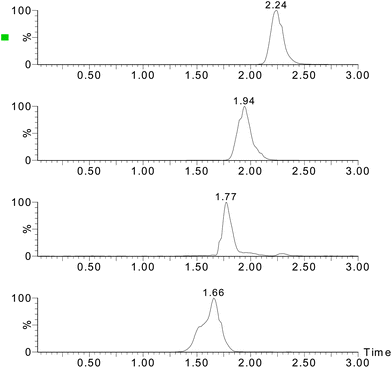
:![[thin space (1/6-em)]](https://www.rsc.org/images/entities/char_2009.gif) 1, respectively. For all four analytes, the LODs ranged from 0.38 to 1.07 μg kg−1 and the LOQ ranged from 1.27–3.57 μg kg−1. Fig. 3–5 show the chromatograms of the control sample, 5 μg kg−1 of spiked sample and standard sample. No interfering peaks are near the four target peaks.
1, respectively. For all four analytes, the LODs ranged from 0.38 to 1.07 μg kg−1 and the LOQ ranged from 1.27–3.57 μg kg−1. Fig. 3–5 show the chromatograms of the control sample, 5 μg kg−1 of spiked sample and standard sample. No interfering peaks are near the four target peaks.
 |
| | Fig. 3
Chromatograms of the blank sample. | |
 |
| | Fig. 4
Chromatograms of the analytes (10 μg kg−1 fortified sample). | |
 |
| | Fig. 5
Chromatograms of the analytes (5 μg mL−1 standard solution). | |
Recoveries and RSDs.
Method accuracy and precision were checked by a spiked study. A stock solution of mixed standard was spiked in blank fish at levels of 5, 10 and 50 μg kg−1, The intra-assay was assessed by performing five repetitions of each level during a single day (n = 5), and the inter-assay was assessed by performing five repetitions of each level per day over three different days. The results of the spiked studies are listed in Table 3. The intra-assay mean recoveries for CYXs ranged from 80.2% to 88.2%, with relative standard deviations of 6.8–14.6%. The inter-assay mean recoveries ranged from 80.1–87.5%, with relative standard deviations of 7.2–13.5%.
Table 3 Intra-day and inter-day accuracy, precision and recovery for quantitation of cyadox and its three metabolisms in swine liver
| Compound |
Spiked conc. (μg kg−1) |
Intra-day repeatability (n = 5) |
Inter-day repeatability (n = 3) |
| Conc. found (mean ± SD, μg kg−1) |
RSD (%) |
Accuracy (%) |
Conc. found (mean ± SD, μg kg−1) |
RSD (%) |
Accuracy (%) |
| CYA |
5 |
1.652 ± 0.221 |
11.05 |
80.7 |
1.634 ± 0.216 |
10.8 |
81.7 |
| 10 |
8.300 ± 0.680 |
6.8 |
83.0 |
8.280 ± 0.728 |
7.2 |
82.8 |
| 50 |
40.850 ± 4.603 |
9.2 |
81.7 |
40.650 ± 4.853 |
9.7 |
81.3 |
|
QCA
|
5 |
1.764 ± 0.206 |
10.3 |
82.6 |
1.750 ± 0.225 |
11 |
80.1 |
| 10 |
8.350 ± 1.461 |
14.6 |
83.5 |
8.420 ± 1.357 |
13.5 |
84.2 |
| 50 |
42.350 ± 4.309 |
8.6 |
84.7 |
42.250 ± 4.150 |
8.3 |
84.5 |
|
1-DCYA
|
5 |
1.606 ± 0.144 |
7.2 |
80.3 |
1.616 ± 0.162 |
8.1 |
80.8 |
| 10 |
8.190 ± 1.170 |
11.7 |
81.9 |
8.163 ± 1.060 |
10.6 |
81.6 |
| 50 |
40.300 ± 5.415 |
10.8 |
80.6 |
40.150 ± 5.601 |
11.2 |
80.3 |
|
BDCYA
|
5 |
1.614 ± 0.270 |
13.5 |
88.2 |
1.622 ± 0.264 |
13.0 |
87.5 |
| 10 |
8.240 ± 1.383 |
13.8 |
82.4 |
8.257 ± 1.292 |
12.9 |
82.5 |
| 50 |
40.100 ± 5.218 |
10.4 |
80.2 |
40.356 ± 5.614 |
11.2 |
80.7 |
Conclusions
A method for the screening and confirmation of cyadox and its three metabolites in fish based on UPLC-MS/MS was developed and validated. Satisfactory recovery rates and RSD values were obtained for the residue analysis. Diluting working standard solutions with extracts of natural medicines is simple and overcomes the matrix enhancement effect. This procedure is useful for the analysis of cyadox and its three metabolites in fish samples.
Acknowledgements
Financial support was obtained from the National Basic Research Program of China (no. 2009CB118801).
References
- Lingli Huang, Yulian Wang, Yanfei Tao, Dongmei Chen and Zonghui Yuan, Development of high performance liquid chromatographic methods for the determination of cyadox and its metabolites in plasma and tissues of chicken, J. Chromatogr., B: Anal. Technol. Biomed. Life Sci., 2008, 874, 7–14 CrossRef CAS.
- Q. He, G. Fang, Y. Wang, Z. Wei, D. Wang, S. Zhou, S. Fan and Z. Yuan, Experimental evaluation of cyadox phototoxicity to Balb/c mouse skin, Photodermatol., Photoimmunol. Photomed., 2006, 22(2), 100–104 CrossRef CAS.
- Yujie Wu, Yulian Wang, Lingli Huang, Yanfei Tao, Zonghui Yuan and Dongmei Chen, Simultaneous determination of five quinoxaline-1, 4-dioxides in animal feeds using ultrasonic solvent extraction and high-performance liquid chromatography, Anal. Chim. Acta, 2006, 569, 97–102 CrossRef CAS.
- Z. Liu, L. Huang, M. Dai, D. Chen, Y. Tao, Y. Wang and Z. Yuan, Metabolism of cyadox in rat, chicken and pig liver microsomes and identification of metabolites by accurate mass measurements using electrospray ionization hybrid ion trap/time-of-flight mass spectrometry, Rapid Commun. Mass Spectrom., 2009, 23(13), 2026–2034 CrossRef CAS.
- Yanling Zhang, Lingli Huang, Dongmei Chen, Shengxian Fan, Yulian Wang, Yanfei Tao and Zonghui Yuan, Development of HPLC methods for the determination of cyadox and its main metabolites in goat tissues, Anal. Sci., 2005, 21, 1495–1500 CrossRef CAS.
- Y. S. Qiu, Z. H. Yuan, Sh. X. Fan, D. C. Liu, L. L. Huang and J. Y. Yin, High performance liquid chromatographic determination of cyadox and its metabolite desoxycyadox in swine plasma and tissues, J. Vet. Sci. (Chinese), 2003, 23(4), 363–365 CAS.
- G. J. Graaf and T. J. Spierenburg, Liquid Chromatographic determination of cyadox in medicated feeds and in the contents of the porcine gastrointestinal tract with fluorescence detection, J Chromatogr, 1988, 447, 244–248 Search PubMed.
- Yanlin Zhang, Yulian Wang, Lingli Huang, Dongmei Chen, Yanfei Tao and Zonghui Yuan, Effects of Cooking and Storage on Residues of Cyadox in Chicken Muscle, J. Agric. Food Chem., 2005, 53, 9737–9741 CrossRef CAS.
- I. Sestáková and M. Kopanica, Determination of cyadox and its metabolites in plasma by adsorptive voltammetry, Talanta, 1988, 35(10), 816–818 CrossRef.
|
| This journal is © The Royal Society of Chemistry 2012 |
Click here to see how this site uses Cookies. View our privacy policy here. 
![[thin space (1/6-em)]](https://www.rsc.org/images/entities/char_2009.gif) :
:![[thin space (1/6-em)]](https://www.rsc.org/images/entities/char_2009.gif) 1 and 10
1 and 10![[thin space (1/6-em)]](https://www.rsc.org/images/entities/char_2009.gif) :
:![[thin space (1/6-em)]](https://www.rsc.org/images/entities/char_2009.gif) 1, respectively. For all four analytes, the LODs ranged from 0.38 to 1.07 μg kg−1 and the LOQ ranged from 1.27–3.57 μg kg−1. Fig. 3–5 show the chromatograms of the control sample, 5 μg kg−1 of spiked sample and standard sample. No interfering peaks are near the four target peaks.
1, respectively. For all four analytes, the LODs ranged from 0.38 to 1.07 μg kg−1 and the LOQ ranged from 1.27–3.57 μg kg−1. Fig. 3–5 show the chromatograms of the control sample, 5 μg kg−1 of spiked sample and standard sample. No interfering peaks are near the four target peaks.


