Analysis of HPLC fingerprints: discrimination of raw and processed Rhubarb samples with the aid of chemometrics
Yongnian
Ni
*ab,
Rongmei
Song
b and
Serge
Kokot
c
aState Key Laboratory of Food Science and Technology, Nanchang University, Nanchang, 330047, China. E-mail: ynni@ncu.edu.cn; s.kokot@qut.edu.au; Fax: +86 791 83969500; Tel: +86 791 3969500
bDepartment of Chemistry, Nanchang University, Nanchang, 330031, China
cChemistry, Faculty of Science and Technology, Queensland University of Technology, Brisbane, 4001, Australia
First published on 6th December 2011
Abstract
Chromatographic fingerprints of raw, wine-treated and braised rhubarb samples were obtained by liquid chromatography with a diode array detector (LC-DAD). Eight LC peaks were selected for fingerprint analysis, and six compounds were identified as gallic acid, emodin, chrysophanol, palmidin, rhein glucoside and desoxyrhaponticin. A data matrix of the chromatographic fingerprints from the three types of sample was submitted to principal component analysis (PCA) and this indicated that the three types of rhubarb were distinguished in the PC1versusPC2 space. Training, verification and prediction data sets of the three types of HPLC fingerprint were processed successfully by chemometrics data classification methods, K-nearest neighbor (KNN), linear discriminant analysis (LDA) and least squares support vector machines (LS-SVM), and these types of rhubarb sample were classified satisfactorily.
Introduction
Traditional Chinese medicines (TCMs) are commonly plant mixtures, and contain many compounds, which may be relevant to their medicinal effects. The presence of the many substances is also the main reason why quality control of a TCM is generally more difficult than that of western medicines in which the contents are usually declared and carefully controlled. The World Health Organization (WHO) has indicated that the TCMs are not officially recognized in most countries because their quality and efficacy are not stated precisely; there is a lack of consistent health care policies and adequate or accepted research methodology for evaluating the quality of the TCMs.1 Thus, research and development of analytical methods suitable for the evaluation of the quality of TCMs is highly desirable.Rhubarb (“Dahuang” in Chinese), is the old generic term, which refers to many kinds of Polygonaceae Rheum, which are well known TCMs used in many preparations. Rhubarb is officially listed in Chinese,2 Japanese,3 and European4 Pharmacopoeia. The composition of rhubarb is quite complex because, generally, it may contain many constituents including anthraquinones, tannins, dianthrones, stilbenes, anthocyanins, polysaccharide flavonoids, polyphenols, organic acids and chromones,5 with the anthraquinones, tannins and polysaccharides often being the major active substances.6–10 The Rhubarb derived TCMs have been prescribed for liver disorders and as antibacterial remedies as well as anti-tumor agents amongst other applications.11 Harvested Rhubarb may be processed by various methods into different types of substances, and such treatments modify the properties of the original TCM. Examples of the treatments include wine soaking, braising and roasting.12 These treatments are associated with chemical reactions such as hydrolysis, carbonizing on browning of the original TCM, oxidation, decomposition and condensation; these are accompanied by physical, chemical or biological changes of the TCM.13 Furthermore, the toxicity and side effects of a TCM can be reduced or eliminated by such treatments.12 In practice, it can be difficult to distinguish TCMs, which have been differently treated, for example, the wine-treated rhubarb and braised samples often have similar post-treatment surfaces,2 and hence, sometimes they are interchanged with one another with consequent unsatisfactory results to the patient.
Chromatographic fingerprints have been suggested as a possible approach for quality control of TCMs, and this has been supported by studies such as that of Sun et al.14 who investigated the fingerprint characteristics of differently processed rhubarb by HPLC-DAD. This work indicated that the obtained fingerprints of differently treated rhubarb samples can be discriminated. The literature15–17 also indicated that fingerprints of TCMs obtained by HPLC or its hyphenated alternatives, can be very complex, and in such cases, chemometrics methods of data analysis can facilitate the discrimination of any similar TCM samples.
The principal aim of this work was to explore the possibilities of classifying the LC-DAD fingerprints of differently treated rhubarb, i.e. raw, wine-treated and braised samples, with the use of a number of chemometrics pattern recognition and classification methods, namely, principal component analysis (PCA), K-nearest neighbor (KNN), linear discriminant analysis (LDA) and least squares support vector machines (LS-SVM).
Chemometrics methods
Principal component analysis
PCA is a well known unsupervised, pattern recognition, multivariate data analysis method.18PCA transforms the original variables into new uncorrelated ones called principal components (PCs). Each PC is a linear combination of the original variables, and PCs are chosen to be orthogonal to each other; PC1 accounts for most of the data variance, PC2 the largest amount of the remaining variance, and so on. There are as many PCs extracted as the number of original variables and consequently, quite commonly the significant data variance is described by just a few PCs. Every sample-object on each PC has a score value and likewise each original variable has a loadings value on each PC. Thus, the PC1versusPC2 diagrams (i.e. biplots) indicate object-object, loadings-loadings and object-loadings relationships, and reveal patterns and groupings in the data.19,20K-nearest neighbor (KNN)
KNN is a well-known supervised, non-parametric data classification method.21 Similar K-nearest training samples (nearest neighbours) are compared to each other and the analyte test object. The Eucleadean distance variable is used for comparison of the objects. An important assumption in this method is that there is a similar number of samples in each class.Linear discriminant analysis (LDA)
LDA is a commonly used supervised pattern recognition method. It is a linear, parametric method, which uses the Euclidean distance between objects to build classes of nearest neighbours; such classes enable the classification of unknown samples.22 The method is based on the determination of linear discrimination functions, which enable the grouping of objects such that the ratio of between-class variance is maximized and the ratio of within-class variance is minimized.23 Like PCA, LDA is a feature reduction method but while PCA retains maximum data structure in a low dimensional space, LDA models seek a maximum separation among the different classes.Least squares support vector machines
LS-SVM is a simplified version of SVM,24 and LS-SVM can be applied for linear and non-linear multivariate analysis.24 It employs a set of linear equations using support vectors (SVs) instead of quadratic programming (QP) to reduce the complexity of the optimization processes. In order to avoid overfitting, SVM utilizes the structural risk minimization approach (SRM) instead of the traditional empirical risk minimization (EMR). Details of the LS-SVM algorithm can be found in the literature,25 and the final LS-SVM model can be expressed as: | (1) |
| K(x,xi) = exp (−‖x – xi‖2/2σi2) | (2) |
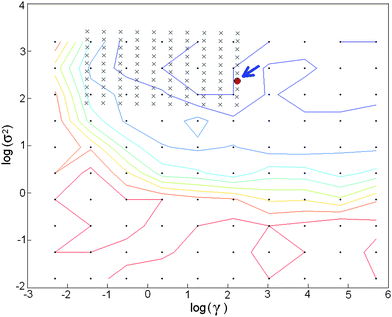
In the LS-SVM model, the regularization parameter, gamma (γ), and the width parameter, sigma (σ), have to be optimized. The former determines the tradeoff between minimizing the training error and minimizing model complexity, and the latter, expressed as σ2, refers to the bandwidth. In order to obtain the optimal combination of (γ, σ2), a two-step grid search technique was applied with the use of the leave-one-out cross validation method to avoid overfitting problems. In this work, the optimum γ and σ2 values were searched for within the 10−2–104 range; the range limits were selected from previous studies.26 The grid approach uses a geometric progression method to facilitate the search process i.e. in the initial grid search a large step size was utilized; in the second search the step was smaller being reduced according to the geometric progression, and so on until the values of the (γ, σ2) parameters have sufficiently converged.27 In this work, the grid search technique was employed to obtain the optimal combination of (log(γ), log(σ2)) (Fig. 1), and the optimal values for this LS-SVM model, were (2.06, 2.37).
 | ||
| Fig. 1 Plot of a two-step grid search from the LS-SVM model with parameters, γ and σ. The optimal combination of log(σ2) and log(γ) is indicated by an arrow - (log(σ2) = 2.06 and log(σ2) = 2.37). | ||
Experimental
Plant materials and reagents
Ninety commercial rhubarb samples, consisting of 30 raw rhubarb (number 1–30), 30 wine-treated rhubarb (number 31–60) and 30 braised rhubarb (number 61–90), of different provincial origins and batches, were purchased from local Chinese TCM shops. All of the samples were identified for authentication by Prof. Yi Rao (Jiangxi University of Traditional Chinese Medicine) based on the comments in Chinese Pharmacopoeia (2005).Phosphoric acid, (A.R. grade, Yanchen Chemical Investment Co., Shanghai) was used to prepare the mobile phase; methanol (L.C. grade, Damao Chemical Reagent Factory, Tianjin, China) filtered through a solvent filter (Automatic Science Co., Tianjin, China), was used for sample preparation and LC analysis. Freshly double distilled water was used throughout the experiment.
Instrumentation and chromatographic procedures
The HPLC analysis was carried out with an Agilent 1100 series (Agilent Technologies, Palo Alto, CA) equipped with a G1379A vacuum degasser, a G1311A autosampler, an injector with a 100 μL loop, and a G1315B diode array detector. For chromatographic analysis, an Agilent Zorbax Eclipse XDB-C18 column (250 × 4.6 mm, 5 μm) with an Agilent Zorbax high-pressure reliance cartridge guard column (C18, 12.5 × 4.6 mm, 5 μm) was used. The injection volume was 10 μL and the column was maintained at room temperature. Detection wavelength was set at 280 nm for acquiring chromatograms. The flow rate was 1.0 mL min−1. The mobile phase consisted of (A) methanol and (B) 0.1% phosphoric acid, and the gradient program was 5% A and 95% B at the beginning, and was allowed to reach 100% A and 0% B at 90 min. The system was then restored to its initial conditions (∼10 min).HPLC-MS was performed with a Waters AQ4000/2695 series instrument (Waters Co., Milford, MA). The chromatographic column used for the LC-MS work was the same as above. The mass spectra were recorded with the use of electron-spray ionization (ESI) in the negative mode with source temperature at 110 °C, capillary voltage at 3.0 kV, tapered bore voltage at 30 V, gas flow rate at 50 L h−1, desolvation temperature at 350 °C, the flow rate at 250 L h−1, and the scanning range was set from 50–1000 amu.
Sample preparation
The rhubarb samples were ground into powder and passed through a 40-mesh sieve. Each sample (0.50 g) was accurately weighed and extracted ultrasonically with 25 mL methanol for 30 min. The extract was centrifuged, filtered into a 25 mL flask, and diluted to the mark with methanol. The solution was filtered through a 0.45 μm filter membrane. A filtrate aliquot (10 μL) was used for HPLC and HPLC-MS analysis.Data analysis
A set of HPLC-DAD chromatographic data from the 90 rhubarb samples were submitted to a program—“Computer Aided Similarity Evaluation System” (CASES, Chinese Pharmacopoeia Commission, Version 2004A). CASES is a pattern recognition program recommended by the Chinese Pharmacopoeia committee; it evaluates statistically any chromatographic patterns in the TCM data.28PCA, KNN, LDA and LS-SVM algorithms were coded in MATLAB 6.5 (Mathworks).Results and discussion
HPLC fingerprints of rhubarb and their characteristic peaks
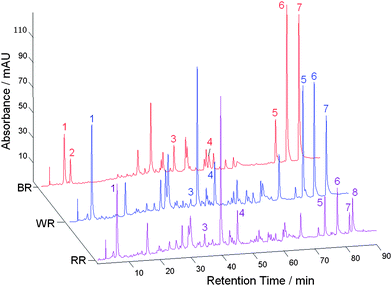
The CASES software was used to correct the retention time shifts of the HPLC profiles from the rhubarb TCMs, and thereafter, characteristic peaks were extracted. In general, the characteristic peak selection was based on the following criteria: 1. a peak was well resolved and free of overlaps from any neighbouring peaks, 2. in general, a peak was at the same retention time on the three types of chromatogram but the absence of a peak (i.e. zero intensity) on some profiles was permitted, and 3. there were clear differences in peak intensities in the HPLC profiles of the three types of sample. Peaks at eight retention times for rhubarb TCMs were selected (labeled 1, 2, …, 8, Fig. 2); they had relatively large variances (i.e. peak areas) and their intensities were generally high but different on different profiles. These chromatographic fingerprints, which consisted of peak profiles at the eight retention times, indicated that the corresponding detected compounds in the three kinds of rhubarb samples were very similar, but they were present in different amounts. Peaks 2 and 8 were observed only in braised and raw rhubarb samples, respectively, while the peak 3 compound appeared to be present in smaller amounts after treatment by braising or wine. On the other hand, the intensities of peaks 5, 6 and 7 were higher in wine-treated and braised rhubarb samples than in the raw ones. | ||
| Fig. 2 Fingerprints of raw rhubarb (RR), wine-treated rhubarb (WR) and braised rhubarb (BR) samples. | ||
Identification of the common peaks by HPLS-MS
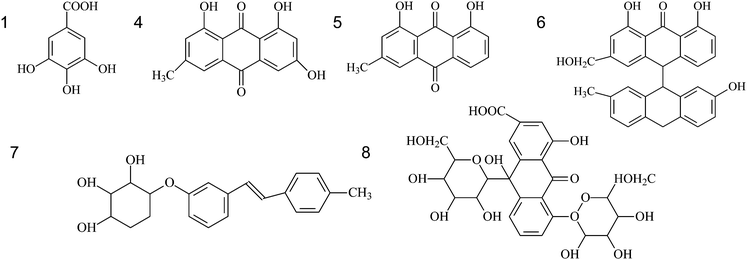
The eight fingerprint peaks of rhubarb samples (Fig. 2) were identified with the use of the electron-spray ionization technique and the SciFinder Scholar 2007 database (ACS division). The molecular weight associated with each chromatographic peak was obtained by the HPLC-MS technique, and compared with the literature29 for compound identification; the structural formula of each substance was then extracted from the SciFinder Scholar database (Table 1). Thus, six compounds were identified but no suitable structure could be assigned for peaks 2 and 3.| Peak No. | Retention time (min) | M.W. | [M-H]+ (m/z) | Identification |
|---|---|---|---|---|
| 1 | 6.92 | 170 | 169 | Gallic acid |
| 2 | 8.48 | 244 | 243 | unknown1 |
| 3 | 39.81 | 462 | 461 | unknown2 |
| 4 | 52.47 | 270 | 269 | Emodin |
| 5 | 73.63 | 254 | 253 | Chrysophanol |
| 6 | 77.30 | 510 | 509 | Palmidin |
| 7 | 81.44 | 610 | 609 | Rheinoside |
| 8 | 86.91 | 404 | 403 | Desoxyrhaponticin |

|
||||
Recent research suggested that some of the main components of rhubarb are anthraquinone glycosides, and that free anthraquinones have a mild medicinal effect,30 while the tannin components have a much stronger one. It has also been suggested that braising a rhubarb sample at a high temperature or for a long time reduces the amount of the anthraquinone glycosides, and increases somewhat the amounts of the free anthraquinones.30
PCA for chromatographic data
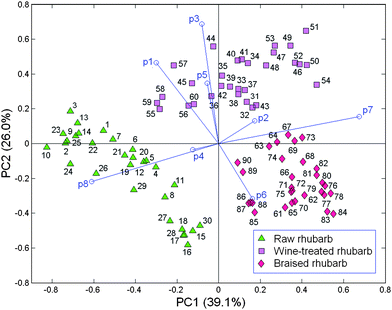
A 90 object × 8 variable data matrix containing the absolute peak areas of the eight principal peaks was submitted to PCA after autoscaling (Fig. 3). The PC1versusPC2 biplot accounted for 65.1% data variance (PC1 = 39.1% and PC2 = 26.0%). The braised and raw rhubarb samples are separated on PC1 with positive and negative scores, respectively; the former group is relatively compact with positive scores on this PC, while the latter is relatively spread out with negative scores. Such results are not surprising given that braising is a strong treatment, which is likely to produce significant changes in the rhubarb samples, while the raw samples reflect significant variations in the original product. When the wine-treated objects are projected on PC1 they overlap both the raw and the braised rhubarb samples as well as being widely spread along this PC. Thus, this treatment is also effective in changing the nature of the rhubarb because most samples overlap with braised ones, and only a few objects weakly overlap, with low negative scores, the raw samples. However, the nature of the wine-treated samples is rather different from the braised and the raw ones because the wine group has positive scores on PC2 and is clearly separated from the other two groups, which mostly have negative scores, and overlap on this PC. On PC1, positive loading vectors, p7 (strong), p6 and p2 are associated with the braised and most of the wine-treated samples, while negative loadings on this PC, p8 (strong), p1, p3, p4 and p5 are related to the raw and the small group of the wine-treated samples. The distribution of loadings on PC2 indicates that the positive p3 (strong), p1 (medium) and p5 (medium) are particularly related to wine-treated samples with p3 and p1 being especially important for the small group of samples, which has some similarities with the raw group. Similarly, vector p8 is associated with the raw group of samples, while p6 is especially related to some braised samples. Thus, the PC1versusPC2 biplot demonstrates that the wine and braising treatments do change the nature of the samples but nevertheless the product still retains some of its essential character. The compounds, which particularly relate to the three different types of sample are: raw samples - desoxyrhaponticin (p8); wine-treated-gallic acid (p1), unknown compound (p3) and chrysphanol (p5); braised samples - palmidin (p6) and rhein glucoside (p7). | ||
| Fig. 3 PCA biplot for raw, wine-treated and braised rhubarb samples; the loading vectors are labeled p(n) where n is the number of the corresponding compound (Table 1). | ||
Classification of the 90 rhubarb samples by KNN, LDA and LS-SVM
The 90 rhubarb samples were randomly divided into three sets—45 for the training set, 21 for the validation set and 24 for the prediction set. However, the number of samples for each class, raw rhubarb, wine-treated rhubarb and braised-treated rhubarb in each of the sample sets was the same. These data sets were submitted in the appropriate order, for sample classification to the three supervised pattern recognition methods, KNN, LDA and LS-SVM. The results of the KNN, LDA and LS-SVM models (Table 2) indicated that all the three methods performed quite well in the classification of the rhubarb samples into the raw, wine- and braised-treated rhubarbgroups. The correct classification rate of the KNN model produced a classification rate of 100% for the training, verification and prediction sets all containing the raw, wine- and braised-treated samples. The LS-SVM model misclassified two verification samples (#30 and 60) giving a 90.5% classification rate, and the LDA method misclassified three samples—one from the training set (#32) and two from the verification data (#6 and 90). The obtained modeling and prediction results for the three different classification methods suggest that while the KNN method performed marginally better than the other two on the particular data sets, no method performed so poorly as to be recommended for exclusion for the kind of classification attempted. The most important outcome of this study was that the three types of rhubarb sample may be distinguished with the use of the eight HPLC peaks submitted for data analysis to quite commonly applied classification models, KNN and LDA, which were shown to perform as well as the more sophisticated LS-SVM method; the latter method is capable of processing non-linear data.Conclusions
Eight characteristic HPLC peaks were selected as fingerprint variables for the classification of raw, wine- and braised-treated rhubarb samples. PCA of this data indicated that the three types of rhubarb sample could be distinguished in the PC1versusPC2 space. Six of the eight fingerprint variables were identified with the assistance of the HPLC-MS technique. The HPLC fingerprint data from the three kinds of sample were divided into training, verification and prediction sets. These data sets were submitted for classification with the common KNN and LDA methods as well as the more sophisticated LS-SVM method capable of processing non-linear data. All methods performed satisfactorily, although the KNN model performed slightly better than the other two. Thus, this work successfully researched and developed an HPLC fingerprint method for the classification of the three types of rhubarb sample with the use of the KNN, LDA and LS-SVM chemometrics methods. It showed that either the KNN or LDA method can be used for the discrimination of raw, wine- and braised-treated rhubarb samples, and if non-linear data is encountered, the LS-SVM method could be applied.Acknowledgements
The authors gratefully acknowledge the financial support of this study by the National Natural Science Foundation of China (NSFC-21065007) and the State Key Laboratory of Food Science and Technology of Nanchang University (SKLF-TS-200919).References
- World Health Organization, General Guidelines for Methodologies on Research and Evaluation of Traditional Medicines, WHO, Geneva (WHO/EDM/TRM/2000.1), 2000 Search PubMed.
- Chisese Pharmacopoeia Committee, Chinese Pharmacopoeia, Chemical Industry Press, Beijing, 2005 Search PubMed.
- Pharmaceutical and Food Safety Bureau, Ministry of Health, Labor and Welfare, Japanese Pharmacopoeia, 15th ed., Tokyo, 2006, pp, 1344–1345 Search PubMed.
- European Pharmacopoeia Committee, European Pharmacopoeia, 4th ed., Council of Europe, Strasbourg, 2001 Search PubMed.
- J. Koyama, I. Morita and N. Kobayashi, J. Chromatogr., A, 2007, 1145, 183–189 CrossRef CAS.
- H. X. Lu, J. B. Wang, X. C. Wang, X. C. Lin, X. P. Wu and Z. H. Xie, J. Pharm. Biomed. Anal., 2007, 43, 352–357 CrossRef.
- X. Y. Gao, Y. Jiang, J. Q. Lu and P. F. Tu, J. Chromatogr., A, 2009, 1216, 2118–2123 CrossRef CAS.
- J. B. Wang, H. F. Li, C. Jin, Y. Qu and X. H. Xiao, J. Pharm. Biomed. Anal., 2008, 47, 765–770 CrossRef CAS.
- H. X. Zhang and M. C. Liu, J. Chromatogr. B, 2004, 812, 175–181 CAS.
- H. Sun, C. Zhu, H. Y. Zhang, Y. R. Wang, G. A. Luo and P. Hu, Chin. Tradit. Pat. Med. (Zhong Cheng Yao), 2009, 31, 421–424 Search PubMed (in Chinese).
- F. X. Wang, Z. Y. Zhang, X. J. Cui and Peter de B. Harrington, Talanta, 2006, 70, 1170–1176 CrossRef CAS.
- C. M. Li, Chin. J. Urban. Rural. Ind. Hyg. (Zhongguo Chengxiang Qiye Weisheng), 2008, 3, 84–85 Search PubMed (in Chinese).
- C. Y. Zheng, Z. D. Zhang and W. Guo, J. Jiangxi Univ. Tradit. Chin. Med. (Jiangxi Zhongyi Xueyuan Xuebao), 2007, 19, 90–92 Search PubMed (in Chinese).
- Y. Q. Sun, Y. G. Ma, X. H. Xiao and X. J. Liu, Chin. Tradit. Herbal Drugs (Zhong Cao Yao), 2009, 40, 725–728 CAS (in Chinese).
- Y. A. Woo, H. J. Kim, K. R. Ze and H. Chung, J. Pharm. Biomed. Anal., 2005, 36, 955–959 CrossRef CAS.
- Y. N. Ni, Y. Y. Peng and S. Kokot, Chromatographia, 2008, 67, 211–217 CAS.
- L. Wang, S. C. Frank Lee and X. R. Wang, LWT–Food Sci. Technol., 2007, 40, 83–88 CrossRef CAS.
- J. Gabrielsson and J. Trygg, Crit. Rev. Anal. Chem., 2006, 36, 243–255 CrossRef CAS.
- Y. Roggo, P. Chalus, L. Maurer, C. Lema-Martinez, A. Edmond and N. Jent, J. Pharm. Biomed. Anal., 2007, 44, 683–700 CrossRef CAS.
- M. P. Derde, L. Buydens, C. Guns, D. L. Massart and P. K. Hopke, Anal. Chem., 1987, 59, 1868–1871 CrossRef CAS.
- L. A. Berrueta, R. M. Alonso-Salces and K. Héberger, J. Chromatogr., A, 2007, 1158, 196–214 CrossRef CAS.
- D. Coomans, M. Jonckheer, D. L. Massart, I. Broeckaert and P. Blockx, Anal. Chim. Acta, 1978, 103, 409–415 CrossRef CAS.
- R. Iglesias Rodríguez, M. Fernández Delgado, J. Barciela García, R. M. Peña Crecente, S. García Martín and C. Herrero Latorre, Anal. Bioanal. Chem., 2010, 397, 2603–2614 CrossRef.
- Y. Xu, S. Zomer and R. G. Brereton, Crit. Rev. Anal. Chem., 2006, 36, 177–188 CrossRef CAS.
- F. Liu, Y. He and L. Wang, Anal. Chim. Acta, 2008, 615, 10–17 CrossRef CAS.
- F. Liu, Y. H. Jiang and Y. He, Anal. Chim. Acta, 2009, 635, 45–52 CrossRef CAS.
- B. G. Xie, T. Gong, M. H. Tang, D. F. Mi, X. Zhang, J. Liu and Z. R. Zhang, J. Pharm. Biomed. Anal., 2008, 48, 1261–1266 CrossRef CAS.
- P. S. Xie, S. B. Chen, Y. Z. Liang, X. H. Wang and R. T. Tian, J. Chromatogr., A, 2006, 1112, 171–180 CrossRef CAS.
- H. X. Zhang and M. C. Liu, J. Chromatogr.B, 2004, 812, 175–181 CAS.
- L. Li, C. Zhang, Y. Q. Xiao, N. Lin, C. F. Liu, G. L. Li, Z. Feng, D. D. Chen and G. F. Tian, J. Beijing Univ. Tradit. Chin. Med. (Beijing Zhongyiyao Daxue Xuebao), 2009, 32, 839–845 CAS (in Chinese).
| This journal is © The Royal Society of Chemistry 2012 |
