A graphene oxide platform for the assay of biomolecules based on chemiluminescence resonance energy transfer†
Sai
Bi
*,
Tingting
Zhao
and
Baoyu
Luo
State Key Laboratory Base of Eco-chemical Engineering, College of Chemistry and Molecular Engineering, Qingdao University of Science and Technology, Qingdao 266042, P.R. China. E-mail: bisai11@126.com; Fax: +86 532 84022750; Tel: +86 532 84022946
First published on 31st October 2011
Abstract
The bifunctionality of graphene oxide (GO) that can highly adsorb single-stranded DNA (ssDNA) and effectively quench the emission of organic dyes is reasonably utilized in a chemiluminescence resonance energy transfer (CRET) system, achieving sensitive and selective detection of DNA (H1V1) and protein (thrombin), respectively.
Resonance energy transfer (RET)-based assay is a nonradiative (dipole–dipole) energy transfer process that occurs between a donor and an acceptor,1 which can be classified as fluorescence RET (FRET),2bioluminescence RET (BRET),3 and chemiluminescence RET (CRET),4 involving the donors as fluorophore, bioluminescent protein (e.g.luciferase), and chemiluminescent compound, respectively, and acceptors often as fluorophores (e.g.dyes and quantum dots). So far, RET has been widely used in bioanalysis.5 Amongst them, CRET exhibits a superior performance that occurs in the oxidation of a luminescent substrate that then excites the fluorescent acceptor without the need for an external light source.6 Thus, nonspecific signals caused by external light excitation can be minimized as often observed in FRET. In comparison with BRET, no protein fusion is involved in a CRET system.6 Therefore, CRET promises a widespread opportunity for bioanalytical applications.7
Graphene, along with its water-soluble derivative, graphene oxide (GO), is a single-atom-thick and two-dimensional carbon material that has recently attracted an increasing interest due to its remarkable electronic, mechanical, and thermal properties.8 It has been proven that GO sheets can strongly adsorb single-stranded nucleic acids, as a result of π-stacking interactions between the ring structures in the nucleobases and the hexagonal cells of GO, and hydrogen bonding interaction between –OH or –COOH of GO and –OH or –NH2 of single-stranded DNA (ssDNA).9 Additionally, in the pioneering work it has been proposed that GO can act as a super-quencher of fluorophores due to the nonradiative transfer of electronic transference from fluorophore excited states to the π system of GO.10 Based on the unique property of GO, a variety of robust biosensors has been developed.11 However, most of them are achieved by FRET. To the best of our knowledge, there is still no report, so far, focusing on the chemiluminescence (CL) detection of biomolecules based on the direct interaction between GO and biomolecules.
Herein, we have developed a GO platform for the sensitive and selective detection of DNA and protein based on the luminol–H2O2–HRP–fluorescein CRET system. In the proposed CRET system, luminol acts as both CL substrate and donor, and fluorescein as both enhancer and acceptor. Once fluorescein is introduced into the luminol–H2O2–HRP system, the CL intensity is enhanced by fluorescein through an energy transfer from a luminol donor to a fluorescein acceptor with two maxima of emission, one (luminol) around 425 nm and another (fluorescein) around 510 nm.12 As excellent quenching efficiency of GO with the long-range nanoscale energy transfer property through theoretical calculations was reported,13 we anticipated that GO could serve as a very good energy acceptor of fluorescein in this CRET system to construct a chemiluminescent sensing platform for sensitive detection of biorecognition events. As shown in Scheme 1, a fluorescein-based dye (FAM) labeled ssDNA, probe DNA, for H1V1 (from the HIV1 U5 long terminal repeat sequence) first noncovalently assembled on GO. To make the construction efficient, controllable proximity of dyes to the GO surface is required so that an obvious CRET signal change could be observed in the presence of target analyte. Once H1V1 is introduced, the conformation of probe DNA on GO is changed due to the binding between the probe DNA and target, resulting in the disturbance of the interaction between probe DNA and GO, and the release of probe DNA from the GO surface. The increasing probe DNA–GO distance and the weakened probe DNA–GO interaction, thus, restore the CRET from luminol–H2O2–HRP to FAM. The increase is proportional to the concentration of the target and dependent on the sequence of the target, leading to the sensitive and selective detection of the DNA target.
 | ||
| Scheme 1 Schematic illustration of target DNA induced CRET change of the FAM labeled probe DNA–GO complex. | ||
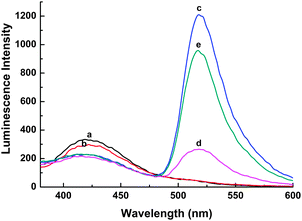
Firstly, the CL spectra under different conditions were investigated. As shown in Fig. 1, the CL emission of the luminol–H2O2–HRP system is at the wavelength of 425 nm (a), which decreases upon the addition of a FAM-labeled DNA probe with an increased emission at 510 nm corresponding to FAM (c). Thus, a CRET occurs from a luminol donor to a FAM acceptor. For the luminol–H2O2–HRP system, a slight quenching of CL emission is observed in the presence of GO (b) compared with that in spectra (a), indicating that GO has little influence on luminol–H2O2–HRP in the free state. Compared with the spectrum (c), upon the addition of GO into the CRET system the emission of FAM at ∼510 nm is significantly quenched (d). This observation indicates strong adsorption of the ssDNA on GO and high CL quenching efficiency of GO on FAM. Meanwhile, the emission intensity of luminol–H2O2–HRP at ∼425 nm is almost unchanged no matter whether in the presence of GO (d) or not (c). This could be explained as in the CRET system the energy of the donor at ∼425 nm has been transferred to the acceptor at ∼510 nm. Because the acceptor is proximate to GO by absorbing FAM-labeled ssDNA on the GO surface, GO could only quench the emission of the acceptor but not influence that of the donor. Upon the introduction of complementary target DNA, the emission of FAM is greatly enhanced also with an unchanged emission for luminol–H2O2–HRP at 425 nm (e). The above results confirm that the CRET recovery is indeed caused by the target due to the formation of double-stranded DNA (dsDNA) that has much lower binding ability to GO and ease of disassociation from the GO surface. Thus, CRET recovers because the fluorophore is far away from the GO surface. However, the intensity of recovered FAM emission by the target was about 79.1% to that without GO (c), which may be ascribed to GO partly preventing the hybridization of probe DNA with the target to form a duplex completely on the GO surface. In addition, the UV-vis absorption was carried out to characterize the ssDNA, GO and ssDNA–GO complex (see ESI†, Fig. S1).
 | ||
| Fig. 1 The CL spectra under different conditions: (a) luminol–H2O2–HRP; (b) luminol–H2O2–HRP + GO; (c) luminol–H2O2–HRP + (4.0 × 10⁻⁷ M) probe DNA; (d) luminol–H2O2–HRP + (4.0 × 10⁻⁷ M) probe DNA + GO; (e) luminol–H2O2–HRP + (4.0 × 10⁻⁷ M) probe DNA + (4.0 × 10⁻⁷ M) target DNA + GO. | ||
Accordingly, the signal change of the GO-based CRET system can also be detected using a CL analyzer which collected the total luminescence because the CL intensity of luminol is not changed under different concentrations of analytes. So the quenching ability of GO in the CRET system was evaluated by CL detection. The experiments of the CL quenching of FAM-labeled probe DNA of 1.0 × 10⁻⁷ M in the absence and presence of GO with a series of concentrations were carried out. From the results, the CL intensity rapidly decreases when GO is added, which decreases with the increase of GO concentration. Up to 95.8% CL intensity is quenched by the addition of 50 μg mL−1 GO with a good reproducibility. The high efficiency quenching could be attributed to the strongly noncovalent binding of the ssDNA probe on the surface of GO via π–π stacking of DNA bases with GO, which makes the probe DNA approach to GO and causes energy transfer to occur between dyes and GO.10 It should be noted that, unlike GO-based FRET sensors, no excited source is required in the proposed GO-based CRET system. Given that GO has excellent quenching efficiency on a dye molecular, it is feasible to construct a CRET biosensor by labeling fluorescent compound as probe and using GO as quencher.
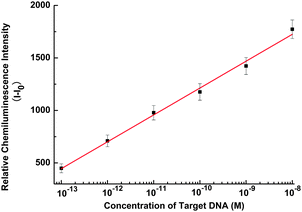
Subsequently, we employed the fabricated GO-based CRET quenching as a sensing platform for quantitative DNA analysis. As shown in Fig. 2, with increased concentration of target DNA (H1V1), the CL signal intensifies accordingly with a wide dynamic detection range from 0.1 pM to 10 nM and a detection limit of 0.1 pM. This sensitivity is two orders of magnitude lower than that using a carbon nanotube (CNT) based on the CRET strategy (see ESI†, Fig. S2), and much more sensitive than those obtained by either CNT-14 or GO-15 based FRET sensors. Additionally, the selectivity of the proposed assay was also investigated (see ESI†, Fig. S3).
 | ||
| Fig. 2 Calibration curve for target DNA detection with the concentration of 10−13, 10−12, 10−11, 10−10, 10−9, and 10−8 M H1V1. Relative CL intensity (I − I0) is calculated by I − I0, where I0 and I are the CL intensity without and with H1V1, respectively. The concentration of probe DNA is 1.0 × 10⁻⁷ M. Error bars are standard deviation of three repetitive measurements. | ||
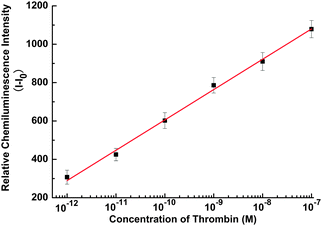
To demonstrate the generality of the assay, the proposed GO-based CRET platform was employed for protein detection via selective recognition of an aptamer for the target. An aptamer is a single-stranded oligonucleotide receptor isolated from random-sequence DNA or RNA libraries by an in vitro selection process termed systematic evolution of ligands by exponential enrichment (SELEX), which has high specificity and affinity for a given target.16 Here, thrombin was taken as a model analyte for the assay. As shown in Scheme 2, a FAM is tagged to the thrombin aptamer strand to fabricate the aptamer probe. In the presence of GO, the aptamer probe is assembled on the GO surface with strong binding affinity, resulting in high quenching efficiency of CRET intensity. Once thrombin is added, the conformation of the aptamer on GO can be changed by quadruplex formation induced by thrombin. The weak binding between quadruplex–thrombin complexes and GO surface makes the FAM far away from the GO surface, inducing the CRET recovery. The CL intensity of the FAM-labeled aptamer probe–GO complex increases in the presence of increasing concentration of thrombin. The calibration curve of CL intensity with thrombin concentration from 1.0 pM to 100 nM is shown in Fig. 3 with a detection limit of 1.0 pM, which excels previously reported FRET detection of thrombin using graphene by at least one order of magnitude,15,17 showing its excellent promise in biomolecule recognition and protein detection.
 | ||
| Scheme 2 Schematic illustration of thrombin induced CRET change of the FAM labeled aptamer–GO complex. | ||
 | ||
| Fig. 3 Calibration curve for protein detection with the concentration of 10−12, 10−11, 10−10, 10−9, 10−8 and 10−7 M thrombin. Relative CL intensity (I − I0) is calculated by I − I0, where I0 and I are the CL intensity without and with thrombin, respectively. The concentration of aptamer probe is 1.0 × 10⁻⁷ M. Error bars are standard deviation of three repetitive measurements. | ||
To investigate the specificity of the proposed aptasensor, we selected BSA and lysozyme to incubate with a thrombin specific FAM-labeled aptamer probe assembled GO complex in buffer solution, respectively (see ESI†, Fig. S4). The relative CL signals for BSA and lysozyme are much less than that of thrombin. The good selectivity of the assay is attributed to the high specificity of the aptamer, which could be applied in highly sensitive detection of thrombin with high specificity in a real clinical sample. The relative CL signal of 1.0 nM thrombin spiked blood serum which is obtained from the proposed assay is presented in Fig. S4 (ESI†). The recovering of CL intensity is proven to be very sensitive and selective to the existence of thrombin, promising practically analytical application of this assay for biomolecular recognition even in a complex environment together with many other species.
In conclusion, a graphene oxide (GO) platform for biomolecules detection based on the luminol–H2O2–HRP–fluorescein CRET system has been developed by assembling the FAM-labeled ssDNA probe on GO. The excellent quenching efficiency of GO on fluorescein and the subsequent CRET recovery induced by the formation of a duplex or quadruplex–thrombin with relatively weaker binding to GO achieved the sensitive and selective detection of DNA and thrombin, respectively. Compared to the reported GO- or CNT-based FRET strategies, a major advantage of the proposed assay is that no excited source is required and no photobleaching is involved. Our approach is therefore complementary to fluorescence detection and extends the application fields of CL reactions in biochemical analysis.
This work was supported by the National Basic Research Program of China (2010CB732404), the National Natural Science Foundation of China (no. 21105052) and the Natural Science Foundation of Shandong province (no. ZR2011BQ025).
Notes and references
- D. L. Andrews and D. S. Bradshaw, Encyclopedia of Applied Physics, Wiley Online Library, 2009 Search PubMed.
- K. E. Sapsford, L. Berti and I. L. Medintz, Angew. Chem., Int. Ed., 2006, 45, 4562–4588 CrossRef CAS.
- R. Jockers and S. Marullo, Encyclopedia of Genetics, Genomics, Proteomics and Bioinformatics, Wiley Online Library, 2005 Search PubMed.
- X. Y. Huang, L. Li, H. F. Qian, C. Q. Dong and J. Ren, Angew. Chem., Int. Ed., 2006, 45, 5140–5143 CrossRef CAS.
- (a) P. G. Wu and L. Brand, Anal. Biochem., 1994, 218, 1–13 CrossRef CAS; (b) W.-S. Wu, H.-W. Shi, J.-J. Xu and H.-Y. Chen, Chem. Commun., 2011, 47, 7752–7754 RSC.
- S. Zhao, Y. Huang, R. Liu, M. Shi and Y.-M. Liu, Chem.–Eur. J., 2010, 16, 6142–6145 CrossRef CAS.
- S. Zhang, Y. Yan and S. Bi, Anal. Chem., 2009, 81, 8695–8701 CrossRef CAS.
- W. Yang, K. R. Ratinac, S. P. Ringer, P. Thordarson, J. J. Gooding and F. Braet, Angew. Chem., Int. Ed., 2010, 49, 2114–2138 CrossRef CAS.
- N. Varghese, U. Mogera, A. Govindaraj, A. Das, P. K. Maiti, A. K. Sood and C. N. R. Rao, ChemPhysChem, 2009, 10, 206–210 CrossRef CAS.
- S. He, B. Song, D. Li, C. Zhu, W. Qi, Y. Wen, L. Wang, S. Song, H. Fang and C. Fan, Adv. Funct. Mater., 2010, 20, 453–459 CrossRef.
- (a) S. Guo and S. Dong, Chem. Soc. Rev., 2011, 40, 2644–2672 RSC; (b) Y. Wen, F. Xing, S. He, S. Song, L. Wang, Y. Long, D. Li and C. Fan, Chem. Commun., 2010, 46, 2596–2598 RSC.
- A. N. Díaz, J. A. G. García and J. Lovillo, J. Biolumin. Chemilumin., 1997, 12, 199–205 CrossRef CAS.
- (a) R. S. Swathi and K. L. Sebastian, J. Chem. Phys., 2008, 129, 054703 CrossRef CAS; (b) R. S. Swathi and K. L. Sebastian, J. Chem. Phys., 2009, 130, 086101 CrossRef CAS.
- Y. Liu, Y. Wang, J. Jin, H. Wang, R. Yang and W. Tan, Chem. Commun., 2009, 665–667 RSC.
- C.-H. Lu, H.-H. Yang, C.-L. Zhu, X. Chen and G.-N. Chen, Angew. Chem., Int. Ed., 2009, 48, 4785–4787 CrossRef CAS.
- D. Li, S. Song and C. Fan, Acc. Chem. Res., 2010, 43, 631–641 CrossRef CAS.
- H. Chang, L. Tang, Y. Wang, J. Jiang and J. Li, Anal. Chem., 2010, 82, 2341–2346 CrossRef CAS.
Footnote |
| † Electronic supplementary information (ESI) available: Experiment details and UV-vis absorption characterization of ssDNA, GO and ssDNA–GO complex. See DOI: 10.1039/c1cc15443e |
| This journal is © The Royal Society of Chemistry 2012 |
