Fuel cell-powered microfluidic platform for lab-on-a-chip applications†
Juan Pablo
Esquivel‡
a,
Marc
Castellarnau‡§
b,
Tobias
Senn
c,
Bernd
Löchel
c,
Josep
Samitier
bde and
Neus
Sabaté
*a
aInstituto de Microelectrónica de Barcelona, IMB-CNM (CSIC) Campus UAB, 08193, Bellaterra, Barcelona, Spain. E-mail: neus.sabate@imb-cnm.csic.es; Tel: +34 935947700
bInstitute for Bioengineering of Catalonia (IBEC), C/Baldiri Reixac 10-12, 08028, Barcelona, Spain
cHelmholtz-Zentrum Berlin für Materialien und Energie GmbH, Application Centre for Microenginering, Albert-Einstein-Str. 15, 12489, Berlin, Germany. Tel: +49 (0) 30 8062 1 5615
dDepartment of Electronics, University of Barcelona, C/Martí i Franquès 1, 08028, Barcelona, Spain. Tel: +34 934037181
eCentro de Investigación Biomédica en Red en Bioingeniería, Biomateriales y Nanomedicina (CIBER-BBN), Spain. Tel: +34 934037181
First published on 10th November 2011
Abstract
The achievement of a higher degree of integration of components – especially micropumps and power sources – is a challenge currently being pursued to obtain portable and totally autonomous microfluidic devices. This paper presents the integration of a micro direct methanol fuel cell (μDMFC) in a microfluidic platform as a smart solution to provide both electrical and pumping power to a Lab-on-a-Chip system. In this system the electric power produced by the fuel cell is available to enable most of the functionalites required by the microfluidic chip, while the generated CO2 from the electrochemical reaction produces a pressure capable of pumping a liquid volume through a microchannel. The control of the fuel cell operating conditions allows regulation of the flow rate of a liquid sample through a microfluidic network. The relation between sample flow rate and the current generated by the fuel cell is practically linear, achieving values in the range of 4–18 μL min−1 while having an available power between 1–4 mW. This permits adjusting the desired flow rate for a given application by controlling the fuel cell output conditions and foresees a fully autonomous analytical Lab-on-a-Chip in which the same device would provide the electrical power to a detection module and at the same time use the CO2 pumping action to flow the required analytes through a particular microfluidic design.
Introduction
Since their early appearance, the development of microfluidic devices was centred on the enhancement of analytical performance attained by the system miniaturization.1–5 Further developments showed that the use of advanced microfluidic platforms also involved diminution of the reagents volume, higher automation and reduction of manufacturing costs.6 Generally, most of these systems require external components such as pumps, power sources and control electronics to perform a complete sample analysis.7 These elements increase device complexity and limit portability and flexibility of the Lab-on-a-chip (LoC) device. For this reason it is often mentioned that microfluidic chips are microscale devices coupled to macroscale experimental set-ups. In this sense, the achievement of a higher degree of integration of components – especially micropumps and power sources – is currently being pursued to obtain totally autonomous devices.Despite the wide range of miniaturized power sources under development,8–10 only a few attempts of integrating these energy sources in microfluidic platforms have been reported. Most common strategies are based on microbatteries and RF-powered devices.11 Even though both approaches have interesting advantages, they still face some difficulties, e.g. operation of RF devices is limited to a distance from the power source and batteries suffer from restricted application due to their necessity for recharging and their limited power density at miniaturized scale. However, micro fuel cells – which can operate as long as fuel is supplied – have not been applied to microfluidic platforms despite the numerous prototypes found in the literature.12
On the other hand, a great part of the research in LoC systems has been oriented to the integration of liquid handling microfluidic structures such as microvalves and micropumps. Throughout these years, several surveys dedicated to micropumping systems have reported different classifications based on a number of features.13–15 Among these categorizations, the most accepted is to distinguish between mechanic pumps that have moving parts (check valves, peristaltic, rotary, etc) and non-mechanic pumps (electrokinetic, electrohydrodynamic, electrowetting, electrochemical, etc). One of the pumps in this second category are bubble-driven micropumps,7,16 which use the pressure of a gas generated by different methods such as electrolysis, thermal bubble generation, injection or chemical reaction to drive a liquid through a microfluidic platform. These type of pumps are attractive because of their simple fabrication and ease of control. However, in most of those previous efforts to integrate a pump, an external power source is required for their operation.
In this paper, we present the integration of a micro direct methanol fuel cell (μDMFC)-based micropump in a microfluidic platform as a smart solution to provide both electrical and pumping power to a LoC system. In a μDMFC, electrical power generation comes from the decomposition of methanol molecules into electrons, protons and CO2, in the proportion defined by the electrochemical reaction. In most micro fuel cells, the CO2 represents an undesirable side-product of the reaction, as it can cause the blockage of catalytic reaction sites.
For this reason, solutions for an efficient exhaustion of CO2 from the anode chamber are continuously proposed.17–19 Alternatively, recent works have reported the profitable use of the pressure increase produced by the accumulation of CO2 bubbles as a driving force to perform an auto-regulation of the fuel.20,21
In the assembly proposed here, the electric power produced by the fuel cell is available to enable most of the functionalities required by a microfluidic chip, while the generated CO2 produces a pressure capable of pumping a liquid volume through a microchannel. As it will be shown, the control of the fuel cell operating conditions allows to regulate the flow rate of a liquid sample through a microfluidic network.
System design and fabrication
The design of the microfluidic system fabricated to validate our approach consists of a polydimethylsiloxane (PDMS) microfluidic component that is composed by a set of three chambers connected by a microchannel. This platform incorporates a silicon microfabricated fuel cell under one of the chambers. Fig. 1 shows a scheme of the system and its operation, in which the components of the platform have been identified. To operate the system, a controlled volume of liquid is introduced in the sample chamber by means of an external syringe. The sample remains inside the chamber due to the high fluidic resistance of the surrounding microchannels. When the micro fuel cell starts to deliver electrical power to a certain load (e.g. resistance, circuit, sensor, etc…), CO2 gas is created at the anode side as a result of the oxidation of methanol molecules. The accumulation of CO2 in the inlet chamber causes a pressure increase that, after a certain time, forces the liquid in the sample chamber to displace towards the analysis chamber. In this way, the fuel cell integrated within the platform provides both electrical and pumping power to the microfluidic system. The times presented in the Figure correspond to the device condition before (Time 1) and after (Time 2) switching on the micro fuel cell device.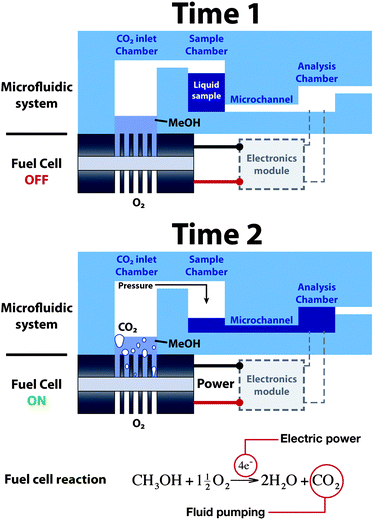 | ||
| Fig. 1 Operation principle of the fuel cell-powered microfluidic platform. | ||
The microfluidic components were fabricated by bonding several microstructured PDMS layers (ELASTOSIL 601 RT, Wacker). Fabrication of PDMS parts was performed by soft-lithography over SU-8 masters that defined the microchannel length (13 mm), width (200 μm) and height (100 μm). After curing, the PDMS layer was removed from the master and cut into individual components of 18 mm × 40 mm. The cavities for the inlet, sample and analysis/waste chambers were done using a hole-puncher, defining chamber volumes of 120 μL, 50 μL and 15 μL respectively. The PDMS layers were then bonded by oxygen plasma treatment to obtain the microfluidic component.
The micro fuel cell is composed of two microfabricated silicon current collectors and a commercial membrane electrode assembly (MEA). The current collectors consist of silicon plates of 10 mm × 14 mm, in which a grid of squared through-holes (80 μm × 80 μm) has been defined over an area of 5 mm × 5 mm by deep reactive ion etching (DRIE) to allow the reactants to distribute by diffusion. In the present case, the collectors that were used had grids with open ratios of 23% and 40% at the anode and cathode respectively, as this combination ensures an effective system performance. Electrical conductivity is achieved by sputtering a thin Ti–Ni layer (100 nm thick) that was used as a seed layer for the electrodeposition of a Ni–Au layer (2 μm thick). The detailed fabrication and characterization of this fuel cell system has been described in previous works.22
The components of the microfluidic platform are assembled with an external housing composed of three tailored methacrylate pieces to facilitate the optical characterization of the flow. These pieces are used to press the PDMS microfluidic component on top of the micro fuel cell and incorporate two PDMS gaskets that improve the sealing of the anodic and cathodic compartments. Fig. 2 shows a diagram of the components and a picture of the complete device.
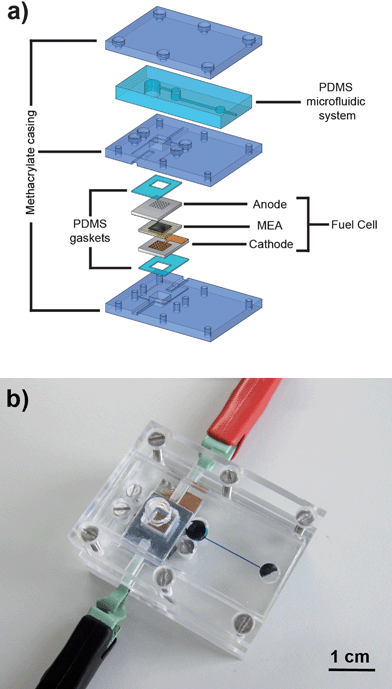 | ||
| Fig. 2 (a) Exploited view of the system used for characterization of the fuel cell-powered microfluidic platform. (b) Photograph of the assembled device during testing. | ||
Device characterization
Fig. 1 also shows that the stoichiometry of the electrochemical reaction taking place at the anode of the fuel cell equals the generation of CO2 molecules to the consumption of methanol molecules. Therefore, the electrical current generated in the fuel cell will be directly related to the pressure increase in the reaction chamber, as the number of CO2 moles produced increases. For this reason, the system was measured under different fuel cell operating conditions to determine the relation between electrical power output and pumping flow rate from the sample chamber to the analysis chamber.Micro fuel cell characterization
The performance of a fuel cell is mainly described by its current–voltage (I–V) curve, from which the generated output power curve can also be obtained. The characteristic shape of this polarization curve is due to the existence of several additive irreversible losses associated to different physical factors. These losses affect differently depending on the regime in which the fuel cell is operated. For this reason, it is important to characterize the device and operate it at an optimal working condition.The polarization curves of the fuel cell used in this study working with a 2 M methanol concentration at room temperature are shown in Fig. 3. Three operating points were chosen from these curves: one at the conditions that yield the maximum power (20 mA), another in the ohmic region of the fuel cell curve (10 mA) and the last one at a lower current where the fuel cell output voltage is higher (5 mA). These operating conditions correspond to fuel cell delivery power values of 3.2 mW, 2.7 mW and 1.6 mW, respectively. The passive operation of this fuel cell (i.e. air breathing cathode, fuel delivered by diffusion) reduces the device complexity and has the advantage that no power is consumed in heating or fuel pumping. As a result, the power provided by the fuel cell can be entirely delivered to the load. The middle methacrylate piece used to assemble the device is also used as a fuel reservoir, for each measurement the micro fuel cell was fed with 100 μL of methanol with a 2 M concentration.
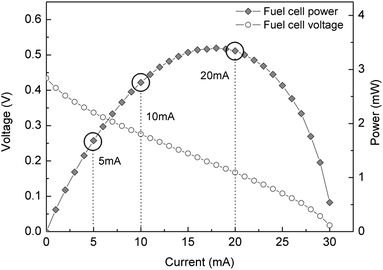 | ||
| Fig. 3 Polarization curve from the micro fuel cell used for this study, indicating the output currents at which the characterization was performed. | ||
Microfluidic characterization
The characterization of the flow rate impelled by the micro fuel cell was performed by particle image velocimetry (PIV). This technique allows the obtaining of the instantaneous velocity in a planar section of a flow.23 In the present case, this technique was used to obtain the evolution of the sample flow rate during the fluid transfer between the sample loading chamber and the analysis chamber. Monodisperse suspensions of carboxylated polystyrene latex particles of 25 μm in diameter (Polyscience Inc.) in Mili-Q water solutions were used in these experiments. Then, the sample chamber was filled with 30 μL of this solution using an automated syringe pump (NE-1000, New Era Pump Systems, Inc.). An Olympus IX71 inverted optical microscope was used to image a section of the microchannel that connects both chambers. An optical high-speed video recording of the moving particles was acquired by means of a high-speed CCD camera (Photron FastCam 1024 PCI), working at a rate of 125 frames/s with a shutter speed of 1/5000 s.By selecting only the particles flowing through the center of the channel and assuming that they flow at the maximum velocity value (umax), the average value of the fluid velocity can be extracted from the simplified equation for a laminar flow in a squared microchannel:24
 | (1) |
Flow rates can be derived from the average value of fluid velocity (uav) by multiplying this value and the channel cross-sectional area (A):
 | (2) |
Videos at three different fuel cell working points were recorded and analyzed. In the analysis, only particles flowing within ±25 μm the center of the microchannel were accounted. An average of 120 particles were counted in each of the videos. The velocity of the selected particles was calculated considering the time difference between two frames and their position in the x–y plane. The flow rate was calculated from the velocity of each particle and the specific time within the measurement. These values of instantaneous flow rate are used to construct a plot of the evolution of the flow rate during the entire measurement at the different fuel cell current conditions, shown in Fig. 4. The Figure includes insets of pictures from the device at particular points in the measurements. For the sake of clarity, the indications are referred to the 5 mA measurement, as it is the longest one, but can be related to the rest of the measurements.
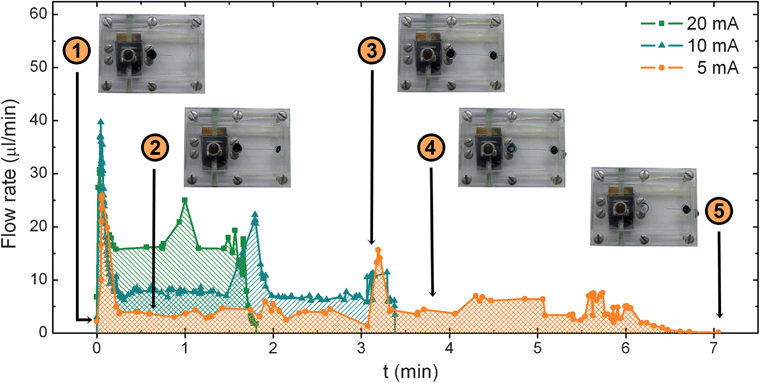 | ||
| Fig. 4 Evolution of the flow rate calculated from the particle velocimetry from the fuel cell working at three different electric currents. | ||
As it can be seen, the transient analysis of the flow rate measured at the middle of the central microchannel of the platform shows a rather flat profile where three different peaks can be distinguished: one at the beginning of the experiment, another in the middle of the test and a smaller one at the end of the measurements. Similar profiles have been found at the three fuel cell operating conditions suggesting that the CO2 generation rate reproduces the same phenomena at different time lengths.
Changes in the fluid velocity depicted in Fig. 4 can be explained by the pressure evolution in the inlet chamber and the cross-sectional area variation in the fluidic system. A movie of the device operation and a schematic table of the different stages of the sample pumping can be found in the ESI.† At the beginning of the measurement (Region 1) the CO2 molecules accumulate in the CO2 inlet chamber until the pressure reaches a value high enough to start pushing the liquid sample from the sample chamber towards the analysis chamber. The first peak shows how the accumulated pressure strongly expels the sample through this channel in a short impulse until it is completely filled. Then, the flow rate decreases to a stable value due to the arrival of the liquid sample to the analysis chamber: the increase of cross-sectional area of the sample supposes a significant decrease of fluidic resistance (Region 2). During this time, the moles of CO2 produced in the inlet chamber displace the sample steadily from one chamber to the other. The end of this plateau arrives when the analysis chamber is completely filled. The integration of the area under these curves up to this point provides the volume of sample displaced to fill the analysis chamber. Values of 13.8 μL, 13.4 μL and 13.1 μL have been obtained for curves corresponding to 5 mA, 10 mA and 20 mA respectively, which are in good agreement with the 15 μL volume of the analysis chamber. Average flow rates of 4.5 μL min−1, 8.9 μL min−1 and 17.5 μL min−1 are easily calculated by considering the different transfer times at each condition (3.1 min, 1.5 min and 0.75 min). The second peak in velocity (Region 3) is caused by the sudden decrease in the cross-sectional area of the fluid front when the liquid is forced to flow from the analysis chamber through the last segment of microchannel platform. When the liquid finally reaches the end of the channel and leaves the microfluidic component, the fluid flows again steadily until depletion (Region 4). Again, the calculation of the average flow rates in this second flat region leads to values of 4.6 μL min−1, 7.5 μL min−1 and 15.5 μL min−1, respectively. A small velocity peak at the end of the curves can be attributed to the acceleration experienced by the fluid in the final stretch. Finally, the total area under the curves has been integrated until the exhaustion of the liquid, finding volume values of 29.98 μL, 30.4 μL and 30.01 μL. Flow rates have been also calculated taking into account the recorded total time. The mean values obtained were 4.3 μL min−1, 8.9 μL min−1 and 16.7 μL min−1 for the fuel cell output currents of 5, 10 and 20 mA respectively. These mean values are plotted in Fig. 5, as well as the electric power delivered by the micro fuel cell at each working condition. These values obtained from the measurement of the particle velocity are coherent with the mean average value of flow rate calculated from the volume of sample divided by the total time in which it was transferred from one chamber to the other. The correspondence between the fuel cell current and the sample flow rate follow an almost linear behavior. These results imply that within this range, the flow rate could be accurately adjusted by controlling the output current demanded from the fuel cell.
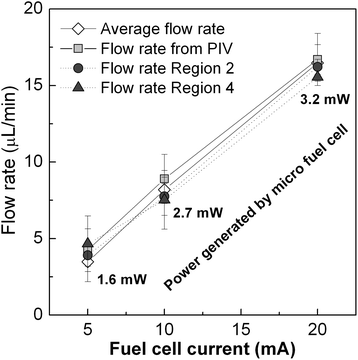 | ||
| Fig. 5 Mean values of flow rate at the measured fuel cell conditions and the corresponding output power. | ||
Discussion
The power produced by the fuel cell and the magnitude of the flow rate values achieved with this approach lay within the values of interest in a wide range of microfluidic applications.13–15,25 Nevertheless, it is important to notice that the flow rates would depend on the particular fluidic resistance of each application. The magnitude of flow rate values obtained in this study corresponds to the specific system with which was measured. These values are used here to validate the approach and prove the dependence with the fuel cell current. However, as general design rules: (i) if the analysis is performed in the connecting microchannel between chambers, then the volume of the final chamber (i.e. waste chamber) should be bigger than the sample chamber volume, thus the time in Region 2 will be controlled by the volume of the final chamber; (ii) whenever the analysis would be done in the last chamber (i.e. analysis chamber), then the transient time, until the system is filled and the flow is stable, is determined by the total volume of the microfluidic parts, whereas the time for analysis (i.e. Region 4) will depend on the ratio between the sample chamber and the analysis chamber volumes, being sample chamber larger than the analysis one.One aspect to take into account when designing the microfluidic component in a practical application is the incorporation of an interface that avoids dissolution of CO2 into the sample and prevents direct contact with the liquid fuel. This interface could be a flexible physical barrier, such as a PDMS membrane, incorporated before the sample chamber;16,26 or an intermediate chamber (between the fuel chamber and the sample chamber) containing an intermediate liquid buffer, e.g.fluorocarbon oil with some block-copolymer surfactant added.27 This substance could be biocompatible and would not represent an additional fluidic resistance due to their rheological properties similar to most aqueous solutions.11
As seen in the Figures above, the fuel cell is able to deliver an electric power around 1–4 mW, depending on the point of operation, while producing sufficient hydraulic force to pump a fluid though the microchannel. These results represent that both electric and hydraulic power needs of a microfluidic system could be addressed using this approach. This advantage becomes relevant when aiming for reduced device dimensions and complexity, as it eliminates the need for additional pumping solutions (e.g. piezoelectric, electrohydrodynamic, electroosmotic, etc) that would require high voltage (101–103 V) sources and consume powers that can range from 10−4 to 101 W.13 Interesting potential candidates to implement this concept emerge from reported point-of-care applications that operate with comparable sample volumes and measurement times.28,29 The micropumping capability could effectively be used as an integrated solution to move a liquid through a microfluidic network in a controllable manner.30,31 The electric power produced by this fuel cell can be used by low power electronic instrumentation,8,32 which could be integrated in the same platform to perform specific analysis (e.g., electrochemical measurements), avoiding the use of external equipment.33 Furthermore, the system presented in this work uses only a single fuel cell to introduce the concept, but a practical application could integrate a larger fuel cell or several of these fuel cells connected together, and in this way deliver the specifically required power.34 In this sense, the presented approach could have the strength to push forward many of these point-of-care applications from bench-top or handheld-based schemes towards a truly autonomous Lab-on-Chip device.
Conclusions
The operation of the fuel cell-powered microfluidic platform approach proposed in this paper has been validated by the characterization of different sample flow rates. In addition to delivering electrical power, a micro direct methanol fuel cell can be also used to drive liquid samples inside a microfluidic platform. The combination of these two capabilities foresees a fully autonomous analytical Lab-on-a-Chip in which the same device would provide the electrical power to a detection module and at the same time use the CO2 pumping action to flow the required analytes through a particular microfluidic network.The operation of the pumping system allowed demonstrating that, as expected, the relation between sample flow rate and the current generated by the fuel cell is practically linear. This permits adjusting the desired flow rate for a given application by controlling the fuel cell output conditions.
The characterization of this system was performed with a micro fuel cell that is assembled by screws and an external casing (hybrid approach); nevertheless, other micro fuel cell developments could also be applied to achieve a more compact device. In particular, the fuel cell advances using polymer fabrication technologies enable the integration of this power source/micropump in a fully polymeric Lab-on-a-Chip system.12,27 A further optimization of the system could also lead to a system in which part of the analyte could be used to generate the electric energy and perform the pumping functions.
Acknowledgements
This work was partially supported by the Spanish Government project MICAELA-TEC2009-14660-C02-01. J.P. Esquivel and N. Sabaté would like to thank the financial support received from their respective doctoral and postdoctoral programs JAE-PREDOC (CSIC) and Ramon y Cajal (MEC). M. Castellarnau and J. Samitier are grateful for financial support from CIBER-BBN.References
- S. C. Terry, J. H. Jerman and J. B. Angell, IEEE Trans. Electron Devices, 1979, 26, 1880–1886 CrossRef.
- K. E. Petersen, IEEE Trans. Electron Devices, 1979, 26, 1918–1920 CrossRef.
- P. Gravesen, J. Branebjerg and O. S. Jensen, J. Micromech. Microeng., 1993, 3, 168 CrossRef CAS.
- S. Shoji and M. Esashi, J. Micromech. Microeng., 1994, 4, 157 CrossRef CAS.
- A. Manz, N. Graber and H. M. Widmer, Sens. Actuators, B, 1990, 1, 244–248 CrossRef.
- D. Erickson and D. Li, Anal. Chim. Acta, 2004, 507, 11–26 CrossRef CAS.
- L. Qin, O. Vermesh, Q. Shi and J. R. Heath, Lab Chip, 2009, 9, 2016–2020 RSC.
- K. A. Cook-Chennault, N. Thambi and A. M. Sastry, Smart Mater. Struct., 2008, 17, 043001 CrossRef.
- J. D. Morse, International Journal of Energy Research, 2007 Search PubMed.
- H. Ibrahim, A. Ilinca and J. Perron, Renewable Sustainable Energy Rev., 2008, 12, 1221–1250 CrossRef CAS.
- C. Holtze, A. C. Rowat, J. J. Agresti, J. B. Hutchison, F. E. Angile, C. H. J. Schmitz, S. Koster, H. Duan, K. J. Humphry, R. A. Scanga, J. S. Johnson, D. Pisignano and D. A. Weitz, Lab Chip, 2008, 8, 1632–1639 RSC.
- S. Tominaka, H. Nishizeko, J. Mizuno and T. Osaka, Energy Environ. Sci., 2009, 2, 1074–1077 CAS.
- D. J. Laser and J. G. Santiago, J. Micromech. Microeng., 2004, 14, R35 CrossRef.
- N.-T. Nguyen, X. Huang and T. K. Chuan, J. Fluids Eng., 2002, 124, 384–392 CrossRef.
- P. Woias, Sensors Actuators B, 2005, 105, 28–38 Search PubMed.
- C. Lui, S. Stelick, N. Cady and C. Batt, Lab Chip, 2010, 10, 74–79 RSC.
- F. A. de Bruijn, D. C. Papageorgopoulos, E. F. Sitters and G. J. M. Janssen, J. Power Sources, 2002, 110, 117–124 CrossRef CAS.
- W.-M. Yan, H.-S. Chu, M.-X. Lu, F.-B. Weng, G.-B. Jung and C.-Y. Lee, J. Power Sources, 2009, 188, 141–147 CrossRef CAS.
- S. Prakash, W. Mustain and P. A. Kohl, J. Power Sources, 2008, 185, 392–400 CrossRef CAS.
- D. D. Meng and C. J. Kim, J. Power Sources, 2009, 194, 445–450 CrossRef CAS.
- Y. H. Chan, T. S. Zhao, R. Chen and C. Xu, J. Power Sources, 2008, 176, 183–190 CrossRef CAS.
- J. Esquivel, N. Sabaté, J. Santander, N. Torres and C. Cané, Microsyst. Technol., 2008, 14, 535–541 CrossRef CAS.
- J. Westerweel, PhD thesis, Delft University, 1993.
- H. Morgan and N. G. Green, AC Electrokinetics: colloids and nanoparticles, Research Studies Press Ltd, Baldock, Hertfordshire, England, 2003 Search PubMed.
- N. T. Nguyen and S. T. Wereley, Fundamentals and Applications of Microfluidics, Norwood: Artech House, 2002 Search PubMed.
- J. P. Esquivel, PhD thesis, Universidad Autonoma de Barcelona, 2010.
- S. Koster, F. E. Angile, H. Duan, J. J. Agresti, A. Wintner, C. Schmitz, A. C. Rowat, C. A. Merten, D. Pisignano, A. D. Griffiths and D. A. Weitz, Lab Chip, 2008, 8, 1110–1115 RSC.
- S. Carrara, A. Cavallini, V. Erokhin and G. De Micheli, Biosens. Bioelectron., 2011, 26, 3914–3919 CrossRef CAS.
- J. Wang, Biosens. Bioelectron., 2006, 21, 1887–1892 CrossRef CAS.
- R. J. Meagher, A. V. Hatch, R. F. Renzi and A. K. Singh, Lab Chip, 2008, 8, 2046–2053 RSC.
- J. Do, S. Lee, J. Han, J. Kai, C.-C. Hong, C. Gao, J. H. Nevin, G. Beaucage and C. H. Ahn, Lab Chip, 2008, 8, 2113–2120 RSC.
- S. Tominaka, S. Ohta, T. Osaka and R. Alkire, Energy Environ. Sci., 2011, 4, 162–171 CAS.
- L. Civit, H. M. Nassef, A. Fragoso and C. K. O'Sullivan, J. Agric. Food Chem., 2008, 56, 10452–10455 CrossRef CAS.
- S. Tominaka, H. Nishizeko, S. Ohta and T. Osaka, Energy Environ. Sci., 2009, 2, 849 CAS.
Footnotes |
| † Electronic supplementary information (ESI) available: Video of the device operation and schematic table of the different stages of the sample flow. See DOI: 10.1039/c1lc20426b |
| ‡ These two authors contributed equally to this work. |
| § Current contact information: Research Laboratory of Electronics, Massachusetts Institute of Technology, 77 Massachusetts Avenue, Cambridge, MA 02139, USA; Email: E-mail: mcastell@mit.edu |
| This journal is © The Royal Society of Chemistry 2012 |
