DOI:
10.1039/C1RA00389E
(Paper)
RSC Adv., 2012,
2, 1477-1485
Structure–property relations in hexagonal and monoclinic BiPO4:Eu3+ nanoparticles synthesized by polyol-mediated method†
Received
30th June 2011
, Accepted 3rd November 2011
First published on 20th December 2011
Abstract
Hexagonal BiPO4·xH2O and Bi0.95Eu0.05PO4·xH2O nanoparticles were synthesized by a polyol-mediated method employing diethylene glycol. The powder X-ray diffraction revealed the phase purity and isostructural nature of both undoped and Eu3+-doped BiPO4. The monoclinic Bi0.95Eu0.05PO4 was obtained by heating the hexagonal Bi0.95Eu0.05PO4·xH2O at 600 °C. The microscopical characterization revealed the formation of nanocrystalline materials. Water molecules present in the bismuth precursor favoured the formation of hexagonal phase at low temperature. The role of DEG molecules in arresting the particle growth during the phase transformation of Bi0.95Eu0.05PO4 from hexagonal to monoclinic was observed. The synthesized materials were characterized using different spectroscopic techniques such as FT-IR, Raman, 31P MAS-NMR, DRUV-Vis and PL. The difference in the crystal structures and symmetries is clearly reflected in the spectral results of hexagonal and monoclinic Bi0.95Eu0.05PO4. The structure-property relations were studied to derive its importance from both fundamental and technological aspects.
1 Introduction
BiPO4 is known for its multifarious applications such as catalyst,1orthophosphate ion sensor,2 microwave dielectric,3 and in separation of radioactive elements.4 Recent focus on BiPO4 is due to its application as a host lattice for rare earth luminescent centers and as a photocatalyst.5–8BiPO4 crystallizes in three different structures with hexagonal and monoclinic (low and high temperature modifications) symmetries.9,10 All the three phases of BiPO4 consist of three dimensional network structure made up of PO4 tetrahedra and BiO8 polyhedra. The most stable form is the low temperature monoclinic monazite-type (LTBP) that can be converted into high temperature monoclinic structure (HTBP) when heated at 700 °C and above. Both LTBP and HTBP have closely related crystal structures. The third form is the hexagonal phase of hydrated BiPO4·xH2O which can be synthesized at room temperature through a wet chemical method.9 Synthesis of BiPO4 with different morphologies has received considerable research attention in recent times. An urchin-like morphology of monoclinic BiPO4 nanoparticles with rare earth doping was obtained by hydrothermal method for its application in high performance luminescent devices.6 Monoclinic BiPO4 nanowires were obtained by the decomposition of single source precursor tris-chelated diselenophosphato complex.11 Monoclinic BiPO4 and BiPO4:Tb3+ were synthesized by polyol-mediated method and the Tb3+ photoluminescence (PL) emission intensity was found to increase with increasing post annealing temperatures.5 Hexagonal BiPO4 nanorods were obtained by a sonochemical method without the assistance of surfactant or ligands.12 Recently, the hexagonal BiPO4 nanorods have been synthesized by electrochemical anodization of Bi metal substrate and its PL property has been reported.13
Recent studies revealing the potential of BiPO4 as a host lattice for rare earth luminescent ions motivated us to study the PL properties of Eu3+ in different polymorphs of BiPO4. We used the polyol mediated synthesis which is a simple and versatile technique involving the precipitation of nanocrystalline materials in the presence of a multidendate and high-boiling alcohol such as diethylene glycol (bp 246 °C).14,15 The alcohols, in addition to their role as solvent, act as stabilizers of nanoparticles by preventing the agglomeration and inhibiting the particle growth. The objectives of this work are: primarily the spectroscopic characterization of the host BiPO4 in its two different polymorphs, namely hexagonal and monoclinic, in the nanoscale and to elucidate their structure–spectral properties correlation. Although these correlations has been carried out in the bulk, a comparative study of the spectral properties of BiPO4 nanoparticles, either undoped or doped, is necessary considering the changes in properties at the nanoscale.9 Secondly, we chose Eu3+ since its emissions are hypersensitive i.e., they strongly depend on the local structural symmetry of the host lattice.16,17 Understanding the PL properties of Eu3+ in hexagonal and monoclinic BiPO4 nanoparticles is of fundamental interest and this may pave way for the improvement of properties by controlling the surface-bound species in the nanoscale phosphors, especially for their application in white LED technology. In the present study, we report the synthesis of nanocrystalline hexagonal BiPO4·xH2O and Bi0.95Eu0.05PO4·xH2O by polyol-mediated method and the conversion of hexagonal Bi0.95Eu0.05PO4·xH2O into monoclinic monazite phase by thermal treatment without affecting the particle size. The obtained hexagonal and monoclinic Bi0.95Eu0.05PO4nanoparticles were characterized by various spectroscopic techniques and the results are compared.
2 Experimental
2.1 Synthesis
The polyol-mediated synthesis procedure adopted in the present study is similar to the one reported by Roming and Feldmann except for the starting materials.5 In a typical synthesis, 1.6009 g (3.3 mmoles) of Bi(NO3)3·5H2O (Merck 98%) was dissolved in 100 ml of diethylene glycol (DEG) (SISCO Research Lab. Pvt. Ltd. 99%) at 60 °C. A solution of phosphate precursor consists of 0.4358 g (3.3 mmoles) of (NH4)2HPO4 (Lobachemie 98–100%) in 4 ml dist. H2O was added into DEG solution containing bismuth nitrate under vigorous stirring. The particles were formed immediately and the solution was heated rapidly to 160 °C and kept at this temperature for 1 h followed by cooling to room temperature under constant stirring. After cooling, 100 ml ethanol was added and stirred for 30 min and centrifuged. The obtained particles were washed several times with ethanol and dried at 100 °C in an air oven for 8–10 h. In the case of Bi0.95Eu0.05PO4, a stoichiometric amount of Eu2O3 was initially converted into nitrate by dissolving in conc. HNO3 and the above synthesis procedure was followed. We obtained about 0.98 g of final product (yield 98%).
2.2 Characterization
Thermogravimetric analysis (TGA) of synthesized materials was carried out in air from 30 to 1000 °C with a heating rate of 20 °C min−1 using TA (SDT Q600) instrument. The phase formation and purity were monitored by powder X-ray diffraction (XRD) technique using Cu-Kα radiation (D8 Advance, Bruker). The FT-IR spectra were recorded in the mid-IR region using KBr pellet technique (Tensor 27, Bruker). Laser Raman spectra were recorded using Reninshaw Invia Laser Raman microscope equipment with 633 nm He-Ne Laser source through CCD detector. Solid state 31P magic angle spinning (MAS) NMR spectra were recorded in Bruker Advance 400 spectrometer with a magnetic field of 9.4 T operating at a frequency of 161.98 MHz for 31P nuclei. The 31P MAS-NMR spectra were recorded at different spinning rate of the sample tube ranging between 5000–8000 rpm. The scanning electron micrographs (SEM) were obtained using Hitachi (S-3000H) microscope. The transmission electron microscopic (TEM) images were obtained using FEI Technai 20 G2 microscope. The diffuse reflectance UV-Vis (DRUV-Vis) absorption spectra were recorded using a spectrometer (Cary 500, Varian) and BaSO4 was used as a standard to correct the base line. Photoluminescence (PL) emission spectra of powder samples were recorded using JASCO (FP-6500) spectrophotometer.
3 Results and discussion
3.1
Phase formation
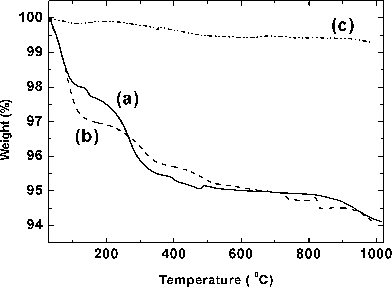
The thermogravimetric analysis (TGA) of the undoped and Eu3+-doped BiPO4 obtained by polyol-mediated method was carried out in order to find the presence of lattice water molecules and the results are shown in Fig. 1a. In the case of BiPO4·xH2O, a weight loss (∼2%) from room temperature to 150 °C was observed and this could be due to the removal of adsorbed water and ethanol over the particle surface.10 Another major weight loss was observed between 200 and 350 °C and this could be due to the removal of zeolitic lattice water molecules present in the open channels of hexagonal BiPO4·xH2O structure and some residual DEG which was used as the solvent and capping agent in the synthesis.18 The TGA result of Bi0.95Eu0.05PO4·xH2O shows almost a similar behaviour (Fig. 1b). Thus, the thermogravimetric analysis revealed the presence of zeolitic lattice water molecules and the residual organics in the sample as obtained by polyol-mediated method. There is no weight change after ∼550 °C and hence the calcination of hexagonal Bi0.95Eu0.05PO4·xH2O was carried out at 600 °C above which the conversion into high temperature monoclinic phase may occur.3 The TGA result of Bi0.95Eu0.05PO4 obtained by heat treatment of hexagonal phase at 600 °C/6 h (Fig. 1c) shows a negligible weight loss (<1%) which could be due to adsorbed moisture. This result clearly reveals the complete removal of zeolitic water molecules and residual organics during the phase transformation of hexagonal Bi0.95Eu0.05PO4·xH2O into monoclinic Bi0.95Eu0.05PO4 by thermal treatment.
 |
| | Fig. 1
TGA curves of (a) BiPO4·xH2O (—) and (b) Bi0.95Eu0.05PO4·xH2O (-![[thin space (1/6-em)]](https://www.rsc.org/images/entities/char_2009.gif) - -![[thin space (1/6-em)]](https://www.rsc.org/images/entities/char_2009.gif) - -![[thin space (1/6-em)]](https://www.rsc.org/images/entities/char_2009.gif) -) as obtained by polyol-mediated synthesis and (c) Bi0.95Eu0.05PO4 (- -) as obtained by polyol-mediated synthesis and (c) Bi0.95Eu0.05PO4 (-![[thin space (1/6-em)]](https://www.rsc.org/images/entities/char_2009.gif) · ·![[thin space (1/6-em)]](https://www.rsc.org/images/entities/char_2009.gif) · ·![[thin space (1/6-em)]](https://www.rsc.org/images/entities/char_2009.gif) -) obtained after calcinations of (b) at 600 °C/6 h. -) obtained after calcinations of (b) at 600 °C/6 h. | |
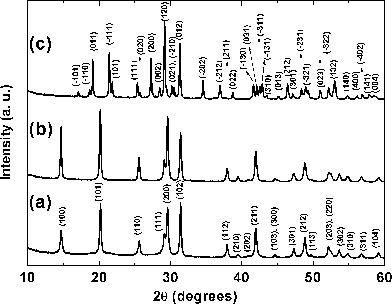
The powder XRD patterns of BiPO4·xH2O and Bi0.95Eu0.05PO4·xH2O samples as obtained by polyol-mediated method are shown in Fig. 2a and 2b, respectively. All the reflections were indexed based on hexagonal symmetry with reference to the standard pattern available in the JCPDS data base (No. 15-0766). The single phase formation of both BiPO4·xH2O and Bi0.95Eu0.05PO4·xH2O is clearly evident from the fact that there are no unidentified reflections in the XRD patterns. The similarity in the powder XRD patterns of BiPO4·xH2O and Bi0.95Eu0.05PO4·xH2O reveals their isostructural nature. The calculated hexagonal lattice parameters are listed in Table 1 and values of BiPO4·xH2O are in good agreement with the values available in JCPDS file. There is a marginal decrease in both ‘a’ and ‘c’ lattice parameters in the case of Bi0.95Eu0.05PO4·xH2O when compared to BiPO4 which is due to the smaller ionic radius of Eu3+ (1.07 Å) than that of Bi3+ (1.11 Å) in 8-fold coordination.19 The intense and broader reflections in the powder XRD patterns reveal the formation of the nanocrystallites. The crystallite sizes were calculated from the full width at half maximum (FWHM) of selected reflections using Scherrer’s formula.20 In the case of BiPO4·xH2O, the calculated crystallite sizes corresponding to the (100) and (110) reflections are 51 and 46 nm, respectively. Similar crystallite sizes were obtained for Bi0.95Eu0.05PO4·xH2O. Thus, the polyol-mediated synthesis yielded the nanocrystalline hexagonal BiPO4·xH2O and Bi0.95Eu0.05PO4·xH2O since a low temperature was involved in the synthesis.
 |
| | Fig. 2
Powder XRD patterns of (a) BiPO4·xH2O, (b) Bi0.95Eu0.05PO4·xH2O as obtained by polyol-mediated method and (c) Bi0.95Eu0.05PO4 obtained by calcination of (b) at 600 °C. | |
Table 1 Calculated lattice parameters of BiPO4 and Bi0.95Eu0.05PO4
| Lattice parameters |
BiPO4a |
Bi0.95Eu0.05PO4 |
| Hexagonala |
Monoclinicb |
|
α = β = 90.00°, γ = 120.00°.
α = 90.00°, β = 103.71°, γ = 90.00°
|
| ‘a’ (Å) |
6.9841(2) |
6.9790(1) |
6.7521(2) |
| ‘b’ (Å) |
6.9841(2) |
6.9790(1) |
6.9385(1) |
| ‘c’ (Å) |
6.4755(2) |
6.4702(2) |
6.4690(2) |
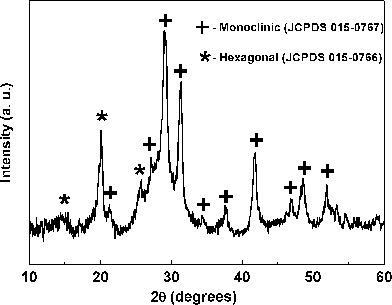
The hexagonal BiPO4·xH2O is known to form at room temperature with associated lattice water molecules (x = 0.5–0.67).9,10 Hexagonal BiPO4 consists of an open framework structure due to the symmetrical arrangement of chain of alternating BiO8 polyhedra and PO4 tetrahedra with zeolitic water molecules located in the channels parallel to ‘c’ axis as shown in Fig. 3a.9 In the case of monoclinic BiPO4, the chains are less symmetrically arranged and hence the structure consists of a compact space-filling network (Fig. 3c). Most of the reports on BiPO4 deals with the monoclinic phase since the syntheses were performed at relatively high temperatures. In the present study, BiPO4 was synthesized following the procedure described by Roming and Feldmann.5 However, the hexagonal BiPO4 has been obtained in the present study whereas the monoclinic phase was obtained by Roming and Feldmann. The reason for this could be the difference in the bismuth precursors used in both these studies. BiI3 was used by Roming and Feldmann whereas Bi(NO3)3·5H2O has been used in the present study. The presence of water molecules in the starting material could lead to the formation of hexagonal BiPO4·xH2O. The structurally analogous hexagonal LnPO4·xH2O [Ln = La, Ce, Nd, Sm, Eu, Gd and Tb] nanorods were synthesized starting from aqueous solutions of Ln(III) nitrates and NH4H2PO4 under solvothermal conditions in a microwave oven in which the aqueous condition might favor the formation of hexagonal phase.21 To confirm the role of water molecules, we carried out the polyol-mediated synthesis in which the Bi(NO3)3·5H2O in DEG was initially heated at 150 °C for 30 min in order to remove the water molecules present in the precursor. Then, the aqueous solution of (NH4)2HPO4 (4 ml) was carefully added to get the final product by the method as described in the experimental section. The powder XRD pattern of this sample (Fig. 4) revealed the presence of monoclinic BiPO4 as major phase and hexagonal BiPO4 as minor phase. The presence of additional hexagonal BiPO4 could be due to the trace amount of water remaining either in the bismuth precursor solution or from the aqueous solution of (NH4)2HPO4. However, the water in the phosphate precursor may not influence the phase formation as Roming and Feldmann used aqueous phosphate precursor in their synthesis of monoclinic BiPO4:Tb. This result substantiates that the water molecules associated with the bismuth precursor favours the formation of hexagonal BiPO4 rather than the monoclinic BiPO4 as obtained with non-aqueous precursor BiI3.5 A similar strategy has been adopted in the direct precipitation of monoclinic LaPO4.22 The water containing precursor La(NO3)3·6H2O was added to hot H3PO4 solution kept at 150 °C in order to avoid the participation of water molecules which would otherwise lead to the formation of hexagonal LaPO4·0.5H2O. Another possible reason for the formation of hexagonal BiPO4 could be the use of acidic Bi(NO3)3·5H2O precursor as the acidic environment favours the formation of hexagonal BiPO4·xH2O.9
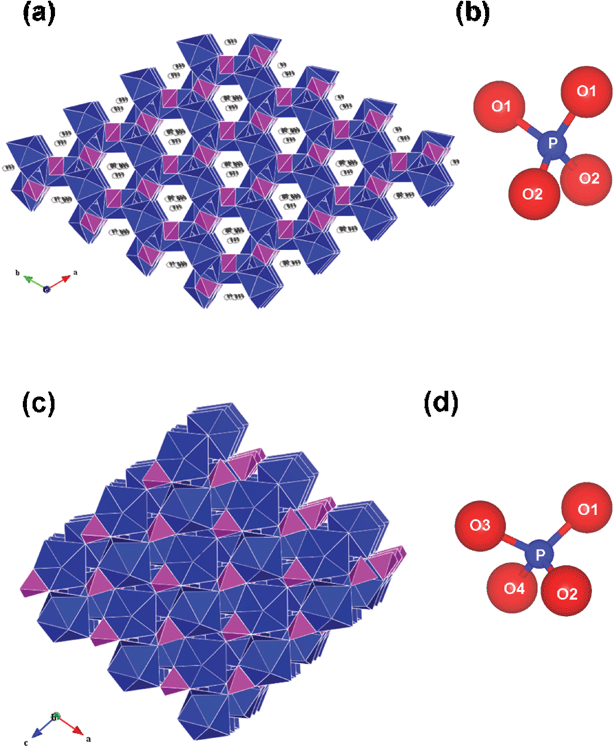 |
| | Fig. 3 Crystal structures of (a) hexagonal BiPO4·xH2O (with H2O molecules shown inside the channels) and (c) low-temperature monoclinic BiPO4 with BiO8 polyhedra (dark blue) and PO4 tetrahedra (majenta). The –PO4 tetrahedron of (b) hexagonal and (d) monoclinic BiPO4 are shown. Crystal structures are drawn using VESTA program40 using the atomic coordinates given in ref. 9. | |
 |
| | Fig. 4
Powder XRD pattern of BiPO4 obtained by polyol-mediated method with heating the precursor Bi(NO3)3·5H2O in DEG at 150 °C to remove H2O. The pattern contains both monoclinic BiPO4 (+, major phase) and hexagonal BiPO4 (* minor phase). | |
In order to convert the hexagonal Bi0.95Eu0.05PO4·xH2O into low temperature monoclinic phase and also to remove the zeolitic lattice water molecules and residual DEG molecules, the sample was calcined at 600 °C for 6 h. This temperature was chosen based on the thermogravimetric result that is shown in Fig. 1. In analogues LnPO4·xH2O [Ln = La and Ce], the hexagonal to low temperature monoclinic phase transition has been found by in situhigh temperature XRD to occur at about 600 °C.23Calcination of Bi0.95Eu0.05PO4·xH2O at 600 °C resulted in the phase transformation from hexagonal to low temperature monoclinic phase of Bi0.95Eu0.05PO4 as evident from the powder XRD (Fig. 2c) and all the reflections were indexed based on the standard pattern (JCPDS 015-0767). The zeolitic water molecules present in the open channels stabilize the hexagonal structure and the removal of which results in the irreversible transformation of the phase to low temperature monoclinic BiPO4 structure.10 The calculated lattice parameters (Table 1) of Bi0.95Eu0.05PO4 revealed a marginal decrease when compared to the lattice parameters available with standard pattern of undoped monoclinic BiPO4 and this is due to the substitution of Bi3+ by smaller Eu3+ ion. The calculated crystallite sizes of monoclinic Bi0.95Eu0.05PO4 from the FWHM of the reflections (200) and (012) using Scherrer's formula are 48 and 51 nm, respectively. This result shows that the calcination process had no influence on the particle growth which will be discussed in a later section.
3.2 Morphological analysis
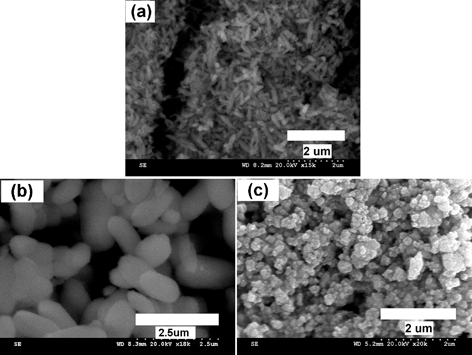
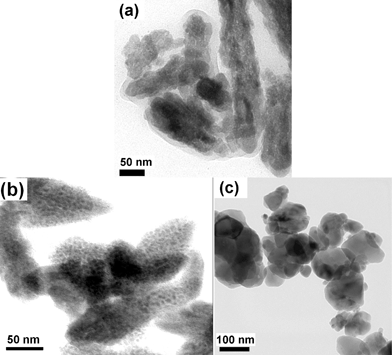
The morphologies of undoped and Eu3+ doped BiPO4·xH2O were analyzed by scanning and transmission electron microscopic techniques and the images are shown in Fig. 5 and 6, respectively. The SEM images of BiPO4·xH2O and Bi0.95Eu0.05PO4·xH2O (Fig. 5a and 5b) show that the particles are cocoon-like in shape and are uniformly distributed. The length of each cocoon is of 1 μm and the width is around 500 nm. A similar morphology of hexagonal BiPO4 was obtained by hydrothermal synthesis using glycerol/water solvent and the size of the nano-cocoons was around 100–150 nm.24 Based on the crystallite size calculated from the XRD results (∼50 nm), it is assumed that each micron sized cocoon is made up of compactly packed smaller primary nanoparticles of the size less than 100 nm. In order to observe this feature clearly, TEM analysis was carried out and from the images (Fig. 6a and 6b) it is clearly seen that the individual particles of sizes less than 50 nm are packed inside the cocoon-like secondary particles. An envelope of organic layer is seen over the particles and this could be the residual surface bound DEG. This result confirms that the primary particles are smaller in size of about 50 nm and correlates well with the crystallite sizes calculated from the powder XRD patterns of BiPO4 and Bi0.95Eu0.05PO4·xH2O. The morphology of monoclinic Bi0.95Eu0.05PO4 has changed from the cocoon-like larger particles into clusters of spherical nanoparticles as observed in SEM image (Fig. 5c). Further, the TEM image of monoclinic Bi0.95Eu0.05PO4 (Fig. 6c) shows the random aggregates of nanoparticles with the size ranging from 20 to 100 nm. These results clearly reveal that the effect of calcination (600 °C/6 h) is only on the morphology (arrangement of nanoparticles) and not on the particle size. This could be attributed to the presence of DEG that prevents the particle growth.
 |
| | Fig. 5
SEM images of hexagonal (a) BiPO4·xH2O, (b) Bi0.95Eu0.05PO4·xH2O as obtained by polyol-mediated method and (c) monoclinic Bi0.95Eu0.05PO4. | |
 |
| | Fig. 6
TEM images of hexagonal (a) BiPO4·xH2O, (b) Bi0.95Eu0.05PO4·xH2O as obtained by polyol-mediated method and (c) monoclinic Bi0.95Eu0.05PO4. | |
3.3 Role of DEG
In the polyol-mediated synthesis of undoped and Eu3+-doped BiPO4 nanoparticles, the DEG acts both as a solvent and a capping agent that prevents the primary nanoparticles to aggregate in a random fashion. DEG assisted in assembling the primary nanoparticles in a uniform manner to form a cocoon-like morphology. To confirm this, a simple precipitation of BiPO4 was carried out by adding diammonium hydrogen phosphate solution to an aqueous solution of bismuth nitrate at 80 °C to obtain the BiPO4 particles. The formation of hexagonal BiPO4·xH2O was confirmed from the powder XRD result (Fig. S1, ESI)†. The XRD pattern contained sharp and intense reflections revealing a highly crystalline material. The SEM image (Fig. S2, ESI)† showed the presence of large particles (0.2–1.0 μm) with random shapes varying from brick-like to irregular ones. This result confirms the role of DEG as a capping agent in preventing the random aggregation of primary BiPO4 nanoparticles and limiting the particle growth during the polyol-mediated synthesis. Further, on heat treatment at 600 °C for 6 h, the hexagonal Bi0.95Eu0.05PO4·xH2O converted into monoclinic Bi0.95Eu0.05PO4 by the removal of zeolitic water molecules as well as the surface bound DEG molecules. The thermal treatment also changed the morphology from the cocoon-like secondary particles into random aggregates of primary nanoparticles (Fig. 5c and more TEM images in Fig. S3 and S4, ESI† depicting the hexagonal Bi0.95Eu0.05PO4·xH2O and monoclinic Bi0.95Eu0.05PO4 respectively). This result suggests that the removal of surface bound DEG molecules on heating leads to the rupture of cocoons and the spill out of the primary nanoparticles from the cocoons to form the random and non-uniform spherical aggregates as depicted schematically in Fig. 7.
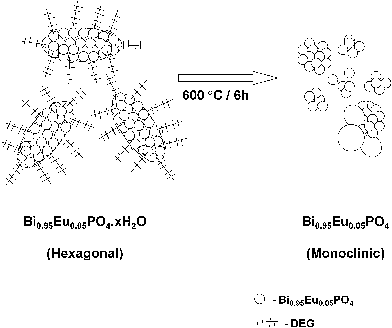 |
| | Fig. 7 Schematic illustration showing the conversion of cocoon-like morphology of Bi0.95Eu0.05PO4 stabilized by DEG into random spherical aggregates by heating at 600 °C by loss of DEG. | |
3.4 Spectral properties
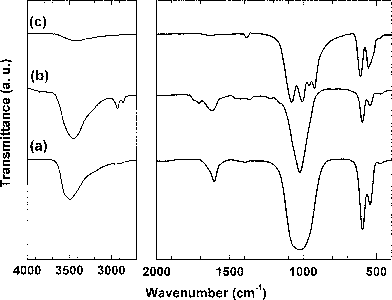
The FT-IR spectra of hexagonal BiPO4·xH2O, Bi0.95Eu0.05PO4·xH2O and monoclinic Bi0.95Eu0.05PO4 are shown in Fig. 8. The absorption band at 1022 cm−1 corresponds to the asymmetric stretching (ν3) vibration and the bands at 598 and 544 cm−1 are due to the asymmetric bending vibrations (ν4) of –PO4group.25 The observed ν3 absorption bands of hexagonal BiPO4·xH2O, Bi0.95Eu0.05PO4·xH2O (Fig. 8a and 8b) are more symmetric without any splitting when compared to that of monoclinic Bi0.95Eu0.05PO4 in which a splitting into four absorption bands is observed (Fig. 8c). Our result is similar to the one reported in the literature.10 The –PO4group in hexagonal BiPO4·xH2O has C2 symmetry with two different P–O bond lengths (1.5406 and 1.5341 Å) and it could be considered to have a pseudo-tetrahedral symmetry.10 The symmetry of –PO4group in monoclinic BiPO4 is C1 since all the four P–O bonds are different with lengths varying between 1.4684 and 1.5368 Å. This difference in the symmetry of the –PO4group resulted in the observed difference in the FT-IR spectra of hexagonal and monoclinic Bi0.95Eu0.05PO4. The absorptions at 3450 and 1620 cm−1 are due to the –OH stretching and HOH bending vibrations, respectively, of lattice water in undoped and Eu3+-doped BiPO4·xH2O.24 The absorption bands observed between 2800 and 3000 cm−1 correspond to the stretching vibrations of C–H bonds of DEG.26 These results indicate that the DEG molecules are adsorbed over the surface of BiPO4·xH2O and Bi0.95Eu0.05PO4·xH2O samples and are in agreement with the TGA results. A weak absorption band observed at ∼3400 cm−1 in monoclinic Bi0.95Eu0.05PO4 could be due to adsorbed moisture. Thus, the calcination of hexagonal Bi0.95Eu0.05PO4·xH2O converted it into monoclinic Bi0.95Eu0.05PO4 with the removal of zeolitic lattice water molecules.
 |
| | Fig. 8
FT-IR spectra of hexagonal (a) BiPO4·xH2O and (b) Bi0.95Eu0.05PO4·xH2O as obtained by polyol-mediated method; (c) monoclinic Bi0.95Eu0.05PO4 obtained after calcination of (b) at 600 °C. | |
The laser Raman spectra of hexagonal BiPO4·xH2O and Bi0.95Eu0.05PO4·xH2O and monoclinic Bi0.95Eu0.05PO4 are shown in Fig. 9a–c. Broad bands were observed with the hexagonal BiPO4·xH2O and Bi0.95Eu0.05PO4·xH2O samples and this could be due to the presence of zeolitic water molecules and the residual organics. The Raman spectrum of monoclinic Bi0.95Eu0.05PO4 contains relatively narrow bands which are clearly distinguishable from the hexagonal phase. In all the three spectra, the observed intense line at 170 cm−1 and a shoulder at 231 cm−1 are due to the stretching vibration modes of heavy metal ion, Bi3+ (Bi–O), in BiO8 polyhedron.27,28 The Peaks at 1035 and 966 cm−1 are due to the asymmetric (ν3) and symmetric (ν1) stretching vibrations of the –PO4group, respectively. The bands in the region between 550 and 600 cm−1 correspond to the ν4 bending vibration modes of –PO4groups.12 The weak bands at 403 and 458 cm−1 can be assigned to the ν2 bending vibration of –PO4 units. Though the structural symmetry difference between hexagonal and monoclinic Bi0.95Eu0.05PO4 has been reflected in the FT-IR spectral results, we could not find the difference in the Raman spectra due to the observed broadness in the spectra of both undoped and Eu3+-doped hexagonal BiPO4.
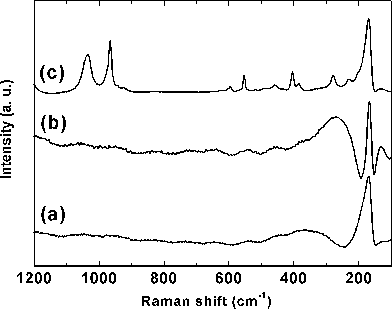 |
| | Fig. 9 Laser Raman spectra of hexagonal (a) BiPO4·xH2O, (b) Bi0.95Eu0.05PO4·xH2O and (c) monoclinic Bi0.95Eu0.05PO4. | |
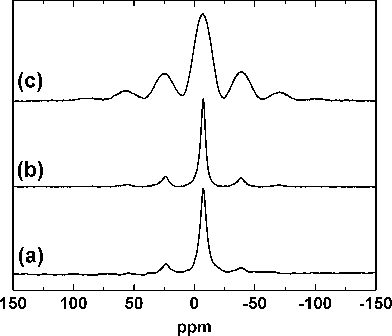
We, for the first time, report here the 31P MAS-NMR spectral results of hexagonal as well as monoclinic BiPO4 and attempted to reason out the difference observed between them. The 31P MAS-NMR spectra of hexagonal BiPO4·xH2O, Bi0.95Eu0.05PO4·xH2O, and monoclinic Bi0.95Eu0.05PO4 are shown in Fig. 10a–c, respectively. Only one line is expected for 31P nucleus in a given site since the nuclear spin (I) is ½. The NMR spectra consisted of one major signal flanked by small bands. The small bands were identified as spinning side bands since their positions uniformly shifted when the spectra were recorded under different spinning rates (see Fig. S5 in ESI)†.29 However, the position of the major signal remained unaltered and this result reveals that 31P exhibits only one signal in both undoped and Eu3+-doped BiPO4 with hexagonal and monoclinic structures. This result is also in agreement with the crystal structure of BiPO4 in which the P atom occupies only one crystallographic site.9,10 The chemical shifts observed with the major line are −7.39 and −7.21 ppm for hexagonal BiPO4·xH2O and Bi0.95Eu0.05PO4·xH2O, respectively. The chemical shift of the major line of monoclinic Bi0.95Eu0.05PO4 is −6.88 ppm. The major difference between the hexagonal and monoclinic Bi0.95Eu0.05PO4 is the broadness in the signal as well as the appearance and intensities of spinning side bands. The 31P MAS-NMR signal of monoclinic Bi0.95Eu0.05PO4 is broader than that of hexagonal phase. The relative intensities of spinning side bands are higher with the monoclinic BiPO4 when compared with the hexagonal phase. In general, the NMR signal in the solid state is broad due to the anisotropic nature in the spin–lattice and spin–spin relaxation processes and the relaxation is predominantly by spin–spin interaction.30 The FWHM values of the main signal of hexagonal Bi0.95Eu0.05PO4·xH2O and monoclinic Bi0.95Eu0.05PO4 are 754 and 2729 Hz, respectively. This shows that there is a difference in the spin–spin and/or spin–lattice relaxation. The presence of zeolitic water molecules and residual DEG may play a role in the case of hexagonal Bi0.95Eu0.05PO4. The broadening of 31P MAS-NMR signal was observed in analogous hexagonal LaPO4·0.5H2O during its conversion into anhydrous hexagonal phase and finally to monoclinic LaPO4 upon heating.23 This broadening was attributed to the increase in the distribution of –PO4 tetrahedron local environments in the monoclinic structure. In the present study, the difference in FWHM of NMR signal between hexagonal Bi0.95Eu0.05PO4·xH2O and monoclinic Bi0.95Eu0.05PO4 could be due to the difference in the crystal structure and symmetry. The internuclear distance between 31P nuclei are different in hexagonal (4.1802 Å) and monoclinic (4.0294 and 5.3535 Å) BiPO4.10 Hence, there could be anisotropic relaxation of spins in monoclinic BiPO4 due to the two different P–P distances and this may result in the observed broadening of the NMR signal. The surface bound DEG molecules stabilize the hexagonal Bi0.95Eu0.05PO4·xH2O nanoparticles in the form of cocoons and due to this the spin–spin relaxation between 31P nuclei in nanoparticles of different cocoons becomes less efficient leading to narrow spectrum. On the other hand, in monoclinic Bi0.95Eu0.05PO4, the relaxation between 31P nuclei of different nanoparticles among the random aggregates may be more efficient resulting in the broad spectrum. A detailed measurement of the relaxation times and theoretical NMR spectral simulations may provide a better understanding of the observed broadening of signal in the 31P MAS-NMR spectra.
 |
| | Fig. 10
31P MAS-NMR spectra of hexagonal (a) BiPO4·xH2O, (b) Bi0.95Eu0.05PO4·xH2O and (c) monoclinic Bi0.95Eu0.05PO4. | |
3.5 Optical properties
The optical properties of undoped and Eu3+-doped BiPO4 samples were studied by DRUV-Vis absorption and PL spectroscopic techniques. The DRUV-Vis absorption spectra of hexagonal BiPO4·xH2O, Bi0.95Eu0.05PO4·xH2O, and monoclinic Bi0.95Eu0.05PO4 are shown in Fig. 11. In all the three spectra, the absorption band shows a splitting with the maxima around 225 and 255 nm. Such absorptions in the UV region originate mainly from the optical transitions 1S0→1P1 and 1S0→3P1 of 6s2 lone pair cation Bi3+.31 From Fig. 11, it is clear that the absorption onset lies in the UV region at ∼320 nm and there is no difference in the absorption onset between hexagonal and monoclinic Bi0.95Eu0.05PO4. The estimated optical band gap [inset (i) in Fig. 11] for BiPO4 from the Kubelka-Munk function is 3.90 eV which is in close agreement with the literature report (3.85 eV).7 A closer look at the absorption spectrum of monoclinic Bi0.95Eu0.05PO4 reveals a shoulder at around 290 nm. This could be due to the Eu3+–O2− charge transfer (c.t.) absorption band. In order to find this more clearly, the spectrum was deconvoluted into three bands with the absorption maxima at 222, 255 and 285 nm. This clearly reveals the presence of both Bi3+ as well as Eu3+ absorption bands which is in good agreement with the analysis by Blasse according to which the optical absorptions of Bi3+ (S–P transition) and Eu3+ (Eu3+–O2− c.t.) occur closely in the UV region.31
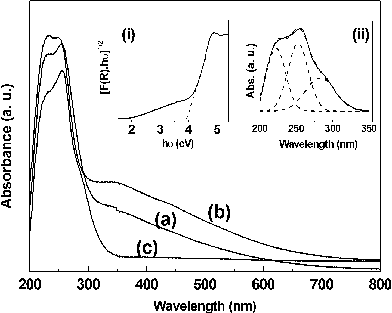 |
| | Fig. 11 Diffuse reflectance UV-Vis absorption spectra of hexagonal (a) BiPO4·xH2O, (b) Bi0.95Eu0.05PO4·xH2O and (c) monoclinic Bi0.95Eu0.05PO4. The insets (i) the Kubelka-Munk function revealing the optical band gap of hexagonal BiPO4 and (ii) the deconvolution of absorption spectrum of monoclinig Bi0.95Eu0.05PO4 revealing three absorption bands. | |
In the case of hexagonal BiPO4·xH2O and Bi0.95Eu0.05PO4·xH2O, an enhanced absorption in the visible region from 400 to 700 nm is observed and such absorption is completely absent in monoclinic Bi0.95Eu0.05PO4. This could be due to the presence of residual DEG molecular species over the surface of the phosphate nanoparticles which is also evident from the FT-IR spectroscopic results. There is a possibility of formation of composite of BiPO4 and organic DEG molecular species through phosphate ester linkage. Recently in the literature, a similar additional broad absorption in the region between 290 and 550 nm has been observed in the DRUV-Vis spectrum of LaPO4:Eu3+ nanorods capped with oleic acid (OA).32 This additional absorption has been attributed to the formation of midgap states due to the chemical bonding between OA and LaPO4:Eu3+. A similar interaction between residual DEG and BiPO4 may result in such enhanced absorption in the visible region for hexagonal BiPO4·xH2O and Bi0.95Eu0.05PO4·xH2O in the present study. However, the exact reason for the origin of such absorption is not clear at this moment. The calcination step (600 °C/6 h.) involved in the synthesis of monoclinic Bi0.95Eu0.05PO4 resulted in the complete removal of DEG molecules and hence the disappearance of visible light absorption in the DRUV-Vis spectrum of this sample. The presence of visible light absorption in hexagonal Bi0.95Eu0.05PO4·xH2O may either enhance the PL emission properties through sensitization or diminish the emission from Eu3+ by blocking the light absorption by the active center. The influence of such absorption on the PL properties is discussed below.
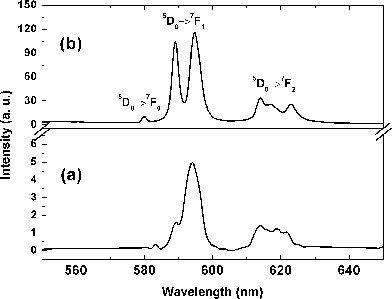
We recorded the PL excitation and emission spectra of monoclinic Bi0.95Eu0.05PO4 obtained by conventional solid state reaction method as a reference (Fig. S6 in ESI)†. The excitation spectrum showed the high intense peak at 395 nm which is due to 7F0-5L6 absorption of Eu3+. We did not observe any emission from the host BiPO4 and this result is in agreement with the literature report.5 The PL emission spectrum of hexagonal Bi0.95Eu0.05PO4·xH2O as obtained by polyol method is shown in Fig. 12a. The observed emissions of hexagonal Bi0.95Eu0.05PO4·xH2O were due to different emission transitions originating from 5D0 state (5D0→7Fj=0,1,2) of Eu3+. However, the emission intensities are very low. The possible reason stems from the DRUV-Vis spectral result in which hexagonal Bi0.95Eu0.05PO4·xH2O exhibited an enhanced absorption in the visible region when compared to that of monoclinic Bi0.95Eu0.05PO4 . This absorption from the surface bound DEG molecules resulted in the pale yellow color of hexagonal BiPO4·xH2O and Bi0.95Eu0.05PO4·xH2O samples possibly by the formation of a composite of DEG and BiPO4. Thus, the effective light absorption by Eu3+ during excitation may be hindered due to the absorption by surface bound organics which thereby reduces the emission intensity. There are also chances of re-absorption of light emitted by Eu3+ in the visible region (550–650 nm) by surface bound DEG molecules resulting in the poor emission intensity. Another possible reason could be the presence of lattice H2O molecules and the residual DEG in the sample which could quench the PL emission through a non-radiative emissive transition.33,34 In the case of BiPO4:Tb3+ synthesized by polyol-method using DEG, an enhancement in the emission intensity was observed with increase in the calcination temperature.5 We believe that this could be due to the complete removal of the surface bound DEG molecules by calcination. Our results also reveal that the surface bound DEG molecules have a deteriorating effect on the PL emission of Bi0.95Eu0.05PO4·xH2O despite its role as a stabilizer of the nanoparticles. The PL emission spectrum of monoclinic Bi0.95Eu0.05PO4 obtained by calcination of hexagonal sample is shown in Fig. 12b. We could clearly observe the enhancement in the intensity of orange emission caused by the magnetic dipole transition 5D0→7F1 of Eu3+ ion. Due to the difference in the crystal structures and symmetry between hexagonal and monoclinic BiPO4, a difference in the emission spectral feature for 5D0→7F1 transition of Eu3+ was observed.35–37 A difference in the PL emission properties of the hexagonal and monoclinic EuPO4 nanoparticles was previously reported in the literature.38 The ratio of 5D0→7F2/5D0→7F1 transitions increased with the loss of water within the hexagonal phase while the emission decreased with the conversion of hexagonal EuPO4 into monoclinic phase. In the hexagonal Bi0.95Eu0.05PO4·xH2O, a broad emission line centered at 594 nm with a shoulder at 589 nm is observed for the 5D0→7F1 transition whereas a resolved doublet (at 585 and 594 nm) with equal intensities is observed in monoclinic Bi0.95Eu0.05PO4. The observed Eu3+ emission spectrum of monoclinic BiPO4 is in agreement with the reported one.6 It is known that the nanophosphors are much less efficient than the corresponding micron-sized phosphors.39 The organic capping agents stabilize the nanoparticles by preventing the random aggregation of particles and limiting the particle growth. At the same time, these capping agents could create surface trap states that quench the PL emission of the nanophosphors. Alternate organic stabilizers are necessary to realize higher efficiencies with the rare earth based nanophosphors and optimization of particle size is also important in bridging the gap in PL emission efficiency between the nano and bulk phosphors.
 |
| | Fig. 12
PL emission spectra (λexc. = 395 nm) of (a) hexagonal Bi0.95Eu0.05PO4·xH2O as obtained by polyol-mediated method and (b) monoclinic Bi0.95Eu0.05PO4 obtained by calcination of (a) at 600 °C. | |
4 Conclusions
Crystalline hexagonal BiPO4·xH2O and Bi0.95Eu0.05PO4·xH2O nanoparticles were synthesized by a polyol-mediated method. The water molecules present in the precursor, Bi(NO3)3·5H2O, favoured the formation of hydrated hexagonal BiPO4. The hexagonal Bi0.95Eu0.05PO4·xH2O was converted into monoclinic Bi0.95Eu0.05PO4 with the loss of zeolitic lattice water molecules on heating at 600 °C. The morphological analysis by SEM and TEM showed the size of the primary nanoparticles is much less than 50 nm in the undoped and Eu3+-doped hexagonal as well as monoclinic BiPO4. The primary nanoparticles were stabilized by DEG to arrange themselves into cocoon-like microcrystallites. The DEG molecules could play an important role in retaining the particle size even after annealing at 600 °C at which the phase transition from hexagonal to monoclinic occurs. The crystal structural symmetry difference between the hexagonal and monoclinic BiPO4 phase is evident from the spectral results of FT-IR, 31P MAS-NMR and Eu3+ PL spectroscopies. The observed weak PL emission intensity of hexagonal Bi0.95Eu0.05PO4·xH2O could be due to the presence of zeolitic water as well as surface bound residual DEG molecules which on removal led to the enhancement in the emission intensity along with the phase transition from hexagonal to monoclinic structure. The hexagonal BiPO4·xH2O nanoparticles could find potential application in shape selective catalysis due to its open framework structure with hexagonal tunnels.
Acknowledgements
The authors acknowledge the Central Instrumentation Facility (CIF) of CECRI for the characterization facilities. Prof. U.V. Varadaraju and Dr Asiri Naidu of IIT Madras are acknowledged for their help in recording the PL spectra. The structure model was drawn using VESTA program.40
References
- T. S. Chang, G. J. Li, C. H. Shin, Y. K. Lee and S. S. Yun, Catal. Lett., 2000, 68, 229–234 Search PubMed.
- V. G. Alekseev, I. P. Gorelov and M. V. Kornilov, J. Anal. Chem., 2000, 55, 1055–1057 CAS.
- I-S. Cho, J. R. Kim, D. W. Kim and K. S. Hong, J. Electroceram., 2006, 16, 379–383 Search PubMed.
- Z. Holgye and R. Poliak, J. Radioanal. Nucl. Chem., 1991, 153, 267–272 CAS.
- M. Roming and C. Feldmann, J. Mater. Sci., 2009, 44, 1412–1415 CrossRef CAS.
- M. Guan, J. Sun, F. Tao and Z. Xu, Cryst. Growth Des., 2008, 8, 2694–2697 CrossRef CAS.
- C. Pan and Y. Zhu, Environ. Sci. Technol., 2010, 44, 5570–5574 CrossRef CAS.
- C. Pan and Y. Zhu, J. Mater. Chem., 2011, 21, 4235–4241 RSC.
- R. C. L. Mooney-Slater, Z. Kristallogr., 1962, 117, 371–385 CrossRef CAS.
- B. Romero, S. Bruque, M. A. G. Aranda and J. E. Iglesias, Inorg. Chem., 1994, 33, 1869–1874 CrossRef CAS.
- Y. F. Lin, H. W. Chang, S. Y. Lu and C. W. Liu, J. Phys. Chem. C, 2007, 111, 18538–18544 CrossRef CAS.
- J. Geng, W. H. Hou, Y. N. Lv, J. J. Zhu and H. Y. Chen, Inorg. Chem., 2005, 44, 8503–8509 CrossRef CAS.
- M. Yang, N. K. Shrestha, R. Hahn and P. Schmuki, Electrochem. Solid-State Lett., 2010, 13, C5–C8 CrossRef CAS.
- C. Feldmann and H. O. Jungk, Angew. Chem., Int. Ed., 2001, 40, 359–362 CrossRef CAS.
- C. Feldmann, Adv. Funct. Mater., 2003, 13, 101–107 CrossRef CAS.
-
G. Blasse and B. C. Grabmaier, Luminescent Materials, Springer-Verlag, Berlin, 1994 Search PubMed.
- G. Blasse and A. Bril, J. Inorg. Nucl. Chem., 1967, 29, 2231–2241 Search PubMed.
- B. Glorieux, M. Matecki, F. Fayon, J. P. Coutures, S. Palau, A. Douy and G. Peraudeau, J. Nucl. Mater., 2004, 326, 156–162 CrossRef CAS.
- R. D. Shannon and C. T. Prewitt, Acta Crystallogr., Sect. B: Struct. Crystallogr. Cryst. Chem., 1969, 25, 925–946 CrossRef CAS.
-
A. R. West, Solid State Chemistry and its Applications, John Wiley and Sons, New York, 1984 Search PubMed.
- C. R. Patra, G. Alexandra, S. Patra, D. S. Jacob, A. Gedanken, A. Landau and Y. Gofer, New J. Chem., 2005, 29, 733–739 RSC.
- M. T. Schatzmann, M. L. Mecartney and P. E. D. Morgan, J. Mater. Chem., 2009, 19, 5720–5722 RSC.
- S. Lucas, E. Champion, D. Bernache-Assollant and G. Leroy, J. Solid State Chem., 2004, 177, 1312–1320 CrossRef CAS.
- F. Xue, H. B. Li, Y. C. Zhu, S. L. Xiong, X. W. Zhang, T. T. Wang, X. Liang and Y. Qian, J. Solid State Chem., 2009, 182, 1396–1400 CrossRef CAS.
-
K. Nakamoto, Infrared and Raman Spectra of Inorganic and Coordination Compounds, Part A, John Wiley and Sons, New York, 1997.
- S. Takeshita, J. Honda, T. Isobe, T. Sawayama and S. Nikura, Cryst. Growth Des., 2010, 10, 4494–4500 CrossRef CAS.
- A. Moguš-Milanković, A. Šantić, V. Ličina and D. E. Day, J. Non-Cryst. Solids, 2005, 351, 3235–3245 Search PubMed.
- N. Kitamura, K. Ohno, K. Fukumi, J. Nakamura, T. Hidaka, T. Ikeda, H. Hashima, H. Kozuka and J. Nishii, Jpn. J. Appl. Phys., 2010, 49, 082601–1-082601-4 Search PubMed.
-
W. Kemp, Organic Spectroscopy, 3rd Ed., The Macmillan Press Ltd., Hong Kong, 1994 Search PubMed.
-
R. S. Macomber, A. Complete Introduction to Modern NMR Spectroscopy, John Wiley & Sons, Inc., New York, 1998 Search PubMed.
- G. Blasse, J. Solid State Chem., 1972, 4, 52–54 CrossRef CAS.
- L. Li, Y. Su and G. Li, J. Mater. Chem., 2010, 20, 459–465 RSC.
- S. W. Buckner, R. L. Konold and P. A. Jelliss, Chem. Phys. Lett., 2004, 394, 400–404 CrossRef CAS.
- A. K. Gulnar, V. Sudarsan, R. K. Vatsa, R. C. Hubli, U. K. Gautam, A. Vinu and A. K. Tyagi, Cryst. Growth Des., 2009, 9, 2451–2456 CrossRef CAS.
- G. Blasse, A. Bril and W. C. Nieuwpoort, J. Phys. Chem. Solids, 1966, 27, 1587–1592 CrossRef CAS.
- N. Lakshminarasimhan and U. V. Varadaraju, J. Solid State Chem., 2004, 177, 3536–3544 CrossRef CAS.
- N. Lakshminarasimhan and U. V. Varadaraju, J. Solid State Chem., 2005, 178, 3284–3292 Search PubMed.
- C. Zollfrank, H. Scheel, S. Brungs and P. Greil, Cryst. Growth Des., 2008, 8, 766–770 Search PubMed.
- J. M. Phillips, M. E. Coltrin, M. H. Crawford, A. J. Fischer, M. R. Krames, R. Mueller-Mach, G. O. Mueller, Y. Ohno, L. E. S. Rohwer, J. A. Simmons and J. Y. Tsao, Laser Photonics Rev., 2007, 1, 307–333 Search PubMed.
- K. Momma and F. Izumi, J. Appl. Crystallogr., 2008, 41, 653–658 CrossRef CAS.
|
| This journal is © The Royal Society of Chemistry 2012 |
Click here to see how this site uses Cookies. View our privacy policy here. 
![[thin space (1/6-em)]](https://www.rsc.org/images/entities/char_2009.gif) -
-![[thin space (1/6-em)]](https://www.rsc.org/images/entities/char_2009.gif) -
-![[thin space (1/6-em)]](https://www.rsc.org/images/entities/char_2009.gif) -) as obtained by polyol-mediated synthesis and (c) Bi0.95Eu0.05PO4 (-
-) as obtained by polyol-mediated synthesis and (c) Bi0.95Eu0.05PO4 (-![[thin space (1/6-em)]](https://www.rsc.org/images/entities/char_2009.gif) ·
·![[thin space (1/6-em)]](https://www.rsc.org/images/entities/char_2009.gif) ·
·![[thin space (1/6-em)]](https://www.rsc.org/images/entities/char_2009.gif) -) obtained after calcinations of (b) at 600 °C/6 h.
-) obtained after calcinations of (b) at 600 °C/6 h.


