Selective adsorption and photocatalysis of low-temperature base-modified anatase nanocrystals†
Manoj A.
Lazar
* and
Walid A.
Daoud
*
School of Applied Sciences and Engineering, Monash University, Churchill VIC, 3842, Australia. E-mail: Walid.Daoud@monash.edu (Walid A. Daoud), manoj.ainikalkannath@monash.edu (Manoj A. Lazar); Fax: +61 3 990 26738; Tel: +61 3 990 26411
First published on 8th November 2011
Abstract
Anatase titania photocatalysts with positive (TSC60) and negative (TAH60) surface charge were synthesized by extraction with Na2CO3 and NH4OH, respectively, from an acid stabilized sol at low temperature. XRD, TEM, N2 adsorption and ζ –potential were conducted and revealed that the low-temperature synthesized catalysts differ mainly in their surface charge. These catalysts exhibited opposing preferential adsorption and fully selective photocatalysis of methylene blue (MB) and methyl orange (MO) dyes from their aqueous mixture. The preferential adsorption behaviour toward MB and MO was attributed to the catalyst's surface charge whereas the selective photocatalysis was explained by a combined effect of surface charge and crystallinity. On the other hand, the calcined catalysts showed considerable reduction in their dye adsorption capacity and loss of their selective dye degradation. The reduction in surface charge and increase in crystallinity after calcination were found to be responsible for these observations. Degussa P25 was also tested and compared with synthesized catalysts with regard to dye adsorption and photocatalysis. A mechanism for the selective dye positioning on TSC60 and TAH60 coated FTO/ITO plate is also proposed.
Introduction
Nanocrystalline TiO2 is unique in its ability toward photocatalytic mineralization of a wide range of pollutants.1 On one hand, its high activity leads to complete degradation of organic contaminants irrespective of their nature, but on the other hand this limits its use in selective catalysis. By changing the physico-chemical properties of TiO2/titanate, researchers have recently shown that it can be used as a selective photocatalyst in the degradation of contaminants,2–20 organic transformations,21–23 separation of molecules,24 destruction of cancer cells and in drug delivery.25 Selectivity of TiO2 can be achieved through several ways such as controlling the pH of the reaction mixture,2–4 using larger anatase particles (10–25 nm),6 creating molecular recognition sites on TiO2,7 using the less reactive rutile phase,21 or mesoporous anatase,23 and forming nano-channelled TiO2 film with desired pore diameter.24 Molecular imprinting with polymers/inorganic oxides on TiO2 surface, along with the formation of footage of the target molecule, is another established method to achieve selective photocatalysts.10–14 Surface treatments on TiO2, such as organo-grafting with n-octyl triethoxysilane15, chelation using arginine16 or silylation,17 could also confer selective photocatalysis in degradation and organic transformation reactions. Exploiting the properties of TiO2-mesoporous silica composites, such as diffusion of the adsorbed substrates,5 hydrophilicity,18 and pore diameter,19 researchers have used them for their selective catalytic applications.Li-titanate8 and ETS-109,22 have also showed selective photocatalysis because of their unique interlayer distance properties and pore structures. TiO2 nanotubes engulfed with ferroin and produced by a simple synthetic route have successfully been tested for their magnetically guided cancer cell destruction on selected areas and for their site-selective photo-induced drug release.25
Organic dyes have wide application in our daily life and are integral part of industrial effluent. In reality, out of 450![[thin space (1/6-em)]](https://www.rsc.org/images/entities/char_2009.gif) 000 tons of annually produced organic dyes more than 11% is lost in industrial wastes during their manufacture and application processes.26 Since many of these dyes are toxic and most of them are potential carcinogens, their presence in effluents is a major environmental concern. As a consequence, selective adsorption and photocatalytic decomposition of dyes is of great importance. Different adsorbents has been reported for the selective adsorption of cationic and anionic dyes based on the surface charge of the adsorbents and their electrostatic interactions with the dye molecules.27–30 However, selective adsorption of dyes by nanocrystalline titanium dioxide has potential advantage in the simultaneous selective destruction by means of photocatalysis.31 This phenomenon could be further extended to the tailored selection of dyes based on their affinity toward nanocrystalline TiO2, in order to increase the dye adsorption and hence maximize the photon-to-electricity conversion performance of dye sensitized solar cells (DSSCs).32 Furthermore, selective positioning of different dyes on TiO2 could also be possible, which in turn could increase the efficiency of DSSCs.33
000 tons of annually produced organic dyes more than 11% is lost in industrial wastes during their manufacture and application processes.26 Since many of these dyes are toxic and most of them are potential carcinogens, their presence in effluents is a major environmental concern. As a consequence, selective adsorption and photocatalytic decomposition of dyes is of great importance. Different adsorbents has been reported for the selective adsorption of cationic and anionic dyes based on the surface charge of the adsorbents and their electrostatic interactions with the dye molecules.27–30 However, selective adsorption of dyes by nanocrystalline titanium dioxide has potential advantage in the simultaneous selective destruction by means of photocatalysis.31 This phenomenon could be further extended to the tailored selection of dyes based on their affinity toward nanocrystalline TiO2, in order to increase the dye adsorption and hence maximize the photon-to-electricity conversion performance of dye sensitized solar cells (DSSCs).32 Furthermore, selective positioning of different dyes on TiO2 could also be possible, which in turn could increase the efficiency of DSSCs.33
Our present paper reports the development of two nanocrystalline TiO2 photocatalysts which show preferential adsorption and fully selective photocatalytic degradation of one dye over the other from an aqueous mixture of methyl orange (MO) and methylene blue (MB). A mechanism for the selective positioning of cationic (MB) and anionic (MO) dyes on the low-temperature synthesized TiO2 photocatalysts is also proposed.
Experimental methods
Synthesis of the photocatalysts
The synthesis of TiO2 photocatalysts was carried out through an acid-stabilized sol–gel method, developed by our group,34 followed by base extraction. TSC60 and TAH60 photocatalysts were synthesized by hydrolysis and condensation reaction of 5% titanium tetraisopropoxide (Sigma Aldrich), to form an acidic aqueous sol containing 5% acetic acid (Rowe Scientific, Australia) and 1.4% hydrochloric acid (Merck). The mixture was heated at 60 °C under vigorous stirring for 2 h. The extraction of TSC60 and TAH60 anatase powder from the sol was achieved by adding sufficient amount of Na2CO3 and NH4OH solutions, respectively. The resulting solids were collected by centrifugation and washed with distilled water, until the pH of the washing became 7, and then dried at 60 °C for 12 h. A portion of the products was then calcined at 500 °C for 2 h to obtain TSC500 and TAH500.Characterizations
Powder X-ray diffraction was performed with Cu Kα radiation on a Bruker D8 Advance X-ray diffractometer. Transmission electron microscopy was performed on JEOL JEM 2100F FEG TEM, operated at 200 kV. Nitrogen adsorption measurements at 77.4 K were carried out in a static volumetric system (Micromeritics Instrument Corporation, USA, model ASAP 2010) up to 1.12 bar pressure. ζ –potential analysis was conducted on catalyst samples dispersed in distilled water using a Zeta-Potential/Sizer Instrument (Malvern).Adsorption studies
Adsorption studies were conducted under dark by stirring 50 mL of ≈10 mgL−1 MO (λmax = 466 nm) & MB (λmax = 662 nm) dye mixture solution with 1 g L−1 P25, TSC60 and TAH60 catalysts separately in a 100 mL beaker for 30 min. Amount of adsorption of each dye was then determined from the decrease in the UV-Vis absorption of each dye which was analyzed by a UV-Vis Spectrophotometer (Varian Carry 3E). The catalyst powder was separated from the mixture by centrifugation, before performing the UV-Vis absorption analysis. The adsorption study of TSC500 and TAH500 was also performed using 50 mL of ≈ 10 mg L−1 of individual dye solutions.Photocatalytic experiments
All photocatalytic reactions were carried out in a 100 mL beaker, placed in an ice bath in order to minimize evaporation, with 50 mL of ≈5 mg L−1 MO & MB dye mixture solution and a catalyst concentration of 1 g L−1. The reaction mixture was stirred for 30 min under dark, for the adsorption equilibrium to be established, before exposure to UV light and stirring was continued throughout the reaction. Dye degradation was monitored by the decrease in the absorption at λmax of each collected sample (≈4 mL) withdrawn at pre-determined time intervals. The catalyst powder was separated from the mixture by centrifugation, before performing the UV-Vis absorption analysis.Results
Material properties
Powder XRD analysis showed that both TSC60 and TAH60 comprise of anatase crystals (Fig. 1a) with the characteristic 2θ peak at 25.3°. All other peaks are indexed to the different planes of anatase TiO2. TSC60 and TAH60 have an average anatase crystallite size of 6 and 5.5 nm, respectively, as calculated using the Scherrer equation35 (Table 1). Calcination of TSC60 and TAH60 samples at 500 °C increased the crystallinity of the corresponding TSC500 and TAH500 samples as evidenced from their intense diffraction patterns (Fig. 1b). TSC500 and TAH500 comprise mainly of anatase phase along with small amount of rutile phase (2θ = 27.5°) as a result of the high temperature treatment. Calcination also caused enlargement of average anatase crystallite size of TSC500 and TAH500 to 15 and 12 nm, respectively, as calculated using the Scherrer equation (Table 1). Nitrogen adsorption analysis of TSC60 and TAH60 recorded the reported35 adsorption isotherm (Fig. S1)† for mesoporous materials (type II in the initial P/P0 region followed by type IV) with H2 type hysteresis loop, one that is usually associated with mesopores having narrow necks and wide bodies (‘ink bottle’ pores).35,36 TSC60 and TAH60 showed similar pore size distribution with a maximum average pore diameter of 4 nm (Fig. S2)†. We believe the porous nature of TSC60 and TAH60 originated from the unique dispersion stability of the acid-stabilized sol, where extraction with base resulted in highly porous products. The calculated surface areas of TSC60 and TAH60 were 280 and 360 m2 g−1, respectively (Table 1). The surface area of calcined samples, TSC500 and TAH500, dropped to 80 and 90 m2 g−1, respectively, due to crystal growth during the high temperature treatment, which is in agreement with the XRD analysis. TEM analysis revealed that the as-prepared TSC60 and TAH60 catalysts were equi-axed (Fig. S3)† crystals and has size of 5–8 nm. This is in agreement with the average anatase crystallite size calculated using the Scherrer equation. ζ –potential analysis was conducted on all synthesized and Degussa P25 catalysts in order to study their surface charge, which is shown in Table 1. When dispersions of the catalysts in distilled water were analyzed for ζ –potential; P25 (+30 mV), TSC60 (+40 mV) and TSC500 (+17 mV) showed positive surface charge whereas TAH60 (−35 mV) and TAH500 (−9 mV) showed negative surface charge. Degussa P25 is produced by flame hydrolysis of TiCl4 at >1200 °C with HCl as by-product.1 Although TSC60 and TAH60 powders were extracted from the same acid stabilized sol by the addition of Na2CO3 and NH4OH solutions, respectively, they showed opposite surface charge. Due to calcination, there was a considerable decrease in the surface charge of TSC500 (from +40 to +17) and of TAH500 (from −35 to −9).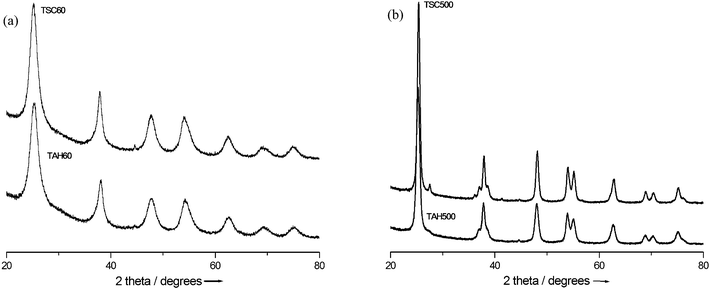 | ||
| Fig. 1 Powder X-ray diffraction of (a) as-prepared and (b) calcined catalysts. | ||
Adsorption of dyes
All the synthesized catalysts and P25 were tested for their dye adsorption behaviour towards cationic (MB) and anionic (MO) dyes. The results of the adsorption studies performed on 50 mL of MO and MB aqueous mixture (≈10 mgL−1) with a catalyst concentration of 1 gL−1 are shown in Fig. 2. P25 and TSC60 exhibited preferential adsorption of MO over MB where TSC60 showed slightly higher adsorption than P25. P25 adsorbed 16% of MO and 3% of MB whereas TSC60 adsorbed 23% of MO and 4% of MB from the solution. Conversely, under the same experimental conditions TAH60 showed almost completely selective adsorption of MB (96%) over MO (3%). It was found that the adsorption capacity of TSC60 and TAH60 decreased substantially after heat treatment. The adsorption of TSC500 decreased from 23% to 1% for MO but for MB it increased from 4% to 8%, while the adsorption of TAH500 for MB decreased from 96% to 18%.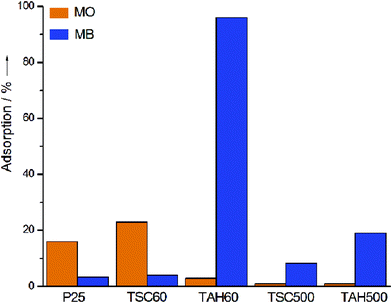 | ||
| Fig. 2 Percentage of MO and MB adsorption by different catalysts. | ||
Selective photocatalysis
Photocatalytic degradation studies were conducted on 50 mL of ≈5 mg L−1 aqueous mixture of MO and MB under UV light irradiation. TSC60 and TAH60 catalysts selectively degraded MO and MB dyes, respectively, from their 5 mg L−1 aqueous mixture under UV light exposure. Fig. 3 shows the decrease in concentration of each dye from the reaction mixture after contact with TSC60 (Fig. 3a & c) and TAH60 (Fig. 3b & d), for 480 min under UV light irradiance. TSC60 degraded MO in the first 120 min, during which time MB remained intact. Afterwards the degradation of MB commenced. The degradation rate of MB was three times slower than MO. Interestingly, these observations were exactly the opposite with TAH60 where it completely degraded MB in the first 60 min and then started to degrade MO, where MB degradation was eight times faster than MO. Under the same experimental conditions neither P25 nor calcined samples, TSC500 and TAH500, showed any significant selectivity for the degradation of MO and MB dyes. With P25 the photocatalytic oxidation reaction of both dyes commenced simultaneously with almost complete degradation achieved within 90 min (Fig. 4a & d). TSC500 (Fig. 4b & e) and TAH500 (Fig. 4c & f) also did not show any significant selectivity toward MO and MB degradation. However, a complete degradation of both dyes was achieved in 270 min compared with 480 min for TSC60 and TAH60.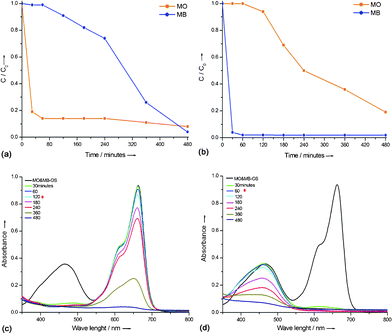 | ||
| Fig. 3 Concentration vs. time plot and corresponding UV-Vis absorbance showing the degradation of MO & MB mixture (5 mg L−1) with TSC60 (a) & (c) and TAH60 (b) & (d). | ||
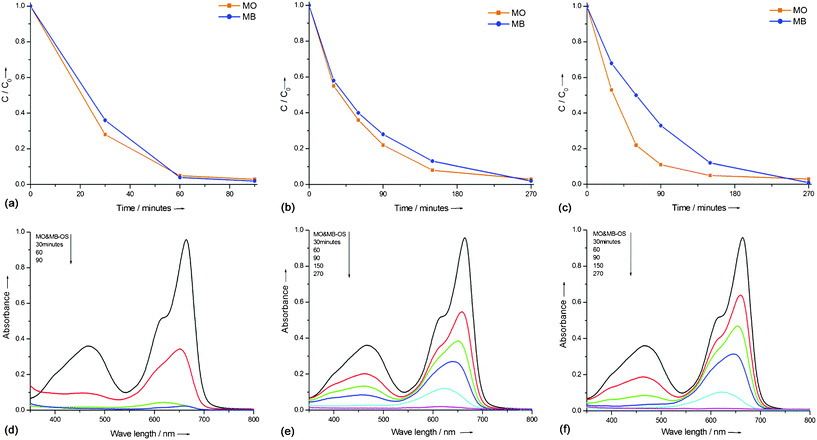 | ||
| Fig. 4 Concentration vs. time plot and the corresponding UV-Vis absorbance results for the degradation of MO & MB dye mixture (5 mg L−1) with P25 (a & d), TSC500 (b & e) and TAH500 (c & f). | ||
Discussion
Origin of surface charge and preferential adsorption of dyes
Incompletely saturated co-ordinances on the outermost atoms cause metal oxides to adsorb ions from the surroundings which contribute to their surface charge37. This depends on the pH and ionic composition of the medium.37,38 In the synthesis of TSC60, extraction of the solid product from the acid stabilized sol with Na2CO3 solution caused the adsorption of H+ ions on the TiO2 surface and hence the resulting catalyst has a positive surface charge. While in the case of TAH60, isolation with NH4OH caused the adsorption of OH− on the catalyst surface resulting in a catalyst with a negative surface charge (Fig. 5). Calcination of TSC60 and TAH60 at 500 °C caused the removal of some of the adsorbed species which in turn reduced the surface charge of the calcined catalysts (Table 1). Refluxing the positively surface charged anatase TiO2 particles with 10 M sodium or potassium hydroxides has resulted in the formation of titanate nanotubes with negative surface charge.30 Calcination of these titanate nanotubes in air at 400 °C caused the loss of –OH groups which in turn resulted in reduced surface charge.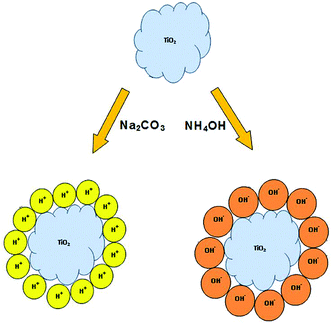 | ||
| Fig. 5 Origin of surface charge on TiO2 catalysts after base precipitation. | ||
Organic dyes are one of the major components in industrial effluent. Selective adsorption of dyes is therefore of prime importance with regard to their recovery or degradation. Recently, researchers have shown27 that exfoliated graphene oxide (EGO) with negative surface charge acts as good adsorbent for cationic dyes including MB. However, reduced graphene oxide (rGO) which does not possess high negative charge has proven as good adsorbent for anionic dyes. Herein, MO, being an anionic dye, gets preferentially adsorbed by TSC60 which has a high positive surface charge leaving MB intact in solution. On the other hand the negative surface charge of TAH60 causes preferential adsorption of the cationic MB from the dye mixture (Fig. S5)†.
Our findings indicate promise in the use of these catalysts in the recovery of dyes from industrial effluent since the attached dye molecules were easily desorbed from TSC60 and TAH60 by extraction with acetone. This also confirms that the nature of adsorption of MO and MB on TSC60 and TAH60 is through electrostatic force of attraction and not by strong chemical bonding, which is in agreement with the findings of Bavykin et al.30 P25 with a positive surface charge also showed preferential adsorption of the anionic MO over the cationic MB dye. Bavykin et al.30 have reported similar type of preferential adsorption of an anionic dye, Eriochrome Black T, over MB with P25. When negatively surface charged titanate nanotubes, derived by NaOH and KOH treatment of P25, were used the preferential adsorption was reversed toward MB. Calcination of these nanotubes caused the loss of –OH groups which resulted in 30% reduction in the MB adsorption capacity. In our study, calcination of the catalyst samples caused the removal of H+ and OH− groups in TSC500 and TAH500, respectively, which resulted in the reduction of their surface charge (Table 1). The decreased surface charge of TSC500 and TAH500 was reflected in their dye adsorption ability (Fig. 2).
Selective adsorption studies of dyes have further implication in improving the efficiency of dye sensitized solar cells (DSSCs). Higher amount of dye adsorbed on TiO2, without dye aggregation, could lead to better performance of the DSSCs. Tailored selection of dyes with higher affinity toward TiO2 could be achieved by understanding their adsorption behaviour.30,32 Selective positioning of dyes, with different absorption wavelengths, on TiO2 surface has been found to increase the efficiency of DSSC. Lee et al.33 have demonstrated the selective positioning of three organic dyes N719, N749 and P5 on TiO2 surface by mimicking the stationary-mobile phase concept of column chromatography.
Herein, we propose a simple method (Fig. 6) for the selective positioning of anionic dye (MO) and cationic dye (MB) using TSC60 and TAH60 for use in DSSCs. By coating TSC60 and TAH60, one after the other, on FTO/ITO glass substrate as shown in Fig. 6b and dipping the coated substrates in dye solutions, selective positioning of MO and MB will result. High temperature treatment of TiO2 is a common practice in the fabrication of DSSCs. But this could cause the loss of surface charge and significant drop in surface area thus decreasing the dye adsorption on TiO2. In our approach, however, this can be avoided since our low-temperature derived TiO2 has comparable crystallinity so that they can act as good electron transport medium. It has also been proven as good candidate in photocatalytic degradation reactions.39
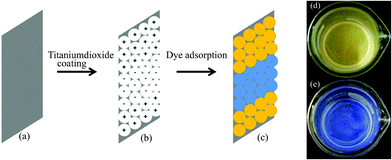 | ||
| Fig. 6 Proposed process for the selective positioning of dyes. (a) FTO/ITO glass, (b) FTO/ITO glass coated with TSC60 and TAH60 and (c) TSC60 and TAH60 coated substrates after dipping in dye solution (Orange: MO and blue: MB). (d) And (e) are images of TSC60 and TAH60 after adsorption of MO and MB dyes, respectively. | ||
Selective photocatalysis of dyes
The most exciting observation in our study is the complete and totally opposite selectivity exhibited by TSC60 and TAH60 (Fig. 3) toward the photocatalytic degradation of MO and MB dyes. Researchers have reported on preferential degradation of MO and MB by nanocrystalline TiO2.31 However, to the best of our knowledge this is the first report of complete selectivity achieved by nanocrystalline TiO2 in the degradation of MO and MB from their aqueous mixture. The selectivity shown by TSC60 and TAH60 toward the degradation of MO and MB, respectively, was quite interesting especially because both TSC60 and TAH60 showed identical properties, such as crystalline phase, size, morphology, pore diameter, and pore size distribution except that TAH60 has slightly higher surface area than TSC60. ζ –potential analysis revealed that TSC60 has a positive surface charge while TAH60 has a negative surface charge (Table 1) which led to the preferential adsorption of MO on TSC60 and MB on TAH60 (Fig. 2). Thus, the adsorbed MO gets selectively degraded by TSC60 (Fig. 3a & c) and MB by TAH60 (Fig. 3b & d) from the dye mixture solution. It has been reported that the replacement of surface-bonded fluorides in TiO2 microspheres by hydroxyl groups through washing with NaOH, accelerated the rate of degradation of MB over MO. The observed selectivity was explained by preferential adsorption of MB on the hydroxyl surface-modified catalyst.31We believe that the preferential adsorption of MO and MB by TSC60 and TAH60 is not the only reason for their selective degradation. If that was the case, P25 would have also shown selectivity towards MO over MB in their photocatalytic oxidation reaction since ζ –potential analysis showed that P25 has a positive surface charge (Table 1) and the adsorption studies confirmed preferential adsorption of MO over MB by P25 (Fig. 2). However, it is clear from Fig. 4a & d, that the rate of degradation of MO and MB over P25 was almost identical where the reaction was completed in 90 min. Liu et al.31 have reported favored decomposition of MO over MB by P25 as attributed to the less abundance of {001} facets in P25. However we could not observe any significant selectivity by P25 in the degradation of MO and MB. Degussa P25 is the bench mark TiO2 photocatalyst due to its unique ability to destroy wide range of pollutants with great pace.1 Its high reactivity arises from its unique material properties, particularly its high crystallinity, which might be the reason why it did not show any selectivity in the degradation of MO and MB. This is further confirmed by the total time (90 min) taken by P25 to complete the degradation of MO and MB compared to 480 min for TSC60 and TAH60. This demonstrates that not only the surface charge of TSC60 and TAH60 but also their controlled reactivity that make them selective photocatalysts.
When the calcined samples TSC500 and TAH500 were tested for their photocatalytic dye degradation, they did not show any significant selectivity either as shown in Fig. 4b & c. Calcination of TSC60 and TAH60 caused the loss of H+ and OH− ions, respectively, thereby decreasing the surface charge of TSC500 and TAH500 as revealed by the ζ –potential analysis (Table 1). This in turn decreased their preferential adsorption capacity (Fig. 2). In addition, calcination caused an increase in crystallinity which is evident from the high intense diffraction patterns of TSC500 and TAH500 in comparison with TSC60 and TAH60 (Fig. 1). It has been reported that highly crystalline TiO2 is superior for photocatalytic applications than the less crystalline or amorphous samples.40 The combined effect of decreased surface charge and increased crystallinity of TSC500 and TAH500 could be responsible for the loss of selectivity.
Conclusions
To summarize, we demonstrated a relatively simple way to synthesize TiO2 photocatalysts with desired surface charge and controlled reactivity. These catalysts showed preferential adsorption and fully selective degradation of cationic (MB) and anionic (MO) dyes. The observed selectivity for the dye adsorption by TSC60 and TAH60 could have wide implications in 1) the recovery or destruction of precious dyes or harmful pollutants, respectively, from a mixture of their counterparts and 2) the tailored adsorption and selective positioning of sensitizers on TiO2 for the fabrication of more efficient DSSCs.Acknowledgements
This work was financially supported by MRGS and School of Applied Sciences and Engineering, Monash University. The authors are grateful to Dr W. S. Tung, J. K. Tadvani, Dr M. Danquah, C. Ongkudon, Dr V. Verheyen and A. Cruickshank for their experimental assistance and Monash Electron Microscopy Centre, for providing their technical support.References
- A. Mills, R. H. Davies and D. Worsley, Chem. Soc. Rev., 1993, 22, 417–425 RSC.
- T. Karpova, S. Preis, J. Kallas and A. L. B. Torres, Environ. Chem. Lett., 2007, 5, 219–224 CrossRef CAS.
- D. Robert, A. Piscopo and J. V. Weber, Environ. Chem. Lett., 2004, 2, 5–8 CrossRef CAS.
- D. Robert, A. Piscopo and J. V. Weber, Sol. Energy, 2004, 77, 553–558 CrossRef CAS.
- Y. Shiraishi, Y. Sugano, D. Inoue and T. Hirai, J. Catal., 2009, 264, 175–182 CrossRef CAS.
- J. T. Carneiro, A. R. Almeida, J. A. Moulijn and G. Mul, Phys. Chem. Chem. Phys., 2010, 12, 2744–2750 RSC.
- S. Ghosh-Mukerji, H. Haick, M. Schvartzman and Y. Paz, J. Am. Chem. Soc., 2001, 123, 10776–10777 CrossRef CAS.
- Y. Ide, Y. Nakasato and M. Ogawa, J. Am. Chem. Soc., 2010, 132, 3601–3604 CrossRef CAS.
- F. Xamena, P. Calza, C. Lamberti, C. Prestipino, A. Damin, S. Bordiga, E. Pelizzetti and A. Zecchina, J. Am. Chem. Soc., 2003, 125, 2264–2271 CrossRef.
- X. T. Shen, L. H. Zhu, J. Li and H. Q. Tang, Chem. Commun., 2007, 1163–1165 RSC.
- X. T. Shen, L. H. Zhu, G. X. Liu, H. W. Yu and H. Q. Tang, Environ. Sci. Technol., 2008, 42, 1687–1692 CrossRef CAS.
- X. T. Shen, L. H. Zhu, C. X. Huang, H. Q. Tang, Z. W. Yu and F. Deng, J. Mater. Chem., 2009, 19, 4843–4851 RSC.
- X. T. Shen, L. H. Zhu, H. W. Yu, H. Q. Tang, S. S. Liu and W. Y. Li, New J. Chem., 2009, 33, 1673–1679 RSC.
- D. Sharabi and Y. Paz, Appl. Catal., B, 2010, 95, 169–178 CrossRef CAS.
- K. Inumaru, M. Murashima, T. Kasahara and S. Yamanaka, Appl. Catal., B, 2004, 52, 275–280 CrossRef CAS.
- D. Cropek, P. A. Kemme, O. V. Makarova, L. X. Chen and T. Rajh, J. Phys. Chem. C, 2008, 112, 8311–8318 CAS.
- A. R. Almeida, J. T. Carneiro, J. A. Moulijn and G. Mul, J. Catal., 2010, 273, 116–124 CrossRef CAS.
- K. J. Nakamura, Y. Ide and M. Ogawa, Mater. Lett., 2011, 65, 24–26 CrossRef CAS.
- K. Inumaru, T. Kasahara, M. Yasui and S. Yamanaka, Chem. Commun., 2005, 2131–2133 RSC.
- J. Matos, A. Garcia, T. Cordero, J. M. Chovelon and C. Ferronato, Catal. Lett., 2009, 130, 568–574 CrossRef CAS.
- S. Yurdakal, G. Palmisano, V. Loddo, V. Augugliaro and L. Palmisano, J. Am. Chem. Soc., 2008, 130, 1568–1569 CrossRef CAS.
- P. Calza, C. Paze, E. Pelizzetti and A. Zecchina, Chem. Commun., 2001, 2130–2131 RSC.
- Y. Shiraishi, N. Saito and T. Hirai, J. Am. Chem. Soc., 2005, 127, 12820–12822 CrossRef CAS.
- P. Roy, T. Dey, K. Lee, D. Kim, B. Fabry and P. Schmuki, J. Am. Chem. Soc., 2010, 132, 7893–7895 CrossRef CAS.
- N. K. Shrestha, J. M. Macak, F. Schmidt-Stein, R. Hahn, C. T. Mierke, B. Fabry and P. Schmuki, Angew. Chem., Int. Ed., 2009, 48, 969–972 CrossRef CAS.
- E. Forgacs, T. Cserhati and G. Oros, Environ. Int., 2004, 30, 953–971 CrossRef CAS.
- G. K. Ramesha, A. V. Kumara, H. B. Muralidhara and S. Sampath, J. Colloid Interface Sci., 2011, 361, 270–277 CrossRef CAS.
- M. S. Sajab, C. H. Chia, S. Zakaria, S. M. Jani, M. K. Ayob, K. L. Chee, P. S. Khiew and W. S. Chiu, Bioresour. Technol., 2011, 102, 7237–7243 CrossRef CAS.
- X. L. Han, W. Wang and X. J. Ma, Chem. Eng. J., 2011, 171, 1–8 CrossRef CAS.
- D. V. Bavykin, K. E. Redmond, B. P. Nias, A. N. Kulak and F. C. Walsh, Aust. J. Chem., 2010, 63, 270–275 CrossRef CAS.
- S. Liu, J. Yu and M. Jaroniec, J. Am. Chem. Soc., 2010, 132, 11914–11916 CrossRef CAS.
- S. Uchida, R. Chiba, M. Tomiha, N. Masaki and M. Shirai, Electrochemistry, 2002, 70, 418–420 CAS.
- K. Lee, S. W. Park, M. J. Ko, K. Kim and N. G. Park, Nat. Mater., 2009, 8, 665–671 CrossRef CAS.
- W. S. Tung and W. A. Daoud, Acta Biomater., 2009, 5, 50–56 CrossRef CAS.
- J. G. Yu, J. C. Yu, M. K. P. Leung, W. K. Ho, B. Cheng, X. J. Zhao and J. C. Zhao, J. Catal., 2003, 217, 69 CAS.
- K. S. W. Sing, D. H. Everett, R. A. W. Haul, L. Moscou, R. A. Pierotti, J. Rouquerol and T. Siemieniewska, Pure Appl. Chem., 1985, 57, 603 CrossRef CAS.
- F. Thomas, B. Prelot, F. Villieras and J. M. Cases, C. R. Geosci., 2002, 334, 633–648 CrossRef CAS.
- G. A. Parks, Adv. Chem. Series, 1967, 97, 121–160 CrossRef.
- W. S. Tung and W. A. Daoud, J. Mater. Chem., 2011, 21, 7858–7869 RSC.
- B. Ohtani, Y. Ogawa and S. Nishimoto, J. Phys. Chem. B, 1997, 101, 3746–3752 CrossRef CAS.
Footnote |
| † Electronic supplementary information (ESI) available. See DOI: 10.1039/c1ra00539a |
| This journal is © The Royal Society of Chemistry 2012 |
