Template preparation of NiPS3 polymer nanocomposites
Amila Udayanga
Liyanage
and
Michael M.
Lerner
*
Department of Chemistry, Oregon State University, Corvallis, OR 97331-4003, United States. E-mail: michael.lerner@oregonstate.edu; Fax: (+1)-541-737-2062; Tel: (+1)-541-737-6747
First published on 9th November 2011
Abstract
A template synthesis method can be used to prepare NiPS3 nanocomposites with polyethylene oxide (PEO), polyethylenimine (PEI), polyvinyl alcohol (PVA) and polyvinylpyrrolidone (PVP). Nanocomposites of NiPS3/PEI, NiPS3/PVA and NiPS3/PVP have not been previously reported. The resulting materials are characterized by powder X-ray diffraction (PXRD), thermogravimetric analysis (TGA), scanning electron microscope (SEM) and energy-dispersive X-ray spectroscopy (EDS). Reaction progress was monitored using UV-visible spectroscopy. Template synthesized NiPS3/PEO nanocomposites show only polymer zig-zag monolayers, in contrast to the bilayers obtained using the topotactic method, and can generate denser interlayers than those obtained by topotactic methods. The crystallite sizes increase for more dilute conditions, a more polar solvent, and longer aging time. P2S64− and Ni2+ concentrations govern nanocomposite nucleation and growth, respectively.
Introduction
MPS3 and materials containing MPS3 layers show interesting properties for nonlinear optics,1,2 magnetic3,4 or photomagnetic devices,5 catalysis,6 and energy storage in secondary batteries.7 For the latter example, NiPS3 shows an electrochemical reduction that proceeds in several stages at potentials from 2.7 to 1.8 V up to a Li/Ni ratio of ∼7.5. The reduction occurs quasi-reversibly over the range 0 ≤ Li/Ni ≤ 3 range, providing a high theoretical capacity as a secondary cathode.7Xiao et al. reported that MoS2 shows a significantly higher reversible capacity after an exfoliation process. Furthermore, the formation of a nanocomposite with polyethylene oxide (PEO) allows both higher capacities and improved charge/discharge cycling.8 Since MS2 and MPS3 are both layered materials with intercalation chemistries, the preparation and electrochemical characterization of PEO/NiPS3 nanocomposites are therefore of interest.
The synthesis and structures of MPS3 nanocomposites with different polymers has been studied by several groups. In all cases, a topotactic method has been employed, starting with a compound containing alkali metal cations between MPS3 layers. This intercalation compound may be obtained directly at high temperature,9 or by introduction of alkali metal cations into the MPS3 hostvia ion exchange10 or reduction of the M(II) cations in the host layers.6 The alkali metal cations likely enable nanocomposite formation by coordinating to polymer functional groups, as has been observed with many other layered hosts.11
Lagadic et al. first reported the synthesis of nanocomposites of PEO and MPS3 (M = Mn, Cd) by reacting an aqueous polymer solution with M1-xPS3A2x(H2O)y (A = Na, K). The products obtained showed gallery expansions of ≈0.8–0.9 nm, consistent with the intercalation of bilayers of zig-zag-like PEO chains that coordinate to alkali metal ions.10 Jeevanandam et al. subsequently prepared PEO/CdPS3 nanocomposites in a methanolic solution at 55 °C.12 Manriquez et al. reported the preparation of PEO nanocomposites from LixMPS3 (M = Ni, Fe) using a similar approach. However, in this case the authors proposed a polymer helical conformation.9
Manova et al. reported the intercalation of polyethylene glycol into a NaxNiPS3 by reaction in a methanolic aqueous solution, with a gallery expansion of ≈0.8 nm.6
Other polymers that are known to form nanocomposites with MPS3 layers include linear polyethylenimine, LPEI, and polyvinylpyrrolidone, PVP. The former was reported by Oriakhi et al. to form nanocomposites with polymer monolayers (expansion of 0.4 nm) via the reaction of Kx(H2O)yM1-x/2PS3 (M = Mn, Cd) and polymer in aqueous solution;13 the latter was reported by Yang et al. via reaction of a potassium intercalated intermediate MPS3 (M = Mn, Cd) and an aqueous PVP solution. The interlayer expansion in that case was ≈2.3 nm, much greater than that for PEO.14
A solvent-free, melt intercalation approach to obtain PEO/MPS3 nanocomposites (M = Mn, Cd) was reported by Sukpirom et al. With this method, KxM1-x/2PS3·δH2O was shown to directly intercalate PEO at 125 °C. The nanocomposite basal repeat distances were increased by ≈0.8 nm, again ascribed to the presence of PEO bilayers.15
MPS3 compounds are normally prepared by combining the elements or simple precursors at elevated temperature.16,17 However, the synthesis of highly disordered or amorphous NiPS3 at ambient temperature has been reported by reaction of Ni2+ salts with alkali metal hexathiohypodiphosphate (Na4P2S6·6H2O or Li4P2S6·6H2O) in aqueous solution.18–20 In the following study, we describe the first template approach to MPS3 compounds, where layered nanocomposites are obtained directly using a one-pot reaction with solution-phase precursors at ambient temperature.
Experimental
Reagents and analytical methods
Li2S (99.9%, Cerac), P (99%, Johnson Matthey), S (99.9%, Mallinckrodt), Ni(NO3)2·6H2O (Aldrich), PEO (Aldrich, Mw = 100,000), linear polyethylenimine (Alfa Aeser, Mw = 25,000), polyvinyl alcohol, 80% hydrolyzed (Aldrich, Mw = 9–10,000) and polyvinylpyrrolidone (Alfa Aeser, Mw = 8,000) were purchased and used without further purification.Powder XRD (PXRD) patterns from 3–60° 2θ were obtained on a Rigaku Miniflex II diffractometer, using Ni–filtered Cu-Kα radiation at a scan rate of 3° min−1 and step size of 0.020° 2θ. A modified Scherrer equation21 was used to determine crystallite size (L) for the prepared nanocomposites:
 | (1) |
where λ = 0.15406 nm, Δ(2θhkl) = full width at half maximum (in radians) and θhkl = diffraction angle. A Si(m) powder standard was employed for these measurements. Thermogravimetric (TGA) analyses were performed under Ar flow (20 mL min−1) using a Shimadzu TGA-50 analyzer, from ambient to 500 °C at 5 °C min−1. An Agilent 8453 UV-visible spectrophotometer was used for UV analyses. Background subtractions were carried out for all the UV-visible measurements. Scanning electron micrographs (SEMs) were obtained using an FEI Quanta 600F FEG SEM. Energy-dispersive X-ray spectroscopy (EDS) was used as a semi-quantitative elemental analysis method.
Van der Waals volumes of C2H4O oligomers (C = 2–40) were calculated based on Bondi radii using a method termed Atomic and Bond Contributions of van der Waals volume (VABC).22
Syntheses
Li4P2S6 was synthesized as a white powder according to a published procedure.23 Li2S, P and S were combined in 1![[thin space (1/6-em)]](https://www.rsc.org/images/entities/char_2009.gif) :
:![[thin space (1/6-em)]](https://www.rsc.org/images/entities/char_2009.gif) 1
1![[thin space (1/6-em)]](https://www.rsc.org/images/entities/char_2009.gif) :
:![[thin space (1/6-em)]](https://www.rsc.org/images/entities/char_2009.gif) 2 mole ratio and sealed in a quartz tube under an inert atmosphere. The mixture was heated to 900 °C at 100 °C h−1, maintained at 900 °C for 0.5 h, rapidly cooled to 450 °C and held at 450 °C for 24 h. Highly disordered or amorphous NiPS3 was synthesized via a process previously reported by Prouzet et al.19 An aqueous solution of Ni(NO3)2·6H2O (0.31 g, 5.00 mL) was added dropwise to an aqueous solution of Li4P2S6 (0.10 g, 5.00 mL) and stirred vigorously for 24 h. The reddish precipitate was centrifuged for 15 min, triple washed with deionized (DI) water, and then dried under vacuum at room temperature.
2 mole ratio and sealed in a quartz tube under an inert atmosphere. The mixture was heated to 900 °C at 100 °C h−1, maintained at 900 °C for 0.5 h, rapidly cooled to 450 °C and held at 450 °C for 24 h. Highly disordered or amorphous NiPS3 was synthesized via a process previously reported by Prouzet et al.19 An aqueous solution of Ni(NO3)2·6H2O (0.31 g, 5.00 mL) was added dropwise to an aqueous solution of Li4P2S6 (0.10 g, 5.00 mL) and stirred vigorously for 24 h. The reddish precipitate was centrifuged for 15 min, triple washed with deionized (DI) water, and then dried under vacuum at room temperature.
To prepare the nanocomposites, Ni(NO3)2·6H2O (0.31 g) and PEO (0.01–0.05 g) were dissolved in 5–500 mL of DI water and then slowly added to a solution Li4P2S6 (0.1 g) dissolved in DI water (5.00–500.0 mL) and stirred vigorously for 24 h. Depending on the solvent volume, the precipitation time varied from few minutes to 12 days. After aging (1–7 days) the resulting brown precipitate was centrifuged for 15 min and washed three times with a copious amount of DI water. The solid product was dried under vacuum at 60 °C for 18 h. Where noted, some reactions substituted water with 10% ethanol as the solvent.
Samples are identified below based on starting g/g PEO/Li4P2S6 ratio (R) and total solvent volume (V). For example, the product of Ni(NO3)2·6H2O (0.31 g) and PEO (0.05 g) dissolved in 5 mL of DI water with 5 mL of aqueous Li4P2S6 (0.1 g) solution is labeled R0.5V10.
The same procedures were used to synthesize other polymer/NiPS3 nanocomposites with linear polyethylenimine (LPEI), polyvinyl alcohol (PVA) and polyvinylpyrrolidone (PVP).
Results and discussion
PXRD patterns (Fig. 1) show that polymer nanocomposite structures are obtained by the template method. The basal repeat distance increases from 0.64 nm in a-NiPS3 to 1.06 nm for all the PEO nanocomposites. This expansion of 0.42 nm along the stacking direction indicates the presence of PEO monolayers incorporated between NiPS3 layers.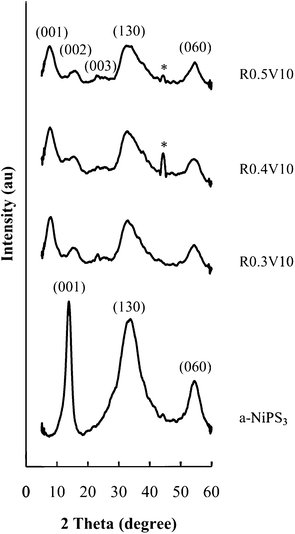 | ||
| Fig. 1 PXRD patterns for PEO/NiPS3 nanocomposites obtained by the template method. a-NiPS3 obtained by the same approach without PEO is shown for comparison. (*Al holder). | ||
Fig. 2 shows a typical microstructure of the prepared PEO/NiPS3 nanocomposites, in this case for sample R0.5V10. The nanocomposites show an expanded layered morphology with most particle dimensions above 10 μm. For samples with R = 0.5, i.e. with a high polymer content, SEM images also reveal the presence of surface adsorbed polymer and show charging effects during imaging, indicating the presence of non-conducting polymer on surfaces. TGA data (see below) support the presence of surface-adsorbed PEO.
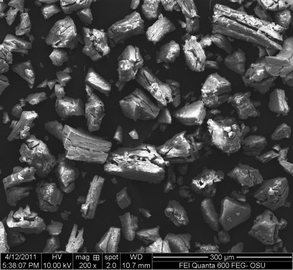 | ||
| Fig. 2 SEM image for a PEO/NiPS3 nanocomposite (sample R0.5V10). | ||
EDS data indicates the presence of Ni, P, S, C and O in the nanocomposite samples with an Ni![[thin space (1/6-em)]](https://www.rsc.org/images/entities/char_2009.gif) :
:![[thin space (1/6-em)]](https://www.rsc.org/images/entities/char_2009.gif) P
P![[thin space (1/6-em)]](https://www.rsc.org/images/entities/char_2009.gif)
![[thin space (1/6-em)]](https://www.rsc.org/images/entities/char_2009.gif) :
:![[thin space (1/6-em)]](https://www.rsc.org/images/entities/char_2009.gif) S ratio of 1
S ratio of 1![[thin space (1/6-em)]](https://www.rsc.org/images/entities/char_2009.gif) :
:![[thin space (1/6-em)]](https://www.rsc.org/images/entities/char_2009.gif) 1
1![[thin space (1/6-em)]](https://www.rsc.org/images/entities/char_2009.gif) :
:![[thin space (1/6-em)]](https://www.rsc.org/images/entities/char_2009.gif) 2.7. This supports the formation of host NiPS3 structure from the precursors. Some sample degradation during analysis may account for the less than nominal sulfur content.
2.7. This supports the formation of host NiPS3 structure from the precursors. Some sample degradation during analysis may account for the less than nominal sulfur content.
Fig. 3 shows thermal analysis data of the obtained products. The DTG loss peak at 100–150 °C is ascribed to volatilization of intercalated water, and the loss peak around 250 °C to PEO decomposition and volatilization. From the mass losses, the relative contents of these components can be determined. For the R0.5V10 sample, some new features are observed. The water loss region occurs over a broad range starting at lower temperature, a shoulder appears on the low temperature side of the main PEO loss peak, and a high temperature loss is observed at 350 °C. The low temperature shoulder on the main PEO loss peak, and the high temperature loss, are ascribed to the presence of surface-adsorbed or bulk PEO. The separation of thermal loss events allows quantification of PEO intercalate vs. surface PEO. Water content was close to 1 mol/formula unit of NiPS3, but this composition was highly dependent on sample history and environmental conditions (humidity and temperature).
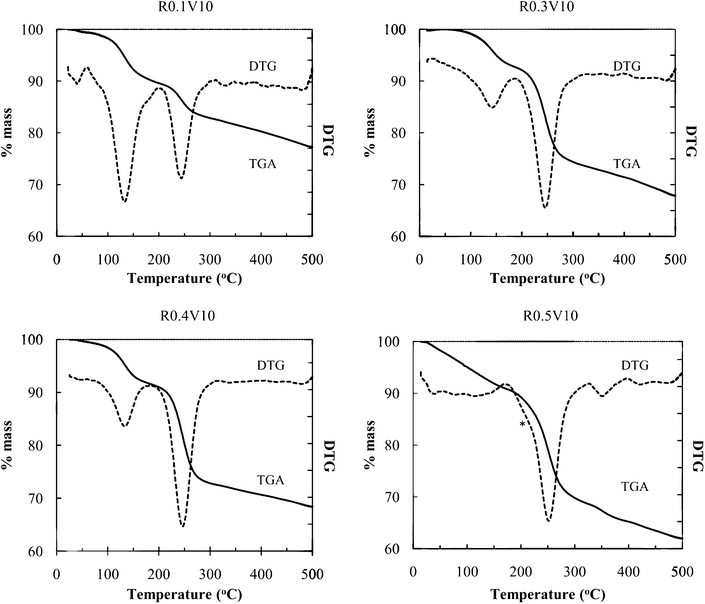 | ||
| Fig. 3 TGA of nanocomposites with different PEO compositions (* loss shoulder ascribed to surface PEO) DTG indicates the first derivative of TGA curves. | ||
The packing fractions, i.e. fraction of volume in the expanded galleries occupied by intercalates, were derived from the known hostMPS3 cell dimensions, the gallery expansion determined by PXRD, the product stoichiometries and intercalate volumes. The PEO monomer unit volume was estimated by calculating the C2H4O monomer unit volume for increasing oligomer sizes until a stable volume of 0.050 nm3 was observed. (Fig. 4) As an example, for sample R0.1V10, the packing fraction, was calculated as:
| Packing fraction = [(Z * 0.34 * 0.050 nm3)/(a * b * Δd)] = 0.28 | (2) |
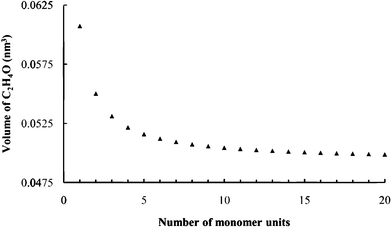 | ||
| Fig. 4 Calculated C2H4O unit volumes from VABC. | ||
where a = 0.5812 nm and b = 1.0070 nm are NiPS3 unit cell parameters,16 Δd = gallery expansion = 0.42 nm, and Z = NiPS3 units per unit cell = 4. Water content was highly variable, as noted above, and may be on particle surfaces or intercalated, and thus was not considered in these packing fractions. The calculated PEO packing fractions are shown in Table 1. Intercalate PEO content and packing fractions increase with higher PEO/Li4P2S6 up to R = 0.3. At higher ratios, the additional PEO does not intercalate, although some remains as surface-adsorbed polymer.
| Sample | Reacted (PEO)/NiPS3 (mol/mol) | Product (PEO)/NiPS3 (mol/mol) | H2O/NiPS3 (mol/mol) | Packing fraction | ||
|---|---|---|---|---|---|---|
| Total | Intercalated | Surface | ||||
| R0.1V10 | 0.34 | 0.34 | 0.34 | — | 1.29 | 0.28 |
| R0.2V10 | 0.68 | 0.69 | 0.69 | — | 1.21 | 0.56 |
| R0.3V10 | 1.01 | 1.02 | 1.02 | — | 1.01 | 0.83 |
| R0.4V10 | 1.35 | 1.03 | 1.03 | — | 1.17 | 0.84 |
| R0.5V10 | 1.69 | 1.30 | 1.01 | 0.29 | 1.34 | 0.82 |
As determined from diffraction peak widths, crystallite sizes for the nanocomposites, which are the products of 0.3 g/g PEO/Li4P2S6 reaction mixtures, increases from 2.6 nm to 4.2 nm upon a 20-fold decrease in the reaction concentrations as shown in Table 2. A further dilution of 5 × results in a crystallite size increase to 4.5 nm. Aggregation times were also greatly increased in the more dilute solutions.
The use of an ethanolic solvent also decreases the aggregation time with respect to the aqueous reaction mixtures, and results in a smaller crystallite size. For an R0.3V1000 sample prepared using 10% ethanol, the crystallite size decreased from 4.5 nm (in DI water) to 4.2 nm. Crystallite size increased from 4.5 to 5.2 when the aging time was increased from 1 to 7 days, suggesting that exchange between solution and precipitate continues after aggregate formation.
Nanocomposites of PEI/NiPS3, PVA/NiPS3 and PVP/NiPS3 have not been previously reported, but can be prepared by this template method. Table 3 shows the structural and compositional data for these new nanocomposites, obtained as for PEO/NiPS3.
| Nanocomposite | d (nm) | Δd (nm) | Polymer/ NiPS3 ratio (mol/mol) |
|---|---|---|---|
| PEO/NiPS3 | 1.06 | 0.42 | 1.0 |
| PEI/NiPS3 | 1.05 | 0.41 | 1.0 |
| PVA/NiPS3 | 1.06 | 0.42 | 0.9 |
| PVP/NiPS3 | 2.20 | 1.56 | 0.5 |
In previous reports, PEO/MPS3 (M = Mn, Cd) nanocomposites have shown interlayer expansions of 0.8–0.9 nm, corresponding to the presence of PEO bilayers between host sheets. For these nanocomposites the polymer/MPS3 ratio is 1.9–2.1 which supports the zig-zag bilayer arrangement.10 Alternately, Manriquez et al. describe a single helical PEO arrangement in MPS3 nanocomposites (M = Ni, Fe) with an interlayer expansion of ≈0.8 nm.9 All these compounds were synthesized using a topotactic method. The current template method results in only single PEO zig-zag polymer layers. However, these layers are more densely packed, as is indicated by the derived packing fractions shown in Table 4. Topotactic methods are kinetically limited by the slow diffusion of polymers,24 which may impede development of densely packed intercalate layers. With a template method, denser polymer layers can form before the host layer structure fully develops.
| Nanocomposite | Method of synthesis | Alkali ion | Packing fraction | Reference |
|---|---|---|---|---|
| PEO/NiPS3 | Topotactic | Li+ | 0.27 | 9 |
| PEO/FePS3 | Topotactic | Li+ | 0.40 | 9 |
| PEO/CdPS3 | Topotactic | Li+, Na+ | 0.58,0.72 | 12 |
| PEO/CdPS3 | Topotactic | Cs+, K+ | 0.62,0.69 | 12 |
| PEO/CdPS3 | Topotactic | K+ | 0.61 | 10 |
| PEO/MnPS3 | Topotactic | Na+, K+ | 0.73,0.77 | 10 |
| PEO/NiPS3 | Template | Li+ | 0.84 | this work |
The PEI/NiPS3 nanocomposites obtained show a similar interlayer expansion to that from the topotactic preparation (0.41 nm vs. 0.4 nm for PEI/MPS3 (M = Mn, Cd) reported by Oriakhi et al.),13 corresponding to a PEI monolayer. PVA/NiPS3 shows a similar interlayer expansion of 0.42 nm. The template synthesis of PVP/NiPS3 gives a much smaller expansion of 1.46 nm than for the topotactic method.14
In order to evaluate the growth mechanism for these template reactions, the evolution of UV-visible absorption spectra were recorded under different reaction conditions. As shown in Fig. 5, a new absorbance at 330 nm indicates the formation of the nanocomposite. This absorbance can be ascribed to Ni coordination by sulfide in P2S64− (Ni–dithiolene complexes show a prominent absorbance in this region).25,26
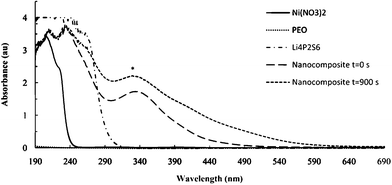 | ||
| Fig. 5 UV-visible spectra of some reactants and products of the template reactions. The absorbance at 330 nm (*) is used to monitor nanocomposite formation. | ||
In the first set of experiments, the concentrations of Ni2+ and PEO were varied while maintaining a constant P2S64− concentration and a constant Ni2+/PEO ratio of 1![[thin space (1/6-em)]](https://www.rsc.org/images/entities/char_2009.gif) :
:![[thin space (1/6-em)]](https://www.rsc.org/images/entities/char_2009.gif) 1. The initial absorbances at 330 nm under these conditions remain unchanged (Fig. 6, compare the y-intercept of the three plots), indicating that nanocomposite nucleation is independent of PEO and Ni2+ concentration. These initial values are all obtained within 15 s of solution mixing.
1. The initial absorbances at 330 nm under these conditions remain unchanged (Fig. 6, compare the y-intercept of the three plots), indicating that nanocomposite nucleation is independent of PEO and Ni2+ concentration. These initial values are all obtained within 15 s of solution mixing.
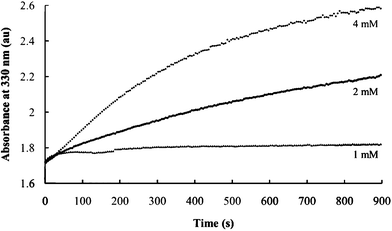 | ||
| Fig. 6 Effect of Ni2+ and PEO concentrations on the rate of nanocomposite formation. Curves are obtained using the indicated Ni2+ concentrations. | ||
The growth in the absorbance peak (from about 1.75 to 2.25 (Fig. 6, curve for 2 mM), indicates that the rate of nucleation (as indicated by the initial values) are significantly greater than the rate of nanocomposite growth. The growth rate, however, is strongly dependent on Ni2+ concentration.
In contrast, the initial absorbances vary significantly for reactions using three different concentrations of P2S64− with a constant Ni2+ and PEO concentrations and Ni2+/PEO = 1. (Fig. 7) This confirms the role of P2S64− in nucleation. The growth curves are parallel under these conditions, indicating that nanocomposite growth is not significantly affected by P2S64− concentration in this range.
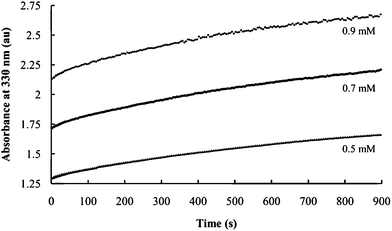 | ||
| Fig. 7 Effect of P4S64− concentration on the rate of nanocomposite formation. Curves are obtained using the indicated P4S64− concentrations. | ||
Conclusions
A template synthesis method can be used to synthesize NiPS3 nanocomposites. The obtained NiPS3/PEO nanocomposites show polymer zig-zag monolayers at all combination ratios, in contrast to PEO nanocomposites derived from a topotactic method, and the packing fractions are greater. The product crystallite size increases with higher solvent volume, use of polar solvent and higher aging time. P2S64− and Ni2+ concentrations govern nanocomposite nucleation and growth, respectively. Nanocomposites of NiPS3/PEI, NiPS3/PVA and NiPS3/PVP are reported for the first time using this template method.References
- T. Coradin, R. Clement, P. G. Lacroix and K. Nakatani, Chem. Mater., 1996, 8, 2153 CrossRef CAS.
- I. Lagadic, P. G. Lacroix and R. Clement, Chem. Mater., 1997, 9, 2004 CrossRef CAS.
- X. Chen, Z. Li, H. Zhou, T. Wang, J. Qin and M. Inokuchi, Polymer, 2007, 48, 3256 CrossRef CAS.
- R. Clement, J. J. Girerd and I. Morgensternbadarau, Inorg. Chem., 1980, 19, 2852 CrossRef CAS.
- S. Benard, A. Leaustic, E. Riviere, P. Yu and R. Clement, Chem. Mater., 2001, 13, 3709 CrossRef CAS.
- E. Manova, C. Severac, A. Andreev and R. Clement, J. Catal., 1997, 169, 503 CrossRef CAS.
- Y. V. Kuzminskii, B. M. Voronin, I. M. Petrushina, N. N. Redin and G. P. Prikhodko, J. Power Sources, 1995, 55, 1 CrossRef CAS.
- J. Xiao, D. Choi, L. Cosimbescu, P. Koech, J. Liu and J. P. Lemmon, Chem. Mater., 2010, 22, 4522 CrossRef CAS.
- V. Manriquez, P. Barahona, D. Ruiz and R. E. Avila, Mater. Res. Bull., 2005, 40, 475 CrossRef CAS.
- I. Lagadic, A. Leaustic and R. Clement, J. Chem. Soc., Chem. Commun., 1992, 1396 RSC.
- M. M. Lerner and C. O. Oriakhi, Handbook of Nanophase Materials, ed. A. N. Goldstein, Dekker, New York, N.Y, 1997, 199–219 Search PubMed.
- P. Jeevanandam and S. Vasudevan, Chem. Mater., 1998, 10, 1276 CrossRef CAS.
- C. O. Oriakhi, R. L. Nafshun and M. M. Lerner, Mater. Res. Bull., 1996, 31, 1513 CrossRef CAS.
- D. Yang and R. F. Frindt, J. Mater. Res., 2000, 15, 2408 CrossRef CAS.
- N. Sukpirom, C. O. Oriakhi and M. M. Lerner, Mater. Res. Bull., 2000, 35, 325 CrossRef CAS.
- G. Ouvrard, R. Brec and J. Rouxel, Mater. Res. Bull., 1985, 20, 1181 CrossRef CAS.
- R. Brec, Solid State Ionics, 1986, 22, 3 CrossRef CAS.
- P. J. S. Foot and B. A. Nevett, J. Chem. Soc., Chem. Commun., 1987, 380 RSC.
- E. Prouzet, G. Ouvrard, R. Brec and P. Seguineau, Solid State Ionics, 1988, 31, 79 CrossRef CAS.
- H. Loboue, C. Guillot-Deudon, A. F. Popa, A. Lafond, B. Rebours, C. Pichon, T. Cseri, G. Berhault and C. Geantet, Catal. Today, 2008, 130, 63 CrossRef CAS.
- P. Fragnaud, E. Prouzet and R. Brec, J. Mater. Res., 1992, 7, 1839 CrossRef CAS.
- Y. H. Zhao, M. H. Abraham and A. M. Zissimos, J. Org. Chem., 2003, 68, 7368 CrossRef CAS.
- R. Mercier, J. P. Malugani, B. Fahys, J. Douglade and G. Robert, J. Solid State Chem., 1982, 43, 151 CrossRef CAS.
- C. O. Oriakhi, I. V. Farr and M. M. Lerner, J. Mater. Chem., 1996, 6, 103 RSC.
- J. F. Bai, J. L. Zuo, W. L. Tan, W. Ji, Z. Shen, H. K. Fun, K. Chinnakali, I. A. Razak, X. Z. You and C. M. Che, J. Mater. Chem., 1999, 9, 2419 RSC.
- Y. Ji, J. L. Zuo, L. X. Chen, Y. Q. Tian, Y. L. Song, Y. Z. Li and X. Z. You, J. Phys. Chem. Solids, 2005, 66, 207 CrossRef CAS.
| This journal is © The Royal Society of Chemistry 2012 |
