Photoresponsive behaviors of smectic liquid crystals tuned by an azobenzene chromophore†
Guojie
Wang
*,
Mingzhi
Zhang
,
Tingting
Zhang
,
Jingjing
Guan
and
Huai
Yang
*
School of Materials Science and Engineering, University of Science and Technology Beijing, Beijing, 100083, China. E-mail: guojie.wang@mater.ustb.edu.cn; yanghuai@mater.ustb.edu.cn.; Tel: 86-10-62333759; Fax: 86-10-62333759
First published on 10th November 2011
Abstract
The photoresponsive behaviors of a smectic liquid crystal, 8CB, tuned by an azobenzene chromophore have been systematically investigated. For the smectic 8CB doped with the azobenzene chromophore, 4-n-hexyl-4′-(1-bromopropyloxy)azobenzene (AB), the smectic phase could be switched to nematic and then to isotropic phase induced by the trans-to-cisphotoisomerization of AB upon UV irradiation. For the smectic 8CB doped with AB and the chiral molecule, (S)-(−)-1, 1′-binaphthyl-2, 2′-diol (BD), the smectic phase could be switched to the cholesteric phase and then to the isotropic phase. The initial phase could be recovered when the cis isomer changed to the trans isomer upon visible irradiation. The switching of the position of reflection band of the liquid crystal mixtures could be also realized by photoisomerization. The photoresponsive behaviors are dependent on the composition ratios and the temperature performed in the study.
Introduction
Liquid crystals (LCs) are unique materials, which possess not only the ordering of crystals but also the molecular mobility of liquid.1 Yet the ordering degree of LCs is not as high as that of solid crystals and the LCs are classified as nematic, smectic and cholesteric LCs according to their special molecular arrangement.2 Just because of their fluidity and long-range order, LC molecules are easier to arrange in a new way when they are stimulated by electric field,3 temperature,4–10 and light.11–16It's well-known that azobenzene chromophores are photoresponsive molecules that can undergo reversible isomerization when irradiated with UV and Vis light.17–22 A small amount of azobenzene chromophores could be used as guest molecules to affect the structures and properties of host LCs, due to their trans-to-cisphotoisomerization. The trans form, with a rodlike shape, stabilizes the phase structure of LCs, while the cis form, with a bent form, tends to destabilize the phase structure of the mixture because of its bent shape.23–25
As early as 1971, Sackman prepared a LC mixture composed of azobenzene compounds and cholesteric LCs and found that the pitch of the cholesteric LCs could be changed by the photoisomerization of the azobenzene molecules.26 The photoisomerization of azobenzene could be also applied to regulate the alignment of nematic LCs.27 In addition, The photoisomerization of chiral azobenzenes had been reported to control the phase transition between a nematic and a cholesteric phase.28,29 Ikeda reviewed the photomodulation of LC orientations based on the order–disorder phase transitions and the order–order alignment changes induced by the azobenzene photoisomerization.30 Not long ago, Bunning et al. demonstrated the reflection bandwidth of cholesteric LCs consisting of a high-helical-twisting-power chiral azobenzene molecule could be broadened from 100 nm to as much as 1700 nm.31 The phototuning of more than 2000 nm could be achieved for the cholesteric liquid crystals composed of nematic LCs and the chiral azobenzene compound.32 Dozens of other studies on controlling the structures and properties of nematic and cholesteric LCs by photochemical reactions of photochromic molecules have been reported.33–48
Although the LC mixtures composed of nematic or cholesteric LCs and azobenzene compounds have been comprehensively studied, the LC mixtures composed of smectic LC49 and the photoresponsive molecule are rarely reported, where the smectic layer spacing could be changed by the photoisomerization of azobenzene.50,51 In a preliminary communication,52 we have reported briefly the photoinduced phase transitions in smectic LCs doped with a chiral compound and a photochromic azobenzene. In this paper, we report more details on the photoresponsive behaviors of the smectic liquid crystal, 8CB, tuned by an azobenzene chromophore in the absence and presence of chiral molecules. The effect of azobenzene photoisomerization with different concentrations of the chiral molecule and the azobenzene chromophore on the phase transitions of the smectic LC is systematically explored. By adjusting the concentration of the composites and the temperature performed, the phase transitions from smectic to nematic or to cholesteric and then to isotropic can be reversibly controlled by the azobenzene isomerization through the UV and Vis irradiations. This work not only enriches the study of the phase transitions of liquid crystals by photo-switching but also opens up a new way to prepare cholesteric liquid crystals with selective reflection properties using a smectic liquid crystal.
Experimental section
Materials: The chemical structures of 4-octyl-4′cyanobiphenyl (8CB), 4-n-hexyl-4′-(1-bromopropyloxy)azobenzene (AB) and (S)-(−)-1, 1′- binaphthyl-2, 2′-diol (BD) are given in Scheme 1. 8CB, a smectic LC at around room temperature, was purchased from Shijiazhuang Chengzhi Yonghua Display Materials Co. Ltd. AB is a homemade azobenzene compound.52 The chiral molecule BD was purchased from the Beijing Chunfu Chemical Company. | ||
| Scheme 1 Chemical structures of the compounds used in this study. | ||
Preparation of LC cells: The mixtures examined herein were formed by mixing AB and BD with 8CB host homogeneously. The mixtures were heated to clear point and then were introduced into LC cells with a gap of 5 μm by capillary action. Planar-oriented samples were obtained with the substrates having uniaxially rubbed polyimide layers on their inner surfaces. The composition of the mixtures in the cells is shown in Table 1.
Photo irradiation: UV irradiation for the mixtures was carried out with a high-pressure mercury lamp (365 nm, 500 W nominal power) and UV light intensity was controlled at 10 mw cm−2 by keeping the distance between the lamp and LC cells. The irradiation was pursued until no changes were observed in the absorption spectrum of the sample on further irradiation. Vis irradiation of recovery experiments was afforded by a fluorescent light and the light intensity was controlled at 2 mw cm−2. The experiments were performed at 21 °C unless specified.
Instruments and optical measurement: UV-Vis absorption spectra and transmittance spectra were taken with a UV-Vis spectrometer (JASCO, V-570). Polarized optical microscopy (POM) was carried out using an OLYMPUS (BX51) polarizing microscope. The experiments were performed at 21 °C unless specified.
Results and discussion
Phase transitions in smectic LCs doped with the azobenzene AB
8CB is a smectic LC at around room temperature and the textures can be observed by POM, shown in the ESI.† To investigate the effect of the photoresponsive azobenzene on the smectic LC, we prepared four samples with different amount of the azobenzene AB: LC–A1, LC–A2, LC–A3, and LC–A4, the mass percentages of AB in which are 3%, 5%, 7%, and 10%, respectively.Fig. 1 shows the UV absorption spectra of the sample LC–A1 containing 3% AB before and after UV irradiation at 21 °C. The mixtures doped with AB exhibit their absorption maxima at about 354 nm and weak bands at about 441 nm which are related to π–π* and n-π* transition bands of the transazobenzene, respectively. Upon UV irradiation, the intensity of the π–π* transition band at 354 nm decreased and the intensity of the n-π* transition band at 441 nm increased gradually until the photostationary states were obtained. The cis isomer fraction Y53 was determined from the absorbance by
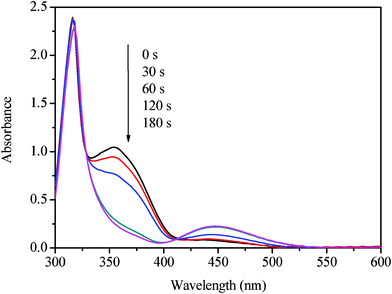 | ||
| Fig. 1 UV-Vis absorption spectra of LC–A1 (97% of 8CB, 3% of AB) under UV irradiation 365 nm for 0, 30, 60, 120, and 180 s, at 21 °C. | ||
| Y = 1.05 × (1−A/A0) |
The phase transitions of the LC cells doped with azobenzene AB upon the UV irradiation were observed by POM, shown in Fig. 2. Before UV irradiation, the initial phases of the cells were all smectic, where the azobenzene was in the trans form; after UV irradiation, disordered phases could be observed, where the azobenzene became the cis form. For the LC cell of LC–A1 (3% of AB), the parabolic focal conic texture of the smectic changed to a nematic schlieren texture upon the UV irradiation, shown in Fig. 2a, but no transition from nematic to isotropic was found even after the trans-to-cis photostationary state. With the increase of the amount of the azobenzene, the smectic states could be changed to nematic and then to more disordered states. For the LC cells of LC–A2 and LC–A3 (containing 5% and 7% of AB, respectively), the bubble-like textures could be observed at the trans-to-cis photostationary states, shown in Fig. 2b and 2c. When increasing the amount of azobenzene AB to 10%, an isotropic state could be obtained at the photostationary state, which can be seen from the texture changes of LC–A4, shown in Fig. 2d. The smectic textures of the cells could be recovered after the samples were kept in dark for 12 h or irradiated by visible light for 3 h. The photoinduced phase transition from smectic to nematic and then to isotropic in the LC mixtures is brought out by the photoisomerization of azobenzene. It has been proved that the photoinduced phase instabilities in smectic LCs was due to the photoisomerization and a subsequent increase in the smectic layer spacing was observed.50,51 The trans form of the azobenzene, which possesses a rodlike shape, stabilizes the smectic LC phase. After UV irradiation, the trans form is converted to the cis form, which possesses a bent shape and decreases the order of the LC. The cis form induces the phase transition from smectic to nematic and then to isotropic when the amount of azobenzene is enough in the 8CB mixtures.
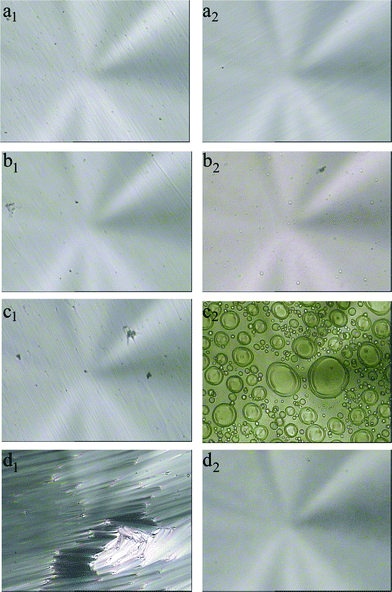 | ||
| Fig. 2 Polarized optical micrographs of 8CB doped with the azobenzene chromophore AB before and after UV irradiation for 480 s at 21 °C. (a1) and (a2) are graphs of the sample LC–A1 doped with 3% of AB before and after UV irradiation, respectively; (b1) and (b2) are graphs of the sample LC–A2 doped with 5% of AB before and after UV irradiation, respectively; (c1) and (c2) are graphs of the sample LC–A3 doped with 7% of AB before and after UV irradiation, respectively; (d1) and (d2) are graphs of the sample LC–A4 doped with 10% of AB before and after UV irradiation, respectively. Magnification: 400. | ||
Phase transitions in smectic LCs doped with a chiral molecule and the azobenzene AB
It is well known that nematic LCs mixed with chiral molecules can exhibit cholesteric structures. Since the smectic 8CB doped with the azobenzene AB can be switched to nematic upon UV irradiation, it may exhibit a cholesteric structure when mixing with a chiral molecule. To investigate the phase transitions in smectic LCs doped with azobenzene and chiral molecules, the sample of LC–A–B1 with 3% of AB and 1% of BD were prepared and the texture changes upon UV irradiation were characterized by POM at 28 °C. Fig. 3a shows POM images of the LC cell LC–A–B1 upon UV irradiation. It can be seen that the structure of LC–A–B1 was smectic phase (fan-like texture) before UV irradiation and the texture changed to a cholesteric phase (oily-steak texture) gradually upon the irradiation. The texture change was also verified by the increase of transmission, shown in Fig. 3b. The transmission increased from 60% before UV irradiation to 75%, 85% and then to 95% in the range of visible wavelength upon UV irradiation for 10 s, 30 s, and 60 s, respectively. The oily-steak cholesteric phase possessed a higher transmission than that of the fan-like smectic phase. For the LC cell LC–A–B1 with only 1% of the azobenzene AB, no cholesteric-to-isotropic phase transition was observed under the prolonged irradiation, as could be ascribed to the low concentration of the azobenzene AB.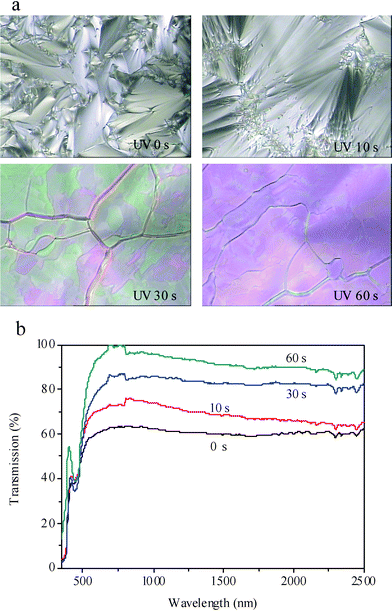 | ||
| Fig. 3 Polarized optical micrographs (a), magnification: 400, and transmission spectra (b) of the sample LC–A–B1 (96% of 8CB, 1% of BD, 3% of AB) under UV irradiation for 0, 10, 30, and 60 s, at 28 °C. | ||
When the concentration of AB was increased to 10%, the phase transition of the LC cell LC–A–B2 (89% of 8CB, 10% of AB and 1% of BD) from smectic to cholesteric and then to isotropic could be observed upon UV irradiation and the isotropic phase could be recovered to cholesteric and then to smectic phases upon visible light irradiation, which was revealed by POM, as shown in Fig. 4. The texture changes from the smectic to cholesteric and then to isotropic under UV irradiation for 0 s, 60 s, and 480 s are shown in Fig. 4a, 4b and 4c, respectively. Fig. 4d and 4e reveal the cholesteric and smectic textures under Vis irradiation for 0.5 h and 3 h, respectively. Fig. 5 exhibits the absorbance changes upon the UV and Vis irradiation, where the trans-to-cis and cis-to-trans transitions of the azobenzene AB were observed. The absorption band at 356 nm decreased and the band at 440 nm increased upon UV irradiation and the bands recovered upon visible irradiation for 3 h.
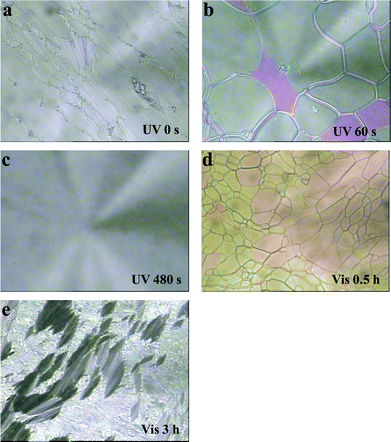 | ||
| Fig. 4 Polarized optical micrographs of the sample LC–A–B2 (89% of 8CB, 1% of BD, 10% of AB) under UV and Vis irradiation at 21 °C. (a), (b), (c), (d) and (e) corresponding to UV irradiation for 0 s, 60 s, 480 s and then to Vis irradiation for 0.5 h and 3 h, respectively, at 21 °C. Magnification: 100. | ||
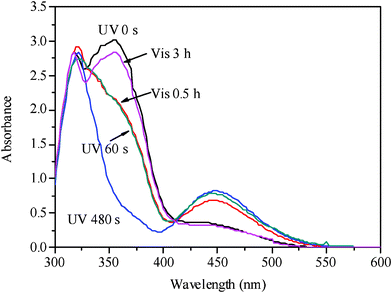 | ||
| Fig. 5 UV–Vis absorption spectra of the sample LC–A–B2 (89% of 8CB, 1% of BD, 10% of AB) under UV and Vis irradiation at 21 °C. | ||
Although the cholesteric structure could be obtained in the above LC cells upon UV irradiation, the reflection band was not observed in the transmission spectra (out of measurement), which could result from the low concentration of the chiral dopant. The spectral position of the reflective cholesteric LC mixtures is given in the following equation.54–56

| (1) |
 is the average of the ordinary (no) and extraordinary (ne) refractive indices for the LC , and P is the helical pitch of the cholesteric LC. The position of λb is directly related to the concentration of the chiral dopant. The higher the concentration of chiral dopant, the smaller the helical pitch, and then the shorter the reflection wavelength.
When the concentration of the chiral BD increased to 2.5% and 5%, the reflection notch of the LC cells was observed and the wavelength of λb was 2340 nm and 1274 nm, respectively, before UV irradiation at 28 °C, shown in Fig. 6a and 6b. The helical pitch of the cholesteric LCs decreased from 1466 nm to 796 nm when the concentration of BD increased from 2.5% to 5% ( = 1.6). Both of the reflection notches of the samples red-shifted and became weak upon UV irradiation.
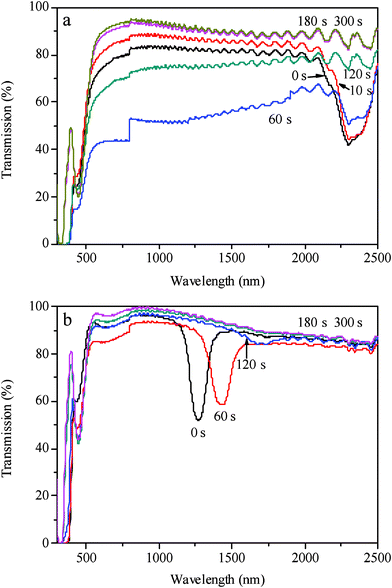 | ||
| Fig. 6 Transmission spectra of the sample LC–A–B3 (92.5% of 8CB, 2.5% of BD, 5.0% of AB) (a) and the sample LC–A–B5 (90% of 8CB, 5% of BD, 5% of AB) (b) under UV irradiation at 28 °C. | ||
For the LC cell LC–A–B3 (96.0% of 8CB, 5.0% of AB, 2.5% of BD), the λb increased from 2340 nm to 2342 nm and then to 2346 nm under UV irradiation for 10 s and 60 s, respectively, and then the band disappeared under irradiation for 120 s, as shown in Fig. 6a. The transmission of the mixture upon UV irradiation for 60 s is lower than others in the wavelength region of 500∼2000 nm, as could be ascribed to the formed cholesteric focal conic texture in the mixture. The texture changes from cholesteric planar structure to fan-shaped focal conic structure and then to isotropic upon UV irradiation were confirmed by the polarized optical micrographs, shown in the ESI.† Cholesteric structures include planar and focal conic structures. Planar cholesteric structure (oily streaks texture), where the helical axis is normal to the substrates (the director of the molecules is oriented parallel to the substrates), shows a high transmittance in the visible and infra-red wavelength range except the reflection range. A fan-shaped focal conic structure, where the helical axes are randomly distributed (within individual fans the helix axis, equivalent to the optic axis, is oriented uniformly), scatters light of all frequencies in all directions. The lower transmission of the mixture upon irradiation for 60 s in the wavelength region 500∼2000 nm might be ascribed to the transition from planar to focal conic structures disturbed by the trans-to-cisisomerization of azobenzene.
For the LC cell LC–A–B5 (96.0% of 8CB, 5.0% of AB, 5% of BD), the λb increased from 1274 nm to 1436 nm and then to 1672 nm under irradiation for 60 s and 120 s, respectively, and then the band disappeared under UV irradiation for 180 s, as shown in Fig. 6b.
The red-shift of the reflection bands, the decrease of the intensity and the disappearance of the bands upon UV irradiation resulted from the perturbation effect of the cis azobenzene molecules. By adjusting the cis isomer fraction in the mixtures, both the position and the intensity of the reflection bands could be tuned. Thus the optical properties of the smectic LC hybrid could be controlled by photo-switching the trans-to-cisphotoisomerization of the azobenzene.
Effect of temperature on the photo-switching
Since the phase transition of LCs and the photo-isomerization process of azobenzene are greatly dependent on temperature, a sample of LC–A–B4 doped with 5% of the azobenzene AB and 4% of the chiral BD were investigated at different temperatures. Fig. 7a and 7b show the POM photographs of LC–A–B4 upon UV irradiation at 21 °C and 28 °C, respectively. At 21 °C the texture of LC–A–B4 before UV irradiation was smectic (Fig. 7a1) and then changed to cholesteric under irradiation for 120 s (Fig. 7a2). With increasing irradiation time further, mixed phases of the cholesteric and the isotropic were observed. Isotropic regions (bubble-like) in the sample increased and enlarged when the irradiation time increased from 300 s to 480 s, shown in Fig. 7a3 and 7a4, respectively. At 28 °C the higher temperature resulted in the decrease of the order of the smectic 8CB and then the cholesteric phase formed before UV irradiation, shown in Fig. 7b1 where the azobenzene is in the trans form. Under this temperature, the cholesteric phase gradually changed to the mixed phase of the cholesteric phase and isotropic phase upon UV irradiation, shown in Fig. 7b2 and 7b3. At last, the cholesteric phase disappeared and changed to the isotropic phase completely upon UV irradiation for 300 s (Fig. 7b4), where the cis form of the azobenzene was dominant.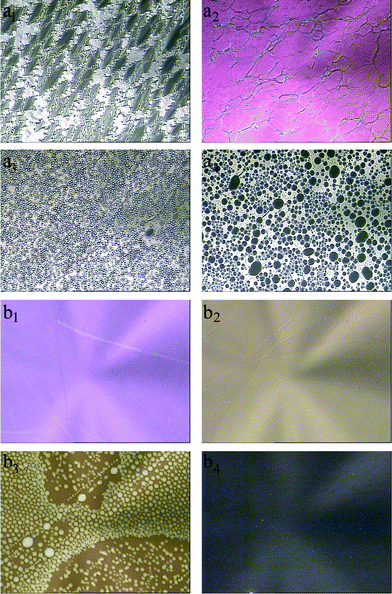 | ||
| Fig. 7 Polarized optical micrographs of the sample LC–A–B4 (91% of 8CB, 4% of BD, 5% of AB) under UV irradiation: a1, a2, a3 and a4 corresponding to UV irradiation for 0 s, 120 s, 300 s and 480 s, respectively, at 21 °C, magnification: 100; b1, b2, b3 and b4 corresponding to UV irradiation for 0 s, 60 s, 120 s and 300 s, respectively, at 28 °C, magnification: 400. | ||
The transmission spectra of the sample LC–A–B4 upon UV irradiation at 21 °C and 28 °C are shown in Fig. 8a and 8b, respectively. At the lower temperature of 21 °C, the transmission of the sample before UV irradiation was low, shown in Fig. 8a, yet after irradiation for 120 s, the transmission increased a lot and a reflection band appeared, as was consistent with the appearance of the cholesteric texture shown by the POM. The position of the reflection band centered at 1616 nm red-shifed to 1806 nm and then to 2032 nm and the intensity decreased gradually when the sample was irradiated for 300 s and 480 s, respectively. At the higher temperature of 28 °C, the sample exhibited cholesteric phase and the reflection band centered at 1580 nm appeared before UV irradiation, shown in Fig. 8b. The reflection band red-shifted to 1700 nm under irradiation for 60 s and the band almost disappeared under irradiation for 120 s, whereas the reflection band at 21 °C still existed under irradiation for 480 s shown in Fig. 8a. The azobenzene isomerization reaction is known to be faster at higher temperature;57,58 the trans isomers could be transformed into cis isomers more quickly at 28 °C under UV irradiation compared with the lower temperature 21 °C. Thus it is understandable that the phase transition of the mixture from order to disorder disturbed by the isomerization is faster at 28 °C, combining the knowledge that the fluidity of LCs can be enhanced and it is easier to change its molecular arrangement at higher temperature.
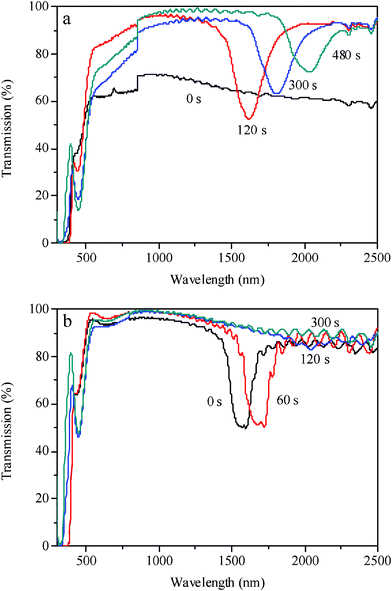 | ||
| Fig. 8 Transmission spectra of the sample LC–A–B4 (91% of 8CB, 4% of BD, 5% of AB) under UV irradiation: (a) at 21 °C; (b) at 28 °C. | ||
Conclusion
Photoresponsive behaviors of a smectic liquid crystal, 8CB, tuned by an azobenzene chromophore were investigated. For the LC cells of 8CB doped with the azobenzene compound AB, the nematic phase could be switched to nematic and then to isotropic phase induced by the trans-to-cisphotoisomerization of AB upon the UV irradiation. For the LC cells of 8CB doped with the azobenzene compound AB and a chiral compound BD, the smectic phase could be switched to cholesteric and then to the isotropic phase induced by the trans-to-cisphotoisomerization of AB upon the UV irradiation. The initial phase could be recovered when the cis isomer changed to trans form upon visible irradiation or thermally driving. The switching of the position of reflection band of the LC mixtures could be also realized by the photoisomerization. By adjusting the concentration of the azobenzene compound AB and chiral compound BD and the temperature performed, the phase transitions from smectic to nematic or to cholesteric and then to isotropic can be reversibly controlled by the UV and Vis irradiations. This work not only enriches the study of the phase transitions of smectic liquid crystals by photo-switching but also opens up a new way to prepare cholesteric liquid crystals with selective reflection properties.Acknowledgements
This work was supported by the National Natural Science Foundation of China (Grant No. 21074010 and 51025313), Beijing Municipal Natural Science Foundation (Grant No. 2112029), Beijing Research Foundation for Excellent Talents (Grant No. 2010D009006000002), Scientific Research Foundation for the Returned Overseas Chinese Scholars, State Education Ministry of China.References
- D. Demus, J. Goodby, G. W. Gray, H. W. Spiess and W. Vill, Handbook of Liquid Crystals: Wiley-VCH: Weinheim, 1998 Search PubMed.
- G. W. Gray, Thermotropic Liquid Crystals: Wiley: Chichester, 1987 Search PubMed.
- E. Smela, Adv. Mater., 2003, 15, 481–496 CrossRef CAS.
- C. J. Legge and G. R. Mitchell, J. Phys. D: Appl. Phys., 1992, 25, 492–499 CrossRef CAS.
- S. Kurihara, T. Ikeda and S. Tazuke, Mol. Cryst. Liq. Cryst., 1990, 178, 117–132 CAS.
- K. S. Cheon, J. V. Selinger and M. M. Green, Angew. Chem., Int. Ed., 2000, 39, 1482–1485 CrossRef CAS.
- K. Maeda, H. Mochizuki, M. Watanabe and E. Yashima, J. Am. Chem. Soc., 2006, 128, 7639–7650 CrossRef CAS.
- J. Naciri, A. Srinivasan, H. Jeon, N. Nikolov, P. Keller and B. R. Ratna, Macromolecules, 2003, 36, 8499–8505 CrossRef CAS.
- D. L. Thomsen, P. Keller, J. Naciri, R. Pink, H. Jeon, D. Shenoy and B. R. Ratna, Macromolecules, 2001, 34, 5868–5875 CrossRef.
- H. Wermter and H. Finkelmann, e-Polymers (www.e-polymers.org.), 2001 Search PubMed , no. 013.
- D. Pijper, M. G. M. Jongejan, A. Meetsma and B. L. Feringa, J. Am. Chem. Soc., 2008, 130, 4541–4552 CrossRef CAS.
- D. Pijper and B. L. Feringa, Soft Matter, 2008, 4, 1349–1372 RSC.
- Y. Yu, T. Ikeda and J. Photochem, J. Photochem. Photobiol., C, 2004, 5, 247–265 CrossRef CAS.
- T. Ikeda, T. Miyamoto, S. Kurihara, M. Tsukada and S. Tazuke, Mol. Cryst. Liq. Cryst., 1990, 182B, 357–371 CAS.
- T. Ikeda, T. Miyamoto, S. Kurihara, M. Tsukada and S. Tazuke, Mol. Cryst. Liq. Cryst., 1990, 188, 207–222 CAS.
- M. M. Green, S. Zanella, H. Gu, T. Sato, G. Gottarelli, S. K. Jha, G. P. Spada, A. M. Schoevaars, B. L. Feringa and A. Teramoto, J. Am. Chem. Soc., 1998, 120, 9810–9817 CrossRef CAS.
- J. H. Wendorff, M. Eich, B. Reck and H. Ringsdorf, Makromol. Chem. Rapid Commun., 1987, 8, 59–63 CrossRef CAS.
- N. Tamaoki and M. Wada, J. Am. Chem. Soc., 2006, 128, 6284–6285 CrossRef CAS.
- J. Henzl, M. Mehlhorn, H. Gawronski, K. H. Rieder and K. Morgenstern, Angew. Chem., Int. Ed., 2006, 45, 603–606 CrossRef CAS.
- M. Kondo, Y. Yu and T. Ikeda, Angew. Chem., Int. Ed., 2006, 45, 1378–1382 CrossRef CAS.
- M. Mathews and N. Tamaoki, J. Am. Chem. Soc., 2008, 130, 11409–11416 CrossRef CAS.
- H. F. Yu and T. Ikeda, Adv. Mater., 2011, 23, 2149–2180 CrossRef CAS.
- G. S. Kumar and D. C. Neckers, Chem. Rev., 1989, 89, 1915–1925 CrossRef CAS.
- K. Ichimura, Chem. Rev., 2000, 100, 1847–1873 CrossRef CAS.
- A. Natansohn and P. Rochon, Chem. Rev., 2002, 102, 4139–4175 CrossRef CAS.
- E. Sackmann, J. Am. Chem. Soc., 1971, 93, 7088–7090 CrossRef CAS.
- K. Ichimura, Y. Suzuki, T. Seki, A. Hosoki and K. Aoki, Langmuir, 1988, 4, 1214–1216 CrossRef CAS.
- S. Kurihara, S. Nomiyama and T. Nonaka, Chem. Mater., 2000, 12, 9–12 CrossRef CAS.
- S. Kurihara, S. Nomiyama and T. Nonaka, Chem. Mater., 2001, 13, 1992–1997 CrossRef CAS.
- T. Ikeda, J. Mater. Chem., 2003, 13, 2037–2057 RSC.
- T. J. White, A. S. Freer, N. V. Tabiryan and T. J. Bunning, J. Appl. Phys., 2010, 107, 073110 CrossRef.
- T. J. White, R. L. Bricker, L. V. Natarajan, N. V. Tabiryan, L. Green, Q. Li and T. J. Bunning, Adv. Funct. Mater., 2009, 19, 3484–3488 CrossRef CAS.
- X. Tong, G. Wang and Y. Zhao, J. Am. Chem. Soc., 2006, 128, 8746–8747 CrossRef CAS.
- X. Tong and Y. Zhao, Chem. Mater., 2009, 21, 4047–4054 Search PubMed.
- N. Tamaoki, S. Song, M. Moriyama and H. Matsuda, Adv. Mater., 2000, 12, 94–97 CrossRef CAS.
- V. A. Mallia and N. Tamaoki, Chem. Soc. Rev., 2004, 33, 76–84 RSC.
- H. Akiyama, V. A. Mallia and N. Tamaoki, Adv. Funct. Mater., 2006, 16, 477–484 CrossRef CAS.
- S. Abraham, V. A. Mallia, K. V. Ratheesh, N. Tamaoki and S. Das, J. Am. Chem. Soc., 2006, 128, 7692–7698 CrossRef CAS.
- M. L. Bossi, D. H. Murgida and P. F. Aramendia, J. Phys. Chem. B, 2006, 110, 13804–13811 CrossRef CAS.
- B. L. Feringa, N. P. M. Huck and H. A. Van Doren, J. Am. Chem. Soc., 1995, 117, 9929–9930 CrossRef CAS.
- C. Denekamp and B. L. Feringa, Adv. Mater., 1998, 10, 1080–1082 CrossRef CAS.
- B. L. Feringa, W. F. Jager and B. De Lange, J. Chem. Soc., Chem. Commun., 1993, 288–290 RSC.
- W. F. Jager, J. C. De Jong, B. De Lange, N. P. M. Huck, A. Meetsma and B. L. Feringa, Angew. Chem., Int. Ed. Engl., 1995, 34, 348–350 CrossRef CAS.
- Y. Yokoyama and T. Sagisaka, Chem. Lett., 1997, 8, 687–688 Search PubMed.
- H. K. Lee, K. Doi, H. Harada, O. Tsutsumi, A. Kanazawa, T. Shiono and T. Ikeda, J. Phys. Chem. B, 2000, 104, 7023–7028 CrossRef CAS.
- M. Mathews, R. S. Zola, S. Hurley, D. K. Yang, T. J. White, T. J. Bunning and Q. Li, J. Am. Chem. Soc., 2010, 132, 18361–18366 Search PubMed.
- J. Ma, Y. N. Li, T. White, A. Urbas and Q. Li, Chem. Commun., 2010, 46, 3463–3465 RSC.
- L. Green, Y. N. Li, T. White, A. Urbas, T. Bunning and Q. Li, Org. Biomol. Chem., 2009, 7, 3930–3933 RSC.
- J. P. F. Lagerwall and F. Giesselmann, ChemPhysChem, 2006, 7, 20–45 CrossRef CAS.
- Y. Lansac, M. A. Glaser, N. A. Clark and O. D. Lavrentovich, Nature, 1999, 398, 54–57 CrossRef CAS.
- W. R. Folks, Y. A. Reznikov, L. Chen, A. I. Khizhnyak and O. D. Lavrentovich, Mol. Cryst. Liq. Cryst. Sci. Technol., Sect. A, 1995, 261, 259–270 Search PubMed.
- G. J. Wang, M. Z. Zhang, Q. Yang, F. Liu, Z. H. Cheng, R. W. Guo and H. Yang, Chem. Lett., 2010, 39, 1144–1145 Search PubMed.
- J. G. Victor and J. M. Torkelson, Macromolecules, 1987, 20, 2951–2954 CrossRef CAS.
- G. Solladié and R. G. Zimmermann, Angew. Chem., Int. Ed. Engl., 1984, 23, 348–362 CrossRef.
- S. Pieraccini, A. Ferrarini and G. P. Spada, Chirality, 2008, 20, 749–759 CrossRef CAS.
- S. T. Wu and D. K. Yang, Reflective Liquid Crystal Displays: John Wiley & Sons: West Sussex, 2001 Search PubMed.
- K. Matczyszyn, A. Chwialkowska and J. Sworakowski, Thin Solid Films, 2008, 516, 8899–8904 CrossRef CAS.
- J. Garcia-Amorós, M. Martínez, H. Finkelmann and D. Velasco, J. Phys. Chem. B, 2010, 114, 1287–1293 CrossRef CAS.
Footnote |
| † Electronic Supplementary Information (ESI) available. See DOI: 10.1039/c1ra00615k/ |
| This journal is © The Royal Society of Chemistry 2012 |
