DOI:
10.1039/C1RA00661D
(Paper)
RSC Adv., 2012,
2, 566-572
A method for synthesizing ZnO–carbonaceous species nanocomposites, and their conversion to quasi-single crystal mesoporous ZnO nanostructures†
Received
1st September 2011
, Accepted 2nd October 2011
First published on 16th November 2011
Abstract
We report a method for synthesizing quasi-single crystal mesoporous ZnO nanostructuresvia a self-generated templating approach. ZnO–carbonaceous species nanocomposites (average diameter of ∼500 nm) were synthesized using a microwave-assisted hydrothermal reaction. The nanocomposites consisted of quasi-single crystalline ZnO regions and amorphous carbonaceous regions, which formed a self-generated nanotemplate. These nanocomposites were converted into quasi-single crystalline mesoporous ZnO nanostructures during combustion of the amorphous carbonaceous species (the template removing step). The adsorption properties and photocatalytic activities of the mesoporous ZnO structures were evaluated. The mesoporous ZnO structures showed better adsorption than the commercial ZnO nanostructures with similar dimensions or the 3D ZnO structures composed of nanoplates with {2![[1 with combining macron]](https://www.rsc.org/images/entities/char_0031_0304.gif)
![[1 with combining macron]](https://www.rsc.org/images/entities/char_0031_0304.gif) 0} planar surfaces (benchmark materials) even though the BET surface area of the 3D ZnO structures was larger than that of the mesoporous ZnO structures. The quasi-single crystal mesoporous ZnO structures exhibited a high photocatalytic activity.
0} planar surfaces (benchmark materials) even though the BET surface area of the 3D ZnO structures was larger than that of the mesoporous ZnO structures. The quasi-single crystal mesoporous ZnO structures exhibited a high photocatalytic activity.
1. Introduction
Zinc oxide (ZnO, space group = P63mc; a = 0.32495 nm, c = 0.52069 nm) is a II–VI semiconductor with a direct band gap of 3.37 eV at room temperature and a large free exciton binding energy of approximately 60 meV. ZnO has other useful characteristics, such as a large piezoelectric constant, good biocompatibility, and good photocatalytic activity. The properties of semiconducting materials depend on its structure, including the morphology, aspect ratio, and size, orientation and density of crystal.1–3 The development of ZnO synthesis methods that can be used to control the shape and crystalline nature would be indispensable for exploring the potential of ZnO as a smart functional material.2,4 Various synthetic routes permit ZnO to form a rich variety of nanostructures, ranging from simple nanorods to three-dimensional complicated hierarchical structures.5–14
Among the various ZnO structures, porous and/or hollow ZnO structures have been extensively investigated for their outstanding electronic, optical, catalytic, and photocatalytic properties.15–24 Among the techniques for synthesizing such structures, sacrificial templating approaches are well-known versatile methods that have attracted considerable attention. These methods are widely used due to the advantages of a relatively obvious formation mechanism and easy control over the inner space size. Sacrificial template technologies are usually based on a removable template composed of polystyrene,25 colloidal carbon spheres,26 or spherobacteria.27 For example, Agrawal et al. reported the preparation of core-shell polystyrene–ZnO composite particles and hollow and porous ZnO structures by calcination.25 Wang et al. prepared size-tunable porous ZnO hollow spheres using colloidal carbon spheres as templates.26 Yan et al. reported that Zn5(CO3)2(OH)6 microspheres could be converted into hollow ZnO structures in a KOH solution.28 Zhou et al. synthesized hollow porous ZnO spheres using Str. thermophilus (spherobacteria) as a sacrificial biotemplate.27 However, many template methods suffer from high preparation expenses. The dimensions of the sacrificial templates range from several hundred nanometres to tens of micrometres. ZnO structures with large internal spaces (macropores) corresponding to the size and shape of the template have thereby been synthesized. In addition, most ZnO structures synthesized via these sacrificial template routes are polycrystalline in nature.
Mesoporous metal oxides synthesized by in situ-generated sacrificial carbonaceous template methods has been reported.29–31 These methods were cost-effective and their products had high surface areas. In this paper, we report a method for synthesizing quasi-single crystal mesoporous ZnO nanostructures using a self-generated nanotemplate. This synthetic strategy consisted of two steps. First, ZnO–carbonaceous species nanocomposites were formed through a microwave-assisted hydrothermal reaction. Then, these ZnO–carbonaceous species nanocomposites were converted into mesoporous ZnO nanostructures through combustion of the amorphous carbonaceous nanotemplates (the template removing step). This method does not involve as-formed templates, and nanopores are formed in a diverse range of sizes throughout the quasi-single crystalline structures. The adsorption properties and photocatalytic activities of the mesoporous ZnO structures were evaluated.
2. Experimental
Synthesis of ZnO–carbonaceous species nanocomposites
All chemicals used in this study were of analytical grade and were used without further purification. An aqueous solution containing 0.01 M zinc nitrate hexahydrate (Zn(NO3)2·6H2O, 98%, Samchun), 0.01 M hexamethylenetetramine (HMT, (CH2)6N4, 99%, Samchun), and 0.002 M L(+)-ascorbic acid (vitamin C, C6H8O6, 99.5%, Samchun) was prepared. The solution was loaded into a microwave reactor (Discover SP, CEM Corporation), heated to 180 °C, and then maintained at 180 °C for 30 min. After the reaction, the solution was filtered through a polycarbonate membrane filter (ISOPORE) to remove the liquid phase of the solution. The filtered powders were washed several times with deionized water and dried in an oven at 60 °C for 12 h.
Conversion of the ZnO–carbonaceous species nanocomposites into quasi-single crystal mesoporous ZnO nanostructures
The as-prepared ZnO–carbonaceous species nanocomposite powders were placed in a furnace (Lindberg, Blue M) and maintained at 600 °C for 2 h in air. After calcination, the powders were removed from the furnace and characterized.
Characterization
The morphology, crystallinity, crystalline nature, functional groups, chemical composition, and optical properties of the samples were examined by field-emission scanning electron microscopy (FESEM, JEOL JMS-7401F, operated at 10 keV), high-resolution scanning transmission electron microscopy (Cs-corrected HR-STEM, JEOL JEM-2200FS with an energy-dispersive X-ray spectrometer (EDX) and an electron energy loss spectrometer (EELS)), X-ray diffraction (XRD, Mac Science, M18XHF using Cu-Kα (λ = 0.15406 nm) radiation), Fourier transform infrared spectroscopy (FT-IR, Jasco Valor-II spectrometer), elemental analysis (Analysennsysteme GmBH, Vario EL II), and UV-vis diffuse reflectance spectroscopy (Shimadzu, UV2501PC). Cross-sectional samples were prepared using a dual beam focused ion beam (FIB, Helios Nano-Lab). Brunauer–Emmett–Teller (BET) nitrogen adsorption–desorption curves were measured using a Micromeritics analyzer (ASAP 2020 V3.01 H analyzer).
Dye
adsorption measurements
The adsorption of dyes onto the ZnO powders was measured using Orange-II (4-(2-hydroxy-1-naphthylazo)benzenesulfonic acid, Aldrich) dye. A 50 mg sample of ZnO powder was transferred to 100 mL of a 5.0 × 10⁻⁵ M Orange-II solution. The suspension was aged in a closed and dark system with stirring. The quantity of Orange-II in solution was determined by measuring the absorption intensity at 486 nm (the wavelength corresponding to the main Orange-II absorption peak) using a UV-vis diffuse reflectance spectrometer.
Photocatalytic activity measurements
The photodecomposition of Orange-II was used to study the catalytic properties of ZnO powders. The photocatalytic reactions in aqueous solution were carried out at room temperature in a closed system using a mercury lamp (1 W cm−2, Model 66905, Newport Co.). ZnO powders were transferred to 100 mL of a 5.0 × 10⁻⁵ M Orange-II solution. With stirring, the suspensions were exposed to light irradiation. The quantity of Orange-II in solution was determined using a UV-vis diffuse reflectance spectrometer.
3. Results and discussion
Fig. 1(a) shows an SEM image of the powders synthesized from the reaction of an aqueous solution containing 0.01 M zinc nitrate hexahydrate, 0.01 M HMT, and 0.002 M L(+)-ascorbic acid at 180 °C for 30 min. The structures had an average diameter of ∼500 nm. The upper inset shows a high-resolution image of a particle. The particles had smooth surfaces. Powders were brown in color, as shown in the lower inset of Fig. 1(a) and Figure S1 (UV-vis absorption spectrum) of the Electronic Supplementary Information (ESI)†. The spectrum exhibited broad visible light absorption and strong UV absorption, which was characteristic of the wide band gap ZnO semiconductor materials. Fig. 1(b) shows the XRD pattern from the powders. The XRD peaks could be indexed as a hexagonal wurtzite ZnO crystalline structure with calculated lattice constants of a = 0.3251 nm and c = 0.5209 nm. These lattice constants were consistent with those previously reported (JCPDS No. 36–1451). To investigate the interior and crystalline nature of the structures, HR–STEM analysis was conducted. The cross-sectional film of a particle was prepared by FIB. Fig. 2(a) shows the cross-section of a particle. Unlike the external appearance, the structure did not have a uniform interior. The cross-section consisted of an outer dark shell (area I), a core of intermediate brightness (area II), and bright shell region (area III). A high-angle annular dark-field (HAADF) image confirmed this structural feature (Fig. 2(b)). The selected-area electron diffraction (SAED) pattern of the structure showed hexagonally arranged spots, indicating the quasi-single crystalline nature of the crystalline structure (Fig. 2(c)). A more magnified transmission electron microscope (TEM) image (Fig. 2(d)) showed one region of the structure. Bright and dark regions were present. Their interface is indicated by a circle in Fig. 2(d) (high-resolution TEM, HR–TEM, Fig. 2(e)), which presents a crystalline area (darker) and an amorphous area (brighter). The crystalline region was single crystalline in nature with a lattice spacing of 0.28 nm, which corresponded to the interspacings of the {100} planes in the ZnO crystal lattice. The bright amorphous regions indicated the presence of regions of lower atomic weight elements. The EELS elemental maps demonstrated that Zn (Fig. 2(f)) and O (Fig. 2(g)) were mainly distributed within the darker (crystalline) regions, and C (Fig. 2(h)) and N (Fig. 2(i)) were distributed within the brighter (amorphous) regions.
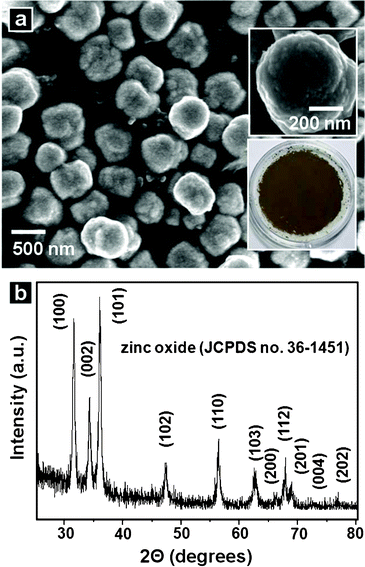 |
| | Fig. 1 (a) SEM image of the powders synthesized from the reaction of an aqueous solution containing 0.01 M zinc nitrate hexahydrate, 0.01 M HMT, and 0.002 M L(+)-ascorbic acid at 180 °C for 30 min. The upper and lower insets of (a) show, respectively, a high-magnification SEM image of the structure and a digital camera image of the powders. (b) XRD pattern of the powders. | |
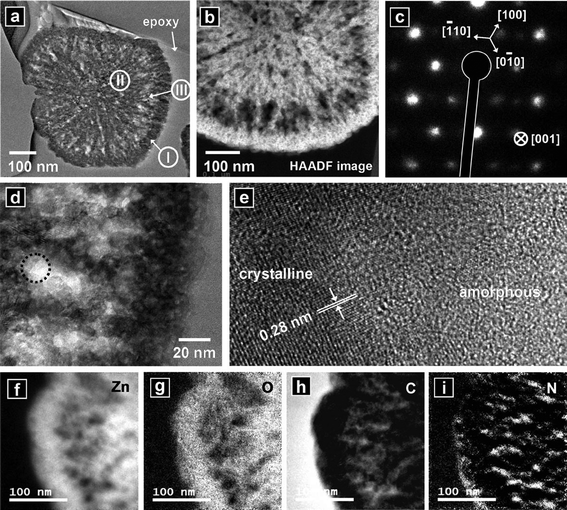 |
| | Fig. 2 (a) And (b): cross-sectional TEM image and HAADF image, respectively, of a nanostructure synthesized from the reaction of an aqueous solution containing 0.01 M zinc nitrate hexahydrate, 0.01 M HMT, and 0.002 M L(+)-ascorbic acid at 180 °C for 30 min. (c) SAED pattern of the structure. (d) Higher magnification TEM image of a region of the structure. (e) HR-TEM image of the area indicated by the circle in (d). (f) Elemental mapping of Zn. (g) Elemental mapping of O. (h) Elemental mapping of C. (i) Elemental mapping of N. | |
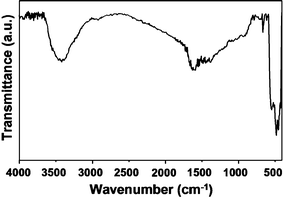
Fig. 3 shows an FT-IR spectrum of the synthesized powders. The strong absorption band in the range of 430–520 cm−1 was assigned to the vibrations of Zn–O in the ZnO. The stretching vibrations of the carbonyl (C![[double bond, length as m-dash]](https://www.rsc.org/images/entities/char_e001.gif) O) groups in vitamin C appeared between 1680 cm−1 and 1740 cm−1. Broad peaks over 750–2000 cm−1 were attributed to ascorbic acid, HMT, or their derivatives. An O–H stretching band at 3475 cm−1 indicated the presence of ascorbic acid or its derivatives, as well as the surface –OH groups of ZnO. Quantitative analysis using the elemental analyzer revealed that the nanocomposites contained 4.97 wt.% carbon and 1.09 wt.% nitrogen. Therefore, the amorphous regions comprised carbonaceous species, ascorbic acid, and HMT or their derivatives. The synthesized nanostructures were therefore found to be ZnO–carbonaceous nanocomposites.
O) groups in vitamin C appeared between 1680 cm−1 and 1740 cm−1. Broad peaks over 750–2000 cm−1 were attributed to ascorbic acid, HMT, or their derivatives. An O–H stretching band at 3475 cm−1 indicated the presence of ascorbic acid or its derivatives, as well as the surface –OH groups of ZnO. Quantitative analysis using the elemental analyzer revealed that the nanocomposites contained 4.97 wt.% carbon and 1.09 wt.% nitrogen. Therefore, the amorphous regions comprised carbonaceous species, ascorbic acid, and HMT or their derivatives. The synthesized nanostructures were therefore found to be ZnO–carbonaceous nanocomposites.
 |
| | Fig. 3
FT-IR spectrum of the powders synthesized from the reaction of an aqueous solution containing 0.01 M zinc nitrate hexahydrate, 0.01 M HMT, and 0.002 M L(+)-ascorbic acid at 180 °C for 30 min. | |
Calcination was conducted to convert the nanocomposites into ZnO nanostructures. Fig. 4(a) shows SEM images of powders obtained from the calcination of the nanocomposites at 600 °C in air for 2 h. The calcined nanostructures included more porous surfaces than those of the nanocomposites prior to calcination. The powders were white in color, as shown in the inset of Fig. 4(a) and Figure S2 (UV-vis absorption spectrum) of the ESI†. Fig. 4(b) shows the XRD patterns of the calcined structures. The XRD peaks were indexed as hexagonal wurtzite ZnO structures. The calculated lattice constants were a = 0.3250 nm and c = 0.5211 nm, which agreed well with those of the nanocomposite prior to the calcination process. A low-magnification TEM image of the calcined powder (Fig. 5(a)) revealed a structure that resembled the nanocomposite before calcination. The SAED pattern of the structure (Fig. 5(b)) exhibited hexagonally arranged spots, as observed before calcination (Fig. 2(c)), indicating a quasi-single crystalline nature after calcination. Fig. 5(c) shows a magnified image of the area indicated by the rectangular in Fig. 5(a). Pores without amorphous materials were observed. The HR-TEM image (Fig. 5(d)) of the area indicated by the rectangle in Fig. 5(c) shows that the structure was single crystalline in nature with a lattice spacing of 0.28 nm, corresponding to the interspacings of the {100} planes in the ZnO crystal lattice. No amorphous regions were observed. Fig. 6(a) shows a HAADF image of the calcined nanostructure. The corresponding EELS elemental mappings demonstrated that Zn (Fig. 6(b)) and O (Fig. 6(c)) were distributed homogeneously throughout the structures. The carbon signals were below the noise level (Fig. 6(d)). Quantitative analysis using an elemental analyzer confirmed that almost all carbon and nitrogen atoms were removed from the calcined structures.
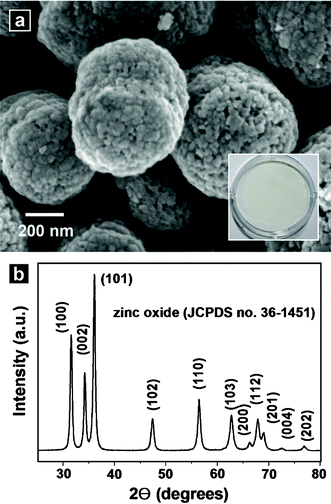 |
| | Fig. 4 (a) SEM image of the powders obtained by calcination of as-prepared ZnO–carbonaceous species nanocomposites at 600 °C for 2 h in air. The inset shows a digital camera image of the calcined powders. (b) XRD pattern of the calcined powders. | |
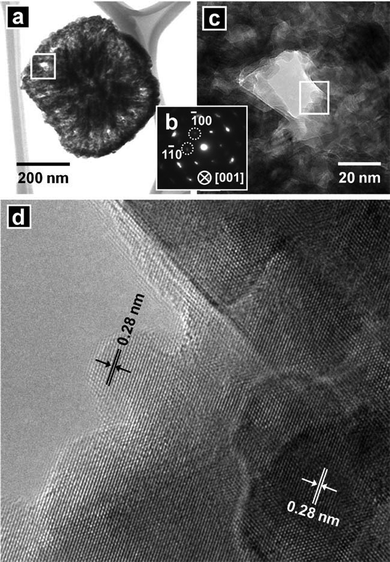 |
| | Fig. 5 (a) TEM image of a nanostructure obtained by calcination of the as-prepared ZnO–carbonaceous nanocomposite at 600 °C for 2 h in air. (b) SAED pattern of the structure. (c) Higher magnification TEM image of the area indicated by the rectangular in (a). (d) HR-TEM image of the area indicated by the rectangular in (c). | |
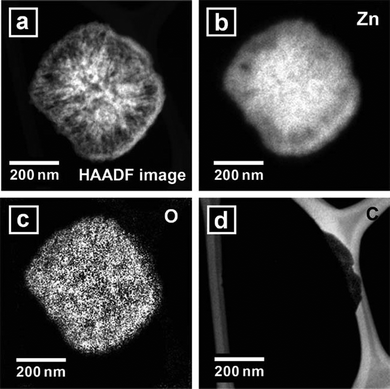 |
| | Fig. 6 (a) HAADF image of the calcined nanostructure. (b) Elemental mapping of Zn. (c) Elemental mapping of O. (d) Elemental mapping of C. | |
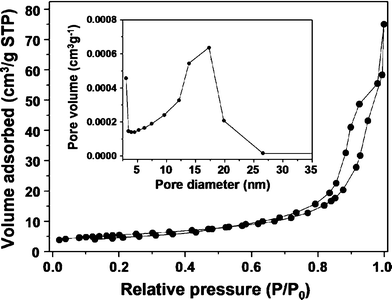
The nitrogen adsorption–desorption isotherm for the calcined ZnO nanostructures is shown in Fig. 7. A type-IV adsorption–desorption isotherm was observed, and such isotherms are usually associated with capillary condensation in mesopores.32 The isotherm featured two hysteresis loops, which indicated a bimodal porosity. The Barrett–Joyner–Halenda method used to calculate the pore size distribution (the inset of Fig. 7) indicated that the as-synthesized samples had a bimodal pore structure with strong peaks centered at 3.1 nm and 17.3 nm. The cumulative pore volume of the mesoporous ZnO nanostructures is 0.08 cm3 g−1. The BET surface area of the mesoporous ZnO nanostructures was 19.8 m2 g−1, far superior to the surface areas of non-mesoporous commercial ZnO nanostructures with similar sizes (7.3 m2 g−1). The key feature of the synthetic strategy for preparing quasi-single crystalline mesoporous ZnO nanostructures was that the carbonaceous nanotemplates self-generated during growth of the nanocomposites, as illustrated in Fig. 8. During the reaction in the solution, ZnO growth and carbonization occurred, leading to formation of amorphous carbonaceous species (self-generated nanotemplates) within the quasi-single crystalline ZnO structures. These ZnO–carbonaceous nanocomposites converted into mesoporous ZnO nanostructures through combustion of the amorphous carbonaceous species. This method did not require pre-formed templates and formed nanopores in a diverse range of sizes.
 |
| | Fig. 7
Nitrogen adsorption–desorption isotherms and the corresponding pore size distributions for calcined powders (inset). | |
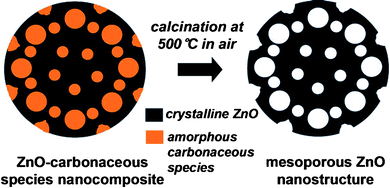 |
| | Fig. 8 Schematic illustration of the conversion of the ZnO–carbonaceous nanocomposite to a mesoporous ZnO nanostructure. | |
The photocatalytic activity of a material is mainly governed by the phase structure, adsorption ability, and separation efficiency of photogenerated electrons and holes.33–35 The adsorption of dyes by the mesoporous ZnO nanostructures was examined using Orange-II dye. Comparisons were made with commercial ZnO nanopowders (BET surface area: 7.3 m2 g−1) with similar dimensions and three-dimensional (3D) flower-like ZnO structures (BET surface area: 24.8 m2 g−1) consisting of nanoplate building blocks with {2![[1 with combining macron]](https://www.rsc.org/images/entities/char_0031_0304.gif)
![[1 with combining macron]](https://www.rsc.org/images/entities/char_0031_0304.gif) 0} planar surfaces.36 A 50 mg sample of each ZnO powder was transferred to 100 mL of a 5.0 × 10⁻⁵ M Orange-II solution. The suspensions were aged in the dark with stirring. The concentration of Orange-II in the solutions was monitored as a function of time. Under conditions in which the Lambert–Beer law was applicable, the concentration c of the absorbing component is proportional to the absorbance A as follows:37
0} planar surfaces.36 A 50 mg sample of each ZnO powder was transferred to 100 mL of a 5.0 × 10⁻⁵ M Orange-II solution. The suspensions were aged in the dark with stirring. The concentration of Orange-II in the solutions was monitored as a function of time. Under conditions in which the Lambert–Beer law was applicable, the concentration c of the absorbing component is proportional to the absorbance A as follows:37
where
l is the length of the light path through the absorbing layer and
ε is the molar absorption coefficient.
Fig. 9(a) shows that the absorbance dropped to 94.5%, 93.3%, or 67.9% Orange-II after equilibration in the dark with the commercial ZnO structures, the 3D flower-like ZnO structure, or the mesoporous ZnO structures, respectively. The mesoporous ZnO structures showed superior
adsorption properties relative to the commercial ZnO structures, even though the 3D ZnO structures presented BET surface areas that were higher than those of the mesoporous ZnO structures. The speculated reason for the high adsorptivity of the mesoporous ZnO
nanostructures is that confined spaces and restricted environments of mesopore channels led to an increase in the concentration of
dye molecules in the pores, resulting in high adsorptivity of the mesoporous ZnO
nanostructures. The photocatalytic activities of the ZnO structures were evaluated by measuring the degradation rate of aqueous Orange-II solutions under light irradiation. Conduction band electrons (
ecb−) and valence band holes (
hvb+) were generated on the surfaces of the ZnO crystals upon illumination of the ZnO structures by light with an energy greater than the band gap energy. Holes can react with
water on the surfaces of the ZnO
nanostructures to form highly reactive
hydroxyl radicals (OH·), whereas oxygen acts as an
electron acceptor by forming a superoxide
radical anion (O
2−). The superoxide
radical anions further form
hydroxyl radicals, which can powerfully oxidize and degrade organic
dyes.
38Fig. 9(b) shows the changes in the concentration of an Orange-II solution containing 50 mg
catalyst under light irradiation (initial concentration of Orange-II
dye (
Ci): 5.0 × 10
−5 mol L
−1; 100 mL). In the absence of ZnO structures, the Orange-II concentration was almost constant during light irradiation of the solution, demonstrating the photostability of the
dye. The
dye concentration in the presence of the commercial ZnO samples decreased to 0.525C
i after light irradiation for 120 min, and the Orange-II was fully decomposed after light irradiation for 90 min in the presence of 3D flower-like ZnO structures or the mesoporous ZnO structures. In a previous study, 3D flower-like ZnO structures composed of nanoplates with {2
![[1 with combining macron]](https://www.rsc.org/images/entities/char_0031_0304.gif)
![[1 with combining macron]](https://www.rsc.org/images/entities/char_0031_0304.gif)
0} planar surfaces had photocatalytic activities superior than those of other ZnO structures.
36 The mesoporous ZnO had a better photocatalytic activity than the 3D flower-like ZnO structures, particularly in early
decomposition of
Orange II. Although the 3D structures had good structural features, such as thin nanoplates and active {2
![[1 with combining macron]](https://www.rsc.org/images/entities/char_0031_0304.gif)
![[1 with combining macron]](https://www.rsc.org/images/entities/char_0031_0304.gif)
0} surfaces,
36 the enhanced adsorptivity of the mesoporous ZnO
nanostructures supplemented the better photocatalytic activity. Our present study suggests that the mesoporous ZnO
nanostructures described here may be used as photocatalysts for organic pollutant removal during
water or environmental detoxification. Their enhanced
adsorption properties may also be applied to
drug delivery applications. The quasi-single crystalline
nanoparticles may potentially be suitable for use in
dye-sensitized solar cell (DSSC) anodes.
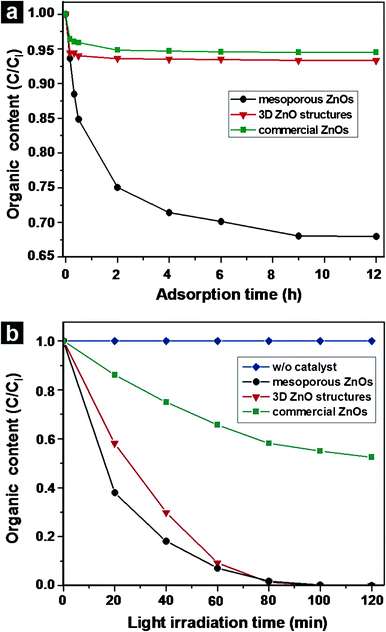 |
| | Fig. 9 (a) The normalized concentrations (calculated from the optical absorbance at 486 nm) of the 100 mL Orange-II solution (initial concentration (Ci): 5.0 × 10⁻⁵ M) in the presence of 50.0 mg mesoporous ZnO structures; with 50.0 mg 3D ZnO structures composed of nanoplates with {2![[1 with combining macron]](https://www.rsc.org/images/entities/char_0031_0304.gif) ![[1 with combining macron]](https://www.rsc.org/images/entities/char_0031_0304.gif) 0} planar surfaces; with 50.0 mg commercial ZnO structures as a function of the aging time in the dark. (b) The normalized concentrations of the 100 mL Orange-II solution without a catalyst; with 50.0 mg mesoporous ZnO structures; with 50.0 mg 3D ZnO structures; with 50.0 mg commercial ZnO structures as a function of the light irradiation time. 0} planar surfaces; with 50.0 mg commercial ZnO structures as a function of the aging time in the dark. (b) The normalized concentrations of the 100 mL Orange-II solution without a catalyst; with 50.0 mg mesoporous ZnO structures; with 50.0 mg 3D ZnO structures; with 50.0 mg commercial ZnO structures as a function of the light irradiation time. | |
4. Conclusions
We describe a method for synthesizing quasi-single crystal mesoporous ZnO nanostructuresvia a self-generated templating approach. The key feature of this synthetic strategy for quasi-single crystalline mesoporous ZnO nanostructures was that the carbonaceous nanotemplates were self-generated during the growth of the nanocomposites. During the reaction in the solution, ZnO growth and carbonization occurred, leading to formation of amorphous carbonaceous species (self-generated nanotemplates) within quasi-single crystalline ZnO structures. The ZnO–carbonaceous nanocomposites were converted to mesoporous ZnO nanostructures through combustion of the amorphous carbonaceous species (the template removal step). The adsorption properties and photocatalytic activity of the mesoporous ZnO structures were evaluated. The mesoporous ZnO structures showed adsorption properties superior to those of the commercial ZnO nanostructures and the 3D ZnO structures, even though the BET surface area of the 3D ZnO structures was higher than that of the mesoporous ZnO structures. The enhanced adsorptivity of the mesoporous ZnO nanostructures may supplement the high photocatalytic activity. The quasi-single crystal mesoporous ZnO nanostructures synthesized by this method may potentially be used in various applications, such as photocatalysis for water and environmental detoxification from organic pollutants, drug delivery, and DSSCs.
Acknowledgements
This work was supported by grants from the second phase BK21 program of the Ministry of Education of Korea and the Korea Science and Engineering Foundation (KOSEF) grant funded by the Korea government (MEST) (Grant No. 2011-0000360).
References
- Z. L. Wang, J. Phys.: Condens. Matter, 2004, 16, R829 CrossRef CAS.
- J. Zhang, L. Sun, J. Yin, H. Su, C. Liao and C. Yan, Chem. Mater., 2002, 14, 4172 CrossRef CAS.
- Q. Zhao, H. Z. Zhang, Y. W. Zhu, S. Q. Feng, X. C. Sun, J. Xu and D. P. Yu, Appl. Phys. Lett., 2005, 86, 203115 CrossRef.
- G. R. Li, C. R. Dawa, Q. Bu, X. H. Lu, Z. H. Ke, H. E. Hong, F. L. Zheng, C. Z. Yao, G. K. Liu and Y. X. Tong, J. Phys. Chem. C, 2007, 111, 1919 CAS.
- M. H. Huang, S. Mao, H. Feick, H. Yan, Y. Wu, H. Kind, E. Weber, R. Russo and P. Yang, Science, 2001, 292, 1897 CrossRef CAS.
- S. Cho, J.-W. Jang, J. Lee, J. S. Lee and K.-H. Lee, Nanoscale, 2010, 2, 2199 RSC.
- Z. R. Tian, J. A. Voigt, J. Liu, B. Mckenzie and M. J. Mcdermott, J. Am. Chem. Soc., 2002, 124, 12954 CrossRef CAS.
- S. Cho, S.-H. Jung and K.-H. Lee, J. Phys. Chem. C, 2008, 112, 12769 CAS.
- S. Cho, S. Kim, H.-J. Kim, B. R. Lee and K.-H. Lee, Langmuir, 2009, 25, 10223 CrossRef CAS.
- H. Zeng, W. Cai, P. Liu, X. Xu, H. Zhou, C. Klingshirn and H. Kalt, ACS Nano, 2008, 2, 1661 CrossRef CAS.
- H. Zeng, X. Xu, Y. Bando, U. K. Gautam, T. Zhai, X. Fang, B. Liu and D. Golberg, Adv. Funct. Mater., 2009, 19, 3165 CrossRef CAS.
- S. Cho, J.-W. Jang, S.-H. Jung, B. R. Lee, E. Oh and K.-H. Lee, Langmuir, 2009, 25, 3825 CrossRef CAS.
- H. Yu, Z. Zhang, M. Han, X. Hao and F. Zhu, J. Am. Chem. Soc., 2005, 127, 2378 CrossRef CAS.
- S. Cho, J.-W. Jang, A. Jung, J. Lee, J. S. Lee and K.-H. Lee, Langmuir, 2011, 27, 371 CrossRef CAS.
- B. Liu and H. C. Zeng, J. Am. Chem. Soc., 2004, 126, 16744 CrossRef CAS.
- Z. Y. Jiang, Z. X. Xie, X. H. Zhang, S. C. Lin, T. Xu, S. Y. Xie, R. B. Huang and L. S. Zheng, Adv. Mater., 2004, 16, 904 CrossRef CAS.
- S. Cho, S. Kim, D.-W. Jung and K.-H. Lee, Nanoscale, 2011, 3, 3841 RSC.
- S. Gao, H. Zhang, X. Wang, R. Deng, D. Sun and G. Zheng, J. Phys. Chem. B, 2006, 110, 15847 CrossRef CAS.
- C. Yan and D. Xue, J. Phys. Chem. B, 2006, 110, 11076 CrossRef CAS.
- B. Liu and H. C. Zeng, Chem. Mater., 2007, 19, 5824 CrossRef CAS.
- Z. Chen and L. Gao, Cryst. Growth Des., 2008, 8, 460 CAS.
- J. Yu and X. Yu, Environ. Sci. Technol., 2008, 42, 4902 CrossRef CAS.
- J. Yu, C. Li and S. Liu, J. Colloid Interface Sci., 2008, 326, 433 CrossRef CAS.
- D. Pradhan and K. T. Leung, J. Mater. Chem., 2009, 19, 4902 RSC.
- M. Agrawal, A. Pich, N. E. Zafeiropoulos, S. Gupta, J. Pionteck, F. Simon and M. Stamm, Chem. Mater., 2007, 19, 1845 CrossRef CAS.
- X. Wang, P. Hu, Y. Fangli and L. Yu, J. Phys. Chem. C, 2007, 111, 6706 CAS.
- H. Zhou, T. Fan and D. Zhang, Microporous Mesoporous Mater., 2007, 100, 322 CrossRef CAS.
- C. Yan and D. Xue, J. Phys. Chem. B, 2006, 110, 7102 CrossRef CAS.
- N. Leventis, N. Chandrasekaran, A. G. Sadekar, C. Sotiriou-Leventis and H. Lu, J. Am. Chem. Soc., 2009, 131, 4576 CrossRef CAS.
- N. Leventis, N. Chandrasekaran, A. G. Sadekar, S. Mulik and C. Sotiriou-Leventis, J. Mater. Chem., 2010, 20, 7456 RSC.
- A. M. Volosin, S. Sharma, C. Traverse, N. Newman and D.-K. Seo, J. Mater. Chem., 2011, 21, 13232 RSC.
- K. S. W. Sing, D. H. Everett, R. A. W. Haul, L. Moscou, R. A. Pierotti, J. Rouquerol and T. Siemiemewska, Pure Appl. Chem., 1985, 57, 603 CrossRef CAS.
- H. Zhang, X. Lv, Y. Li, Y. Wang and J. Li, ACS Nano, 2009, 4, 380 CrossRef.
- L. W. Zhang, H. B. Fu and Y. F. Zhu, Adv. Funct. Mater., 2008, 18, 2180 CrossRef CAS.
- Y. Wang, R. Shi, J. Lin and Y. Zhu, Energy Environ. Sci., 2011, 4, 2922 CAS.
- S. Cho, J.-W. Jang, J. Lee, J. S. Lee and K.-H. Lee, Langmuir, 2010, 26, 14255 CrossRef CAS.
- V. Houšková, V. Štengl, S. Bakardjieva, N. Murafa, A. Kalendová and F. Opluštil, J. Phys. Chem. A, 2007, 111, 4215 CrossRef.
- M. R. Hoffmann, S. T. Martin, W. Choi and D. W. Bahnemann, Chem. Rev., 1995, 95, 69 CrossRef CAS.
Footnote |
| † Electronic Supplementary Information (ESI): UV-vis absorption spectrum of powders synthesized from the reaction of an aqueous solution containing 0.01 M zinc nitrate hexahydrate, 0.01 M HMT, and 0.002 M L(+)-ascorbic acid at 180 °C for 30 min (Figure S1). UV-vis absorption spectrum of the powder obtained by calcination of as-prepared ZnO-carbonaceous species nanocomposites at 600 °C for 2 h in air (Figure S2). |
|
| This journal is © The Royal Society of Chemistry 2012 |
Click here to see how this site uses Cookies. View our privacy policy here. ![[1 with combining macron]](https://www.rsc.org/images/entities/char_0031_0304.gif)
![[1 with combining macron]](https://www.rsc.org/images/entities/char_0031_0304.gif) 0} planar surfaces (benchmark materials) even though the BET surface area of the 3D ZnO structures was larger than that of the mesoporous ZnO structures. The quasi-single crystal mesoporous ZnO structures exhibited a high photocatalytic activity.
0} planar surfaces (benchmark materials) even though the BET surface area of the 3D ZnO structures was larger than that of the mesoporous ZnO structures. The quasi-single crystal mesoporous ZnO structures exhibited a high photocatalytic activity.

![[double bond, length as m-dash]](https://www.rsc.org/images/entities/char_e001.gif) O) groups in vitamin C appeared between 1680 cm−1 and 1740 cm−1. Broad peaks over 750–2000 cm−1 were attributed to ascorbic acid, HMT, or their derivatives. An O–H stretching band at 3475 cm−1 indicated the presence of ascorbic acid or its derivatives, as well as the surface –OH groups of ZnO. Quantitative analysis using the elemental analyzer revealed that the nanocomposites contained 4.97 wt.% carbon and 1.09 wt.% nitrogen. Therefore, the amorphous regions comprised carbonaceous species, ascorbic acid, and HMT or their derivatives. The synthesized nanostructures were therefore found to be ZnO–carbonaceous nanocomposites.
O) groups in vitamin C appeared between 1680 cm−1 and 1740 cm−1. Broad peaks over 750–2000 cm−1 were attributed to ascorbic acid, HMT, or their derivatives. An O–H stretching band at 3475 cm−1 indicated the presence of ascorbic acid or its derivatives, as well as the surface –OH groups of ZnO. Quantitative analysis using the elemental analyzer revealed that the nanocomposites contained 4.97 wt.% carbon and 1.09 wt.% nitrogen. Therefore, the amorphous regions comprised carbonaceous species, ascorbic acid, and HMT or their derivatives. The synthesized nanostructures were therefore found to be ZnO–carbonaceous nanocomposites.


![[1 with combining macron]](https://www.rsc.org/images/entities/char_0031_0304.gif)
![[1 with combining macron]](https://www.rsc.org/images/entities/char_0031_0304.gif) 0} planar surfaces.36 A 50 mg sample of each ZnO powder was transferred to 100 mL of a 5.0 × 10⁻⁵ M Orange-II solution. The suspensions were aged in the dark with stirring. The concentration of Orange-II in the solutions was monitored as a function of time. Under conditions in which the Lambert–Beer law was applicable, the concentration c of the absorbing component is proportional to the absorbance A as follows:37
0} planar surfaces.36 A 50 mg sample of each ZnO powder was transferred to 100 mL of a 5.0 × 10⁻⁵ M Orange-II solution. The suspensions were aged in the dark with stirring. The concentration of Orange-II in the solutions was monitored as a function of time. Under conditions in which the Lambert–Beer law was applicable, the concentration c of the absorbing component is proportional to the absorbance A as follows:37![[1 with combining macron]](https://www.rsc.org/images/entities/char_0031_0304.gif)
![[1 with combining macron]](https://www.rsc.org/images/entities/char_0031_0304.gif) 0} planar surfaces had photocatalytic activities superior than those of other ZnO structures.36 The mesoporous ZnO had a better photocatalytic activity than the 3D flower-like ZnO structures, particularly in early decomposition of Orange II. Although the 3D structures had good structural features, such as thin nanoplates and active {2
0} planar surfaces had photocatalytic activities superior than those of other ZnO structures.36 The mesoporous ZnO had a better photocatalytic activity than the 3D flower-like ZnO structures, particularly in early decomposition of Orange II. Although the 3D structures had good structural features, such as thin nanoplates and active {2![[1 with combining macron]](https://www.rsc.org/images/entities/char_0031_0304.gif)
![[1 with combining macron]](https://www.rsc.org/images/entities/char_0031_0304.gif) 0} surfaces,36 the enhanced adsorptivity of the mesoporous ZnO nanostructures supplemented the better photocatalytic activity. Our present study suggests that the mesoporous ZnO nanostructures described here may be used as photocatalysts for organic pollutant removal during water or environmental detoxification. Their enhanced adsorption properties may also be applied to drug delivery applications. The quasi-single crystalline nanoparticles may potentially be suitable for use in dye-sensitized solar cell (DSSC) anodes.
0} surfaces,36 the enhanced adsorptivity of the mesoporous ZnO nanostructures supplemented the better photocatalytic activity. Our present study suggests that the mesoporous ZnO nanostructures described here may be used as photocatalysts for organic pollutant removal during water or environmental detoxification. Their enhanced adsorption properties may also be applied to drug delivery applications. The quasi-single crystalline nanoparticles may potentially be suitable for use in dye-sensitized solar cell (DSSC) anodes.

![[1 with combining macron]](https://www.rsc.org/images/entities/char_0031_0304.gif)
![[1 with combining macron]](https://www.rsc.org/images/entities/char_0031_0304.gif) 0} planar surfaces; with 50.0 mg commercial ZnO structures as a function of the aging time in the dark. (b) The normalized concentrations of the 100 mL Orange-II solution without a catalyst; with 50.0 mg mesoporous ZnO structures; with 50.0 mg 3D ZnO structures; with 50.0 mg commercial ZnO structures as a function of the light irradiation time.
0} planar surfaces; with 50.0 mg commercial ZnO structures as a function of the aging time in the dark. (b) The normalized concentrations of the 100 mL Orange-II solution without a catalyst; with 50.0 mg mesoporous ZnO structures; with 50.0 mg 3D ZnO structures; with 50.0 mg commercial ZnO structures as a function of the light irradiation time.