Hydration of ions and salt crystallization in liquid phase coexistent with ice at temperature below eutectic point†
Makoto
Harada
a,
Yuiko
Tasaki
b,
Hui
Qu
a and
Tetsuo
Okada
*a
aDepartment of Chemistry, Tokyo Institute of Chemistry, Meguro-ku, Tokyo, 152-8551, Japan. E-mail: tokada@chem.titech.ac.jp
bResearch Institute of Environmental Management Technology, National Institute of Advanced Industrial Science and Technology, Tsukuba, 305-8569, Japan
First published on 8th November 2011
Abstract
X-ray absorption fine structure (XAFS) clearly indicates the existence of hydrated Br− in a frozen aqueous RbBr solution at the temperatures lower than the eutectic point (teu) of the system. The relative population of hydrated Br− decreases with increasing concentration of RbBr in an original solution, and Br− consisting of the RbBr crystal lattice becomes dominant at the higher concentration of RbBr. This implies the existence of the liquid phase at the subeutectic temperatures. Continuous XAFS measurements over ca 6 h detect the progress of the RbBr crystallization. The analysis based on the populations of hydrated Br− and Br− in the RbBr crystal suggests that the ions on the surface of the salt crystal are partially hydrated. These strongly imply that the metastable liquid phase is in contact with salt crystals at the temperature below teu. Since impurities such as a salt are accumulated along the grain boundaries of ice crystals, the metastable liquid phase should thus be present together with the accumulated salt crystals.
Introduction
A frozen aqueous electrolyte is usually interpreted on the basis of the thermodynamics such as the phase diagram of the system. While at least two solid phases, i.e. ice and a salt crystal, coexist at the temperatures below the eutectic point (teu) of the system, one of these is liquefied when the temperature increases past teu. When an original unfrozen solution is relatively diluted, salt crystals are present in an ice matrix at the temperature below teu and are dissolved into concentrated aqueous electrolytes when the temperature exceeds teu. Since such doped ice plays important roles in the global environment, e.g. involvements of sea salts in glacier,1 cloud formation,2 the circulation of nitrogen-containing compounds on the earth,3,4ozone layer depletion etc, it has attracted much interest from a variety of scientific communities.The liquid phase emerging at the temperatures above teu can thus be basically understood by thermodynamics. In contrast, it is known that the liquid phase coexists with ice even in the temperature range, where the phase diagram does not predict the existence of the former. An intriguing example is the quasi liquid layer (QLL) formed on the surface of water ice below its melting point.5–8 Although various methods have given evidence of the formation of the QLL on the ice surface, its layer thickness and temperature dependence are still debated. Electrolyte-doped ice also contains the liquid phase even at the temperature below teu. This liquid layer is found not only on the surface but also in the interior of doped ice. Koop et al.9 showed the existence of the liquid phase in NaCl-doped ice by differential scanning calorimetry. The precipitation of NaCl from the metastable liquid phase was detected at ca 239 K, which is ca 13 °C lower than teu of the NaCl/water system. Cho et al.10 determined the volume fraction of the metastable liquid phase by 1H and 23Na NMR, and suggested that this quasi brine layer plays an important role as the microreactor in atmospheric chemistry.
We evaluated, in our previous work, the eutectic transition with the local structure of Br− as the probe.11 X-ray absorption fine structure (XAFS) clearly detected the drastic structural change from Br− in the RbBr crystal lattice to hydrated one past the eutectic temperature (teu = −12.7 °C) of the RbBr/water system. However, when the concentration of RbBr in an original solution is low (e.g. in the lower mM range), the hydrated Br− was clearly detected even below teu. In the present work, the hydrated ions present at the temperature below teu are characterized through the XAFS analyses of Br− in more detail. In addition, during this study, we have detected the crystallization of RbBr from the liquid phase coexistent with ice. The elucidation of these phenomena gives a further insight into chemistry of ice.
Experimental
The design of the apparatus used for XAFS measurements was basically the same as previously reported.11 The temperature of a sample was maintained on a Peltier array controlled by a Cell System Peltier controller Model TDC-2030R. The temperature of ice was monitored with a platinum resistance thermometer. The temperature fluctuation was smaller than ±0.05 °C. The reversed side of the Peltier array was cooled by a chiller.An ice specimen prepared on the copper stage pasted on the Peltier array was shielded from the atmosphere by an acrylic cover to prevent the sublimation of ice and frost adhesion on its surface. The atmosphere over the ice sample was purged with He. The incident X-ray passed through a PET film window and irradiated the ice specimen. The fluorescence X-ray emitted from the sample was detected by a solid-state detector installed just outside the thin Kapton film window.
An appropriate amount of an aqueous RbBr solution prepared in MilliQ water was frozen on the Peltier array set to ca −20 °C. After the complete freezing of the solution, an additional aliquot of the same solution was poured over the ice layer. This procedure was repeated several times until the thickness of ice became ca 5 mm. For comparison purpose, samples frozen in liquid nitrogen were also examined. After complete freezing, an ice sample was transferred on the Peltier array kept at ca −20 °C. After the temperature of the sample became ca −20 °C, the XAFS measurements were started. The XAFS spectra at the Br K-edge (13.477 keV) were measured by at the beamline 12C in KEK (Tsukuba, Japan).
The normalized XAFS interference function, χ(κ), defined as
 | (1) |
 | (2) |
Small angle X-ray scattering (SAXS) was measured at the BL-10C of KEK (Tsukuba, Japan). The wavelength of X-ray was 0.1488 nm. A position sensitive proportional counter was used as the detector. The distance between a sample and the detector was corrected by measuring SAXS of a standard sample of chicken tendon collagen. An appropriate Al plate was set just in front of the detector as the attenuator. The thickness of the attenuator was adjusted so that the signal rate was ca 104 counts per second.
Doped ice samples were prepared in a homemade Cu cell having the Kapton windows of 7.5 μm thickness in both sides. A sample solution was held in the space surrounded by a Cu spacer of 2 mm thickness and the Kapton windows. The entire cell was immersed in liquid nitrogen to allow the freezing of the sample solution and then transferred into a small ethanol bath thermostated on a Peltier array. The atmosphere surrounding the sample was purged by He. The temperature of the Peltier array was controlled by the same controller as used for XAFS experiments. The temperature of ethanol was monitored with a Pt resistance thermometer. The scattering intensity was corrected in terms of that measured with the pure ice sample as the background. The final SAXS curve was obtained as a function of s (= 2sinθ/λ).
X-ray diffraction was measured with SmartLab (RIGAKU). A sample was sealed in a quarts capillary and its temperature was controlled by a thermostated nitrogen jet.
Results and discussion
Detection of the metastable liquid phase at the temperature below teu by XAFS
Fig. 1 shows XAFS spectra at the Br-K edge obtained with 0.5, 1, 5, 10 and 50 mM RbBr-doped ice samples prepared on the Peltier array at ca −20 °C. The concentration of RbBr (CRbBr) in an unfrozen original solution is reported throughout this paper. The spectra for hydrated Br− and Br− in the RbBr crystal are also depicted in this figure for comparison. The analysis of the spectrum for the hydrated Br− with Br–O as the model gave the coordination distance and the coordination number, rBr–O = 3.24 Å and N = 6, respectively. The oscillation patterns for Br− in the RbBr crystal were simulated on the basis of the NaCl–type crystals of RbBr with the lattice constant of 6.88 Å.14 Figure S1† compares the experimental spectrum for RbBr with simulated ones. It was assumed that the absorbing Br− is centered in the 3 × 3 × 3 unit lattice, which is surrounded by additional 6 Br− ions as illustrated in the figure. The oscillation phase and intensities of the experimental spectrum are basically explained by the simulation, albeit there are minor differences.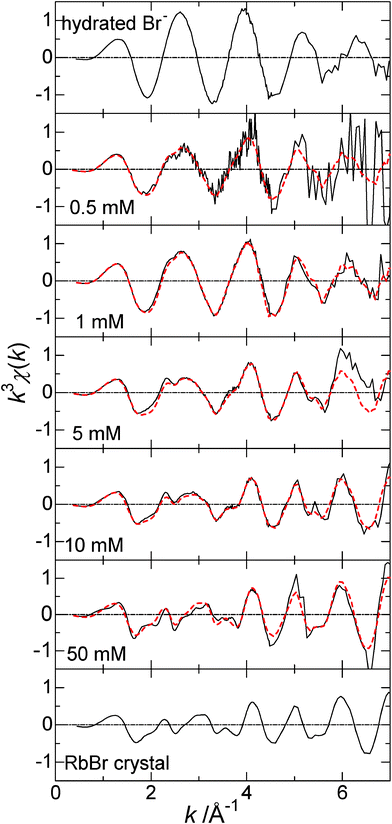 | ||
| Fig. 1 XAFS χ spectra at the Br–K edge for hydrated Br−, 0.5, 1, 5, 10, and 50 mM RbBr-doped ice, and the RbBr crystal. The temperature was kept lower than the teu for dope ice samples. Red dashed curves represent the fittings based on Eqn (3). The details are given in the text. | ||
The oscillation frequency of the spectra for 0.5 and 1 mM RbBr-doped ice is similar to that for hydrated Br−, suggesting strong influence of coordinating water molecules despite the measurements at the temperature lower than teu. In contrast, the contribution from Br− in the RbBr crystal lattice to the spectra becomes more significant as CRbBr increases. However, the spectra for 0.5–10 mM RbBr-doped ice exhibit the features of both hydrated Br− and Br− in the RbBr solid. Usual XAFS fitting was carried out for these spectra with Br–O as the model as shown in Figure S2.† The spectra for 0.5 and 1 mM RbBr-doped ice were well explained by this model. The fitting parameters are rBr–O = 3.00 Å, N = 4.73, and σ = 0.15 Å for 0.5 mM and rBr–O = 2.91 Å, N = 4.01, and σ = 0.15 Å for 1 mM RbBr. The Br–O distance is slightly smaller than that of hydrated Br− because the coexistent the RbBr crystal affects the χspectrum. Also, the coordination numbers are obviously smaller than that for hydrated Br− for the same reason. Since two different oscillation patterns are superimposed in the spectrum for doped ice, precise structural information cannot be extracted by the usual fitting with the XAFS parameters in most cases.
A XAFS spectrum can be represented by a linear combination of limiting spectra when two or more scattering paths are superimposed.11,15,16 This approach assumes that individual scattering paths are independent and are not affected by the other coexistent species. The previous studies have strongly suggested that the coordination distance between Br− and water molecules is always constant and is not influenced by its circumstance. Even when some water molecules are removed off from the first coordination shell of Br−e.g. by the strong electrostatic interaction with an ion-exchange site or an ionic group of a surfactant molecule forming a micelle, the rest of water molecules remain at the same position (rBr–O = ca 3.2 Å). In such cases, the oscillation intensity of the XAFS spectrum coming from the Br–O (in water) scattering path decreases, whereas the oscillation phase is not changed. Thus, this approach is particularly reliable when the hydrated structure is involved.
In the present case, the complex spectra shown in Fig. 1 should have the features of both hydrated Br− and that in the salt crystal lattice. However, the salt crystal phase should be identified before the analysis based on the linear combination is applied. Various hydrates can be precipitated from aqueous electrolytes; NaBr·2H2O is a well known example of bromide salts.17,18 According to the crystal structures of NaBr·2H2O, the distance between Br− and the oxygen atom in water molecule is determined to be 3.387, 3.586, 3.339, and 3.366 Å.18 These distances are slightly longer than the corresponding distance for hydrated Br− and, thus, the oscillation patterns of the XAFS spectrum for NaBr·2H2O are expected to be different from those for hydrated Br−, albeit no relevant data are found in the literature. The X-ray diffraction of the frozen aqueous RbBr solution was studied to identify the salt crystal phase deposited from aqueous RbBr solutions. Fig. 2 shows the diffraction pattern of a frozen aqueous RbBr solution at −25 °C. The peaks were identified by the calculations for the Ih ice and anhydrous RbBr crystals. The diffraction angles identified for anhydrous RbBr in Fig. 2 agree well with those from authentic anhydrous RbBr shown in Figure S3.† All of the peaks thus come from these two crystals, and no other peaks are observed, strongly indicating that anhydrous RbBr rather than the hydrates is precipitated upon freezing its aqueous solution.
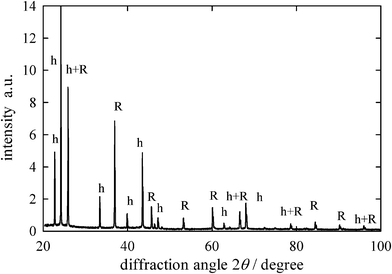 | ||
| Fig. 2 X-ray diffraction patterns from frozen aqueous 1 M RbBr at −25 °C. Diffraction peak identification, h=ice Ih and R=anhydrous RbBr. | ||
Thus, RbBr-doped ice is basically composed of two solid phase, i.e. ice and RbBr anhydrous at the temperature below teu, and the latter is dissolved into the liquid phase when the temperature becomes higher than teu. The hydrated Br− always has the same coordination distance as that in a bulk aqueous solution as noted above. The XAFS spectra shown in Fig. 1 are represented by two coexistent structures, i.e. hydrated Br− and Br− in the anhydrous RbBr crystal.
| χ = αχhyd + βχcryst | (3) |
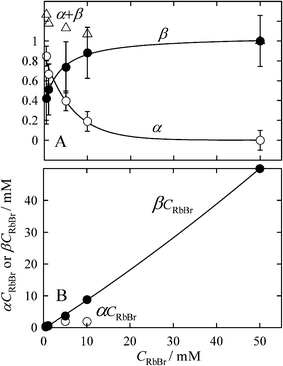 | ||
| Fig. 3 Changes in the α and β coefficients and their related values on CRbBr in doped ice. A, Changes in α and β coefficients and their sum. B, Changes in α CRbBr and β CRbBr, which correspond to the moles of hydrated Br− and Br− in the RbBr crystal in a unit volume. | ||
The sum of α and β values exceeds unity for CRbBr ≤ 10 mM. We can see the clear trend that (α + β) value approaches unity with increasing CRbBr, albeit the standard deviations for these parameters are relatively large. The fact of (α + β) > 1 is related to the surface hydration of the crystal nuclei. The molecular dynamics simulations have indicated that the ions on the surface of small crystal nuclei are partially hydrated on the surface of alkali halide crystals at the room temperature19 and at the temperature of water evaporation.20 Since the exothermic ionic hydration more preferably occurs at lower temperatures, ions on the surface of salt nuclei are also hydrated in the metastable liquid phase.21
Since the relative population of surface atoms increases with decreasing the size of a crystal, effects of surface hydration should more clearly be seen in the XAFS spectra of smaller crystals. The size of the salt crystal nuclei was determined by small angle X-ray scattering (SAXS) for the further discussion of this aspect. The X-ray scattering from the sample prepared by freezing an aqueous RbBr in liquid nitrogen was measured at −20 °C. Since the X-ray scattering profiles showed simple decays in the s space, the average radius of gyration of the salt crystals (Rg) was determined on the basis of the Guinier plots in the range of s between 0.008 and 0.025 nm−1. The Rg values were determined to be 3.23 nm for CRbBr = 3 mM and 3.47 nm for CRbBr = 1 mM. This suggests that the size of the crystals is independent of CRbBr at least in this concentration range. The surface ions comprise ca 50% of the total ions involved in a cubic crystal and 60% in a spherical crystal, assuming the length of the crystal is represented by 2 Rg. Thus, if the surface hydration occurs, its effect should be reflected in the present XAFS spectra.
Figure 1S† compares the XAFS spectra simulated for the surface and inner Br− in RbBr crystal. The intensity of the spectrum for the surface Br− is lower than that of the inner ion by ca 10–20%. As shown above, the surface ions comprise ca 50% of the total ions in the crystal of several nm in size. For such crystals, the β value is thus always slightly smaller than unity (β = ca 0.9). In contrast, the surface ions can undergo hydration, which causes an increase in α. Because various approaches have indicated that the most probable hydration number for Br− is six,15 the α value is equal to 0.33 when two water molecules, for example, interact with a surface Br− and can be larger if more water molecules participate in the hydration. Thus, the sum of α and β values can be more than unity when the surface hydration in fine crystals occurs; in other words, the (α+ β) value more than unity suggests the hydration of ions on the crystal surface as well as the formation of fine crystals.
The amounts of hydrated Br− and Br− in the RbBr crystal in a unit volume of doped ice are represented by α CRbBr and β CRbBr, respectively. As shown in Fig. 3B, the amount of hydrated Br− (αCRbBr) first increases with increasing CRbBr and then becomes almost constant. In contrast, βCRbBr almost linearly increases with CRbBr, suggesting that most of Br− ions added to the system are accommodated in the RbBr crystal for higher CRbBr. Since the α values involve the contribution from the surface hydration of the salt crystal, the actual amount of hydrated Br− is slightly smaller than that predicted from the αCRbBr values.
At the low CRbBr, the ions remain hydrated at the temperatures even below teu. The existence of the liquid phase at the temperatures below teu has been indicated on the basis of DSC or NMR measurements.9,10 Under such conditions, the liquid phase is in a metastable state, which should be changed into thermodynamically stable state, i.e. ice and salt, when the salt crystallization is facilitated by sufficient cooling. The freezing in liquid nitrogen was studied to assess this aspect. Interestingly, hydrated Br− was still detected even when the solution is frozen in liquid nitrogen; e.g. the α value for 1 mM RbBr at −20 °C was 0.67 for ice prepared on the Peltier array and 0.50 for that prepared in liquid nitrogen. Of importance is thus that sufficient cooling does not necessarily facilitate the complete dehydration of ions and in turn salt crystallization.
The eutectic concentration of RbBr (Ceu) was determined to be 1.7 M.11 Assuming that the concentration of RbBr in the metastable liquid is also 1.7 M (Ceu should be a good measure for the RbBr concentration of the metastable liquid, though the actual concentration therein may be slightly higher), we can estimate the volume of the metastable liquid phase. The ratio of αCRbBr to Ceu corresponds to the volume fraction of the metastable liquid in the entire RbBr-doped ice. Fig. 4 shows the dependence of the volume fraction of the liquid phase on CRbBr. The relative volume increases from ca 0.01% to ca 0.1% at CRbBr = 5–10 mM and then decreases to almost zero with increasing CRbBr.
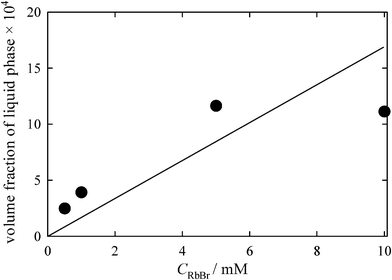 | ||
| Fig. 4 Change in the liquid fraction with CRbBr. The concentration of RbBr in the metastable liquid phase was assumed to be equal to Ceu. The solid line represents the theoretical prediction calculated assuming the ideal solution. | ||
Cho et al.10 discussed the fraction of the liquid phase based on the thermodynamics of the ideal solution. Although the deviation from the ideality becomes marked around the eutectic point, it must be interesting to compare the values calculated by this theory with the liquid phase fraction depicted in Fig. 4. The solid line in Fig. 4 shows the prediction by the ideal solution assumption. The calculation almost predicts the liquid fractions at low CRbBr. Since the present study suggests that the salt is almost completely precipitated at higher CRbBr, the deviation from the line drawn in Fig. 4 becomes marked with increasing CRbBr. In addition, the liquid fraction strongly depends on the cooling history. As noted above, when a solution is frozen at lower temperature, the slightly lower α value was detected. Controlling the freezing temperature should be carried out at the next stage, albeit the difficulty is expected to keep the temperature homogeneity of a bulk sample.
Crystallization of RbBr in the metastable liquid phase
The continuous XAFS measurements of doped ice over ca 6 h have succeeded in the detection ofRbBr crystallization. Fig. 5 shows the time change in the XAFS spectrum for 0.5 mM RbBr-doped ice at −19.2 °C. As stated above, the spectrum measured just after the sample preparation has the feature of that for hydrated Br−. However, the effect of the RbBr crystal becomes more obvious with time. To more clearly demonstrate this transition, the time changes of the α and β coefficients were determined as shown in Fig. 6. The α value becomes smaller with time; it is initially 0.85 but decreases to 0.38 ca 6 h after the preparation of the ice sample. In contrast, the β value becomes larger with time; the final value was almost twice as large as the initial value.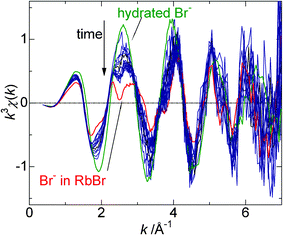 | ||
| Fig. 5 Change in the XAFS spectra for 0.5 mM RbBr-doped ice with elapsed time after sample preparation. The spectra for hydrated Br− and Br− in the RbBr crystal are depicted for comparison. | ||
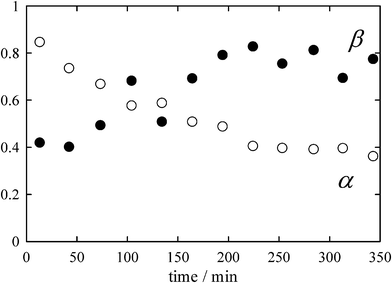 | ||
| Fig. 6 Time changes in the α and β coefficients determined from the spectra shown in Fig. 3. | ||
Since effects of the RbBr salt crystal are always seen in the XAFS spectra, salt crystal nuclei should be formed even in 0.5 mM RbBr-doped ice. As the ice crystals grow, both the salt crystal nuclei and liquid fractions are expelled from the ice crystal phase and are condensed along the grain boundaries. The salt crystal nuclei are therefore in contact with the metastable liquid phase in doped ice at the temperatures lower than teu. This situation should allow the long-term progress of the salt crystal growth in the metastable liquid phase. Our previous work has indicated that the liquid phases are developed in the discrete sites located along the grain boundaries in an ice matrix.22 Fluorescence coming from the liquid inclusions was detected as discrete spots rather than continuous boundaries by a confocal fluorescence microscope in this work. This strongly suggests that the accumulation of the salt crystals and metastable liquid phase occurs not along the entire grain boundaries but at particular sites.
Hence, XAFS is an efficient probe for the detection of the metastable liquid phase under subeutectic conditions. The analysis proposed in this paper has allows us to determine the volume of liquid fractions and to detect the surface hydration of a salt crystal. Since we can probe the interface by grazing angle incidence of X-ray, the ionic hydration on the single crystal surface is worth studying to elucidate directly the crystal surface hydration. In addition, the present study has revealed that the nanometre-sized salt crystals are in contact with the liquid phase when a diluted electrolyte is frozen. Although the presence of the liquid fraction in a frozen electrolyte has been pointed out on the basis of various probes, its physical features have not been known. The results of this study have thus indicated the coexistence of the crystals with the metastable liquid phase possibly along the grain boundaries rather than their separate depositions.
Acknowledgements
The authors thank Professors Nojima and Ozeki for their help in the SAXS and X-ray diffraction measurements and data analyses. This work has been partly supported by a Grant-in-Aid from the Japan Society for the Promotion of Science (JSPS) and by SENTAN from the Japan Science and Technology Agency (JST). This work was performed under the approval of Photon Factory Advisory Committee (Proposal Nos. 2010G123 and 2010P007).References
- D. Cullen and J. Baker, J. Glaciol, 2000, 46, 703–706 Search PubMed.
- B. J. Murray and A. K. Bertram, Phys. Chem. Phys. Chem., 2006, 8, 186–192 Search PubMed.
- C. Anastasio and L. Chu, Environ. Sci. Technol., 2009, 43, 1108–1114 CrossRef CAS.
- N. Takenaka and H. Bandow, J. Phys. Chem. A, 2007, 111, 8780–8786 CrossRef CAS.
- V. Sadtchenko and G. E. E wing, Can. J. Phys., 2003, 81, 333–341 CrossRef CAS.
- G. E. Ewing, J. Phys. Chem. B, 2004, 108, 15953–15961 CrossRef CAS.
- C. S.Boxe and A. Saiz-Lopez, Atmos. Chem. Phys., 2008, 8, 4855–4864 CAS.
- Y. Tasaki and T. Okada, J. Phys. Chem. C, 2008, 112, 2618–2623 CrossRef CAS.
- T. Koop, A. Kapilashrami, L. T.Molina and M. J.Molina, J. Geophys. Res., 2000, 105, 26393–26402 CrossRef CAS.
- H. Cho, P. B. Shepson, L. A. Barrie, J. P. Cowin and R. Zaveri, J. Phys. Chem. B, 2002, 106, 11226–11232 CrossRef CAS.
- Y. Tasaki, M. Harada and T. Okada, J. Phys. Chem. C, 2010, 114, 12573–12579 CrossRef CAS.
- B. K.Teo, XAFS: Basic Principles and Data Analysis, Anonymous. Spinger-Verlag, Berlin, 1986 Search PubMed.
- A. L.Ankudinov, C. E. Bouldin, J. J.Rehr, J. Sims and H. Hung, Phys. Rev. B: Condens. Matter, 2002, 65, 104107 CrossRef.
- Powder diffraction file, Ed. Joint Committee on Powder Diffraction Standards, JCPDS-International Centre for Diffraction Data, Swarthmore, 1965, Sets 6-10..
- T. Okada and M. Harada, Anal. Chem., 2004, 76, 4564–4571 CrossRef CAS.
- M. Harada, H. Satou and T. Okada, J. Phys. Chem. B, 2007, 111, 12136–12140 CrossRef CAS.
- W. Haaf and G. B.Garpenter, Acta Crystallogr., 1964, 17, 730–732 CrossRef CAS.
- J. Tegenfeldt, R. Tellgren, B. Pedersen and L. Olovsson, Acta Crystallogr., Sect. B: Struct. Crystallogr. Cryst. Chem., 1979, B35, 1679–1682 CrossRef CAS.
- H. Du and J. D. Miller, J. Phys. Chem. C, 2007, 111, 10013–10022 CrossRef CAS.
- M. Mucha and P. Jungwirth, J. Phys. Chem. B, 2003, 107, 8271–8274 CrossRef CAS.
- Y. Marcus, Ion Solvation, John Wiley, Chichester, 1985 Search PubMed.
- T. Hashimoto, Y. Tasaki, M. Harada and T. Okada, Anal. Chem., 2011, 83, 3950–3956 CrossRef CAS.
Footnote |
| † Electronic Supplementary Information (ESI) available. See DOI: 10.1039/c1ra00801c/ |
| This journal is © The Royal Society of Chemistry 2012 |
