Green controllable synthesis of silver nanomaterials on graphene oxide sheets via spontaneous reduction
Xiansong
Wang†
,
Peng
Huang†
,
Lili
Feng
,
Meng
He
,
Shouwu
Guo
,
Guangxia
Shen
* and
Daxiang
Cui
*
National Key Laboratory of Nano/Micro Fabrication Technology, Key Laboratory for Thin Film and Microfabrication of Ministry of Education, Institute of Micro-Nano Science and Technology, Shanghai Jiao Tong University, Shanghai 200240, China. E-mail: dxcui@sjtu.edu.cn (D. Cui); gxshen@sjtu.edu.cn (G. Shen); Fax: +86-2134206886
First published on 14th February 2012
Abstract
Silver nanoparticles, nanocubes and dendrites were controllably synthesized on graphene oxide (GO) sheets by use of GO as substrates and reducing agents combined with different concentrations of silver ions, sampling orders and different reaction times at room temperature. The prepared GO–silver hybrids were characterized by transmission and scanning electron microscopy, atomic force microscopy, energy dispersive spectroscopy, ultraviolet-visible spectroscopy, zeta potential, and X-ray diffraction. Moreover, the GO–silver hybrids displayed a singular remarkable surface-enhanced Raman scattering effect. The intensity increase can be adjusted by changing the concentration of the silver ions in the reaction solution.
1. Introduction
Metal nanomaterials (MNs) have received much attention because of their unique physical and chemical properties, and their important applications in the areas of photography, catalysis, photonics, optoelectronics, biomedicine and surface-enhanced Raman scattering (SERS).1–3 So far, MNs have been prepared by physical and chemical methods. The chemical approaches mainly include chemical reduction, electrochemical techniques, and photochemical reduction.4 Among these methods, most of them need reducing agents and abundant surfactants.5 Therefore, the development of a green and sustainable chemical methodology without any reducing agents or surfactants for the controlled synthesis of MNs remains a big challenge.Over the past decade, a unique property of carbon nanotubes (CNTs) was reported to self-reduce aqueous metal ions without any chemical reductants and surfactants, showing a one-pot solution-phase green way of synthesizing hybrids of MNs and CNTs.6–9 In those reactions, CNTs play dual roles as substrates as well as reducing agents. Recently, the copper–carbon substrate of a transmission electron microscopy (TEM) grid reacted with aqueous silver nitrate solution within minutes to yield spectacular tree-like silver dendrites, without using any added capping or reducing reagents.10 The above facts suggests that the carbon-based nanomaterials such as fullerene, carbon nanohorns, graphene and their derivatives may also be used as reducers to synthesize MNs. This method would open new avenues in the field of MN synthesis.
Graphene oxide (GO), a well-known layer-structure carbon-based nanomaterial containing hydroxyl and epoxide functional groups on the two accessible sides and carboxylic groups at the edges, has been actively investigated to build new composite materials.11–14 So far, GO has been developed as a burgeoning support to disperse and stabilize metal, metal oxide and semiconductor nanomaterials,15–19 such as Ag, Au, Pt, Pd, ZnO, TiO2, Co3O4, Fe3O4, CdS, ZnS, etc. Those hybrid materials display novel catalytic, magnetic, or optoelectronic properties.20 According to reports,15 the strategies of fabricating the GO-based hybrid materials mainly include: (1) the deposit method;20 (2) in situ synthesis method.21 In the first method, the as-prepared nanomaterials were deposited onto GO sheets by physical absorption, electrostatic binding, or charge transfer interactions.22 The size of nanomaterials can be controlled and fine tuned.20 However, it often requires time-consuming and elaborate steps and limited progress has been made for high-yield production.21 In the second method, the nanomaterials were obtained from the in situ reduction of metallic salts on GO sheets by covalent bonds. This synthesis route is simple and effective for large-scale production, but it provides poor control over the particle size and morphology, and the properties of the GO-based hybrid materials.23 Therefore, further developments of an in situ controllable synthesis method for GO-based hybrid materials is desirable.
Herein, we report a one-pot solution-phase green synthetic method to prepare silver nanoparticles, nanocubes and dendrites on GO sheets by use of the functional groups (such as hydroxyl) of GO as reducing reagent at room temperature. The simple in situ reaction involves GO and metal salts in water with a step-wise change of metal ions and GO concentration. The fundamental chemistry of our approach is the similar to that in recent report (i.e., direct redox reaction between metal ions and CNTs).8 Nonetheless, the current approach was developed to synthesize MNs with better control of sizes and shapes. Also the simplicity allows large-scale production. In this study, we selected silver nanomaterials as the research target, and using AgNO3 and GO as model compounds to prepare in situ silver nanoparticles, nanocubes and dendrites on GO sheets.
2. Experimental section
2.1 Synthesis of the GO–Ag hybrids
Water soluble GO was prepared by oxidizing graphite according to the modified Hummers method24 and our previous reports.25–27 We prepared the aqueous solution of the GO with a concentration of 0.50 mg mL−1, stored at room temperature on a lab bench. Typically, the GO–Ag hybrids were prepared according to the following two different strategies: (I) the aqueous solution of AgNO3 (10 mM) was gradually added to 5 mL of an aqueous solution of GO (0.5 mg mL−1), by 1 mL per time for five times, while under vigorously stirring at room temperature for 10 min. Then the mixed reaction solution was kept static under ambient conditions for aging. At different reaction times, silver nanomaterials with different sizes and shapes could be obtained. (II) 5 mL of an aqueous solution of AgNO3 (10 mM) was added to 5 mL of an aqueous solution of GO (0.5 mg mL−1) with vigorously stirring at room temperature. Then the mixed reaction solution was kept static under ambient conditions for aging. The resulting mixture was then separated from the solution by centrifugation at 6000 rpm for 20 min and washed with ultrapure water twice to remove residual Ag+.To investigate the influence and function of GO on the formation of silver nanomaterials, a control experiment was carried out as follows: control A was to vary the concentration of Ag+ in the reaction system. Each control experiment was done in the same conditions and procedure as the typical experiment.
2.2 Characterization of the GO–Ag hybrids
TEM images were acquired using a JEM-2010 TEM and a JEM-2100F TEM (JEOL Ltd., Japan), operating at an accelerating voltage of 200 kV. The TEM specimen was prepared by dropping an aqueous suspension of the GO–Ag hybrids on a carbon-coated on lacey support film and then dried at room temperature. SEM images were taken on a ZEISS-ULTRA 55 SEM equipped with an X-ray EDS at an accelerating voltage of 20 kV. AFM images were taken on a Nanoscope MultiMode V SPM system (Veeco, USA). Zeta potentials were measured with NICOMP 380ZLS Zeta potential/Particle sizer. UV-vis spectra were measured at 20 °C with a Shimadzu UV-2450 UV-visible spectrophotometer equipped with a 10-mm quartz cell. Raman measurements were performed on Renishaw spectrometer system at the excitation wavelength of 514 nm. Each spectrum was accumulated three times.3. Results and discussion
According to the formation mechanism of monodisperse nanomaterials, the key to monodispersity is how to achieve a burst nucleation and then separate nucleation and growth.1,28 Therefore, two different feeded strategies of AgNO3 were designed and performed for the preparation of the silver nanomaterials. In a typical strategy (I), a step-wise change of metal ions concentration in the reaction, the aqueous solution of AgNO3 was gradually added to the aqueous solution of GO. The nucleation and growth were fully separated. When 1 mL of an aqueous solution of AgNO3 was added into the reaction system, the nucleation finished quite fast, which favors the formation of monodisperse nanomaterials according to the LaMer mechanism.29 With the later adding of AgNO3, the growth of the silver nanomaterials was started. The growth rate can be tuned during the adding process. At the initial low Ag+ concentration, Ag ions seemingly nucleated (seeded) on the surface of GO, initiating the growth of Ag. With increased reaction times, the silver nanomaterials gradually grew into nanoparticles and nanocubes by time-dependent means.Fig. 1 shows representative TEM images of the GO–Ag hybrids at different reaction times, such as 12 and 24 h, respectively. We can clearly observe that the well-dispersed silver nanomaterials with different sizes and shapes were prepared on the GO sheets in the different growth stages. Within the 12 h reaction time, silver nanomaterials mainly exhibited approximately spherical structures with an average diameter of 13.47 ± 1.70 nm (Fig. 1a,b), estimated by measuring 100 randomly selected particles in enlarged TEM images. Those particles with good crystalline quality uniformly distributed on the surface of the GO sheets, which is attributed to the functional groups (hydroxyl, epoxide and carboxylic groups) uniformly existing on the two accessible sides. Those functional groups provide multiple binding sites for Ag ions that can react with GO. The formation of nuclei is quite fast surrounding the interaction sites between metal ions and GO. Once the nuclei formation, the growth of nanomaterials starts around them. After 24 h, the silver nanocubes formed gradually around the sphere nanoparticles, their size was about 40 nm in width (Fig. 1c,d).
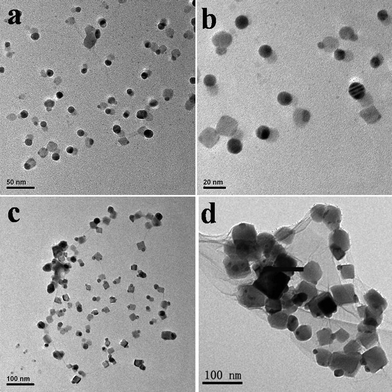 | ||
| Fig. 1 TEM images of the GO–Ag hybrids obtained by the strategy (I) at different reaction time: (a,b) 12 h and (c,d) 24 h, respectively. (a,c) Low magnification TEM images, (b,d) High magnification TEM images. | ||
Fig. 2a and b show that the silver nanomaterials are approximately cubic structures with sizes in the range of 40–50 nm, and uniformly exist on the two sides of the GO, which is consistent with the TEM results. The EDS spectrum (Fig. 2c) shows the presence of elements Ag, C, and O in the prepared GO–Ag hybrids. The peaks of the C and O elements are due to the GO. The peak of Si element is due to the Si substrate. The inset table is the related weight percentage and atomic percentage of the prepared GO–Ag hybrids, which shows that the atomic ratio of Ag and C is ∼5![[thin space (1/6-em)]](https://www.rsc.org/images/entities/char_2009.gif) :1.
:1.
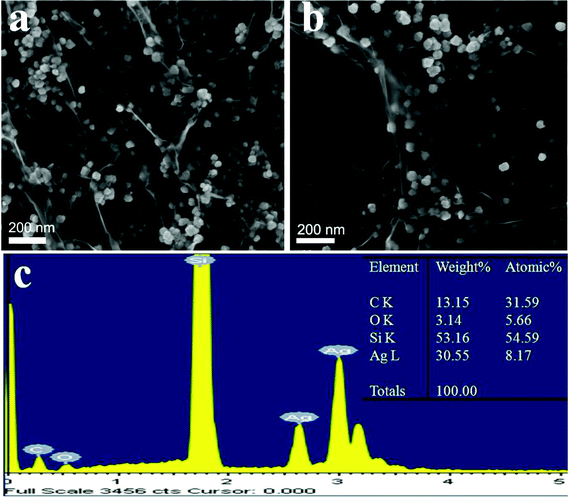 | ||
| Fig. 2 (a,b) SEM images of GO–Ag hybrids obtained by the strategy (I) at 24 h; (c) the energy dispersive X-ray spectrum of GO–Ag hybrids (the inset is the corresponding table of the related weight percentage and atomic percentage). | ||
In strategy (II), the aqueous solution of AgNO3 was once added into the aqueous solution of GO. The nucleation was overlapped by the growth. Fig. 3a shows that high branched silver particles were produced. Ag ions spontaneously precipitated in the form of dendrites on the surface of the GO sheets in the absence of any added reducing, capping, or templating agents. The three-dimensional (3-D) coral-like silver dendrites were mainly along three different directions and formed three branches; each branch split into three sub-branches, and so on. The crystal tips in the backbone or side branches are very sharp and have a very large radius of curvature.30,31 With the increasing of the reaction time, the size of the dendrites is large in Fig. 3b. Those dendrites show self-similarity in different scales.
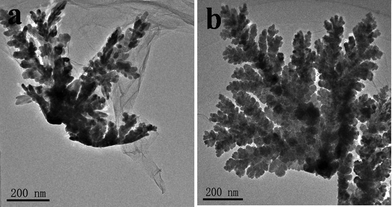 | ||
| Fig. 3 TEM images of silver dendrites obtained by the strategy (II): (a)1 h (b)96 h. | ||
In order to investigate the growth mechanism of the silver nanomaterials on the GO sheets, we used AFM and HR-TEM to observe the samples at different reaction times. Fig. 4a shows that the GO–Ag hybrids exist in sheet-like shapes. The number of silver nanoparticles at the edges of the GO is more than on the two accessible sides, which is attributed to that there are abundant carboxylic groups at the edges. Carboxylic moieties in citrate ions and poly(acrylic) acid have been used for complexing silver ions and stabilizing the metallic particles formed.32 We believe that the interactions between the silver ions and the carboxylic groups are stronger than with the hydroxyl and epoxide groups. When the AgNO3 solution was added to the reaction system, the silver ions are most likely to bind with the carboxylic groups. The size of the silver nanoparticles, measured from the height profile of the AFM image (Fig. 4b), is about 20 nm, which is in agreement with the results from the TEM images.
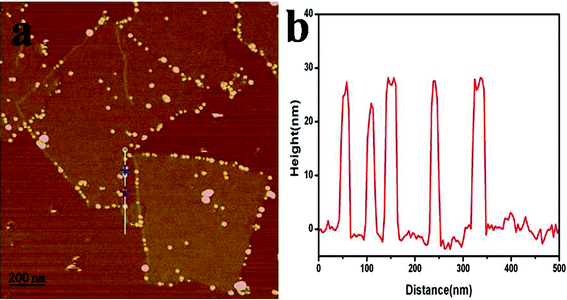 | ||
| Fig. 4 (a) AFM image of GO–Ag hybrids on the mica surface, (b) the height profile of the AFM image. | ||
Based on the formation of silver nanoparticles, silver nanocubes gradually grew on the silver nanoparticles. Fig. 5a shows TEM images of the GO–Ag hybrids on the two accessible sides. As shown in Fig. 5b–d, every silver nanocube has one or two single silver nanoparticles. Those silver nanoparticles support the sites for the growth of the nanocubes based on GO as the substrate.
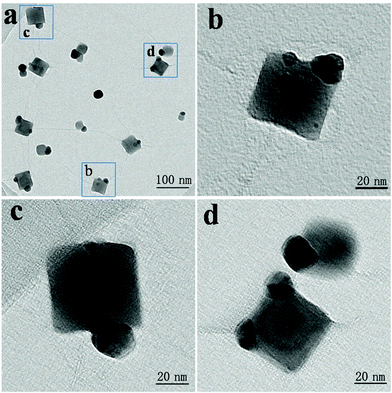 | ||
| Fig. 5 TEM images of the GO–Ag hybrids on the two accessible sides: (a) low magnification; (b–d) high-resolution. | ||
In order to clarify the mechanism of the synthesis of the GO–Ag hybrids, we characterized the GO–Ag hybrids by UV-vis spectroscopy, as silver nanomaterials are known to exhibit a size-dependent characteristic surface plasmon resonance band.33 The UV-vis spectrum of GO displays two characteristic peaks, a maximum at 230 nm, which corresponds to the π→π* transitions of the aromatic C–C bonds, and a shoulder at 303 nm, which is attributed to the n→π* transitions of the C![[double bond, length as m-dash]](https://www.rsc.org/images/entities/char_e001.gif) O bonds.34 When the AgNO3 solution was added to the reaction system, the absorption intensity of the characteristic peak at 303 nm was gradually decreased along with an increase in the reaction time to 210 min (Fig. 6a), which is probably due to interactions between the silver ions and the carboxylic groups. In control A (Fig. 6b), the concentration of Ag+ ions was gradually increased in the reaction system, which led to a remarkable intensity increase of the characteristic surface plasmon absorption band at ∼440 nm. It indicated that the abundant silver nanoparticles appeared in the supernatants of the suspensions. This result is different from previous reports.14,21 Due to the limited nucleation sites supported by the fixed concentration of GO, when the abundant silver ions were reduced, they will appear in the supernatants of the suspensions.
O bonds.34 When the AgNO3 solution was added to the reaction system, the absorption intensity of the characteristic peak at 303 nm was gradually decreased along with an increase in the reaction time to 210 min (Fig. 6a), which is probably due to interactions between the silver ions and the carboxylic groups. In control A (Fig. 6b), the concentration of Ag+ ions was gradually increased in the reaction system, which led to a remarkable intensity increase of the characteristic surface plasmon absorption band at ∼440 nm. It indicated that the abundant silver nanoparticles appeared in the supernatants of the suspensions. This result is different from previous reports.14,21 Due to the limited nucleation sites supported by the fixed concentration of GO, when the abundant silver ions were reduced, they will appear in the supernatants of the suspensions.
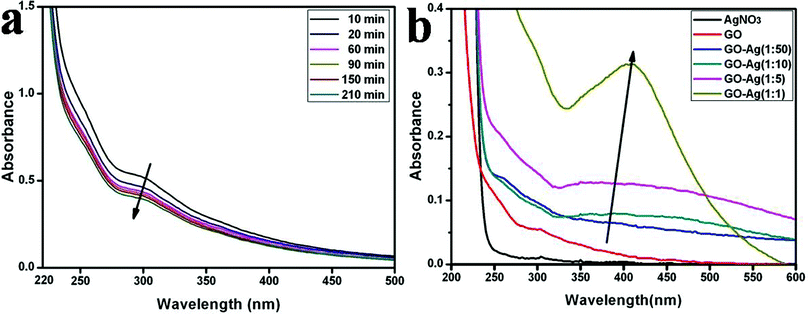 | ||
| Fig. 6 UV-vis absorption spectra of the GO–Ag hybrids. (a) at different reaction times in strategy (I); (b) control A at different concentrations of Ag+ ions. | ||
To further study the interaction mechanism between GO and Ag+, a series of concentrations of Ag+ ions were chosen to interact with GO and the resultant products were monitored by Zeta potential measurement. Zeta potentials of GO–Ag hybrids in different concentration Ag+ solution were recorded at pH 7.0 as shown in Fig. 7a. It shows that the GO–Ag hybrids all bear negative charges. An aqueous suspension of GO exhibits a zeta potential of ca. −40.28, indicative of negatively charged surfaces caused by the presence of functional groups (hydroxyl, epoxide and carboxylic groups). The value of the negative charge was decreased, as it depends highly on the concentration of Ag+, which is attributed to the increased number of functional groups (hydroxyl, epoxide and carboxylic groups) binding to Ag+ in the solution. When the GO concentration was over 5 mM, the charge value of GO-Ag hybrids almost became into zero. The results indicated that the GO sheets act as the donor of electrons for the growth of silver nanomaterials.21
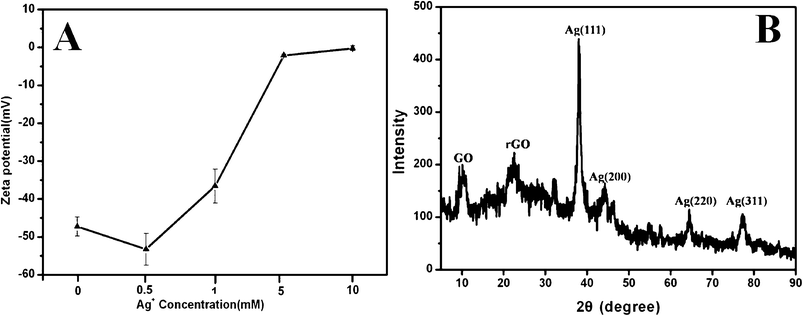 | ||
| Fig. 7 (a) Zeta potentials of the GO–Ag hybrids in different concentrations of Ag+ solution; (b) XRD pattern of GO–Ag hybrids obtained by strategy (I) in 24 h. | ||
Fig. 7b shows the XRD pattern of GO–Ag hybrids (about 65wt% Ag) obtained by strategy (I) in 24 h. The peak at 2θ = 11° can be assigned to the (001) diffraction peak of GO (d-spacing 7.94 Å). The peak at 2θ = 22° is closer to the typical (002) diffraction peak of graphite (d-spacing 3.35 Å). It indicates that part of GO was reduced into reduced GO. The peaks at 2θ = 38°, 44°, 65°, and 78° can be assigned to the (111), (200), (220), and (311) crystalline planes of the face-centered cubic silver, respectively, which are in agreement with the standard card (JCPDS: 04-0783).1
It is well known that silver nanomaterials exhibit a strong SERS effect, both in colloid solution and in the dry state, in which the Raman scattering signals across the sections are dramatically enhanced for the molecules adsorbed on the surface.35,36 Previous studies have shown that the Raman signals of carbon nanotubes attached to metallic nanostructures can be enhanced, and in these instances the carbon nanotubes act as test molecules to investigate the SERS effect.37 Therefore, we investigated the Raman signal enhancements of GO by the in situ synthesized silver nanocubes. The typical features for GO in Raman spectra are the G line (the E2g mode of sp2 carbon atoms) around 1600 cm−1 and the D line (the symmetry A1g mode) around 1350 cm−1 as shown in Fig. 8A-a.34 The intensities of the D and G bands of GO in the GO–Ag hybrids obviously increased in comparison with those of the original GO in the same test conditions (Fig. 8A). Generally, SERS can be explained in terms of electromagnetic (high enhancement factors up to 10)12 and chemical (high enhancement factors up to 10)1,2 enhancements.14 In our systems, the level of enhancement factor is about half an order of magnitude, which may be attributed to the chemical effect. The GO–Ag hybrids can be seen as a charge–transfer complex, which can absorb light at an excitation frequency, which consequently produces chemical SERS (furthermore, some potential reasons, for example, morphological/composition changes and the larger light-to-material interactions may also result in the SERS effect in our systems). As shown in Fig. 8B, the intensities of the D and G bands increase with the increased density of the coating nanocubes. When the Ag+ concentration was over 1 mM, the intensities become stable. This phenomenon is likely to be due to the fact that the number or densities of the interaction sites between the GO and silver nanocubes are constant. Consequently, when saturation of the charge–transfer complexes is reached, increasing the quantity of silver may have little influence on the intensities of the D and G bands.
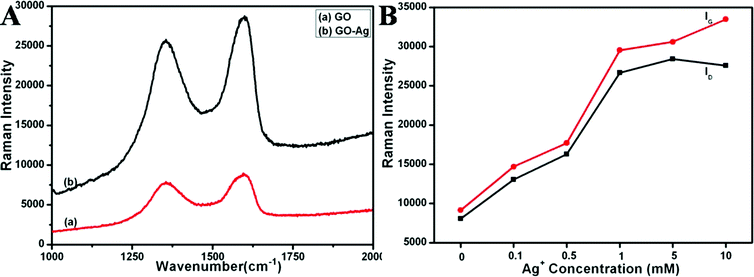 | ||
| Fig. 8 A) Raman spectra of GO (a) and SERS spectra of GO–Ag hybrids with 65 wt% Ag (b). B) The relationships between the intensity of the D and G bands of GO and the quantity of silver in the composites. | ||
A possible mechanism for the controllable formation of GO–Ag hybrids with different sizes and shapes in the GO solution is suggested as follows (Fig. 9). The whole course consists of three stages: the first stage is that Ag+ ions are sequestered by functional groups (hydroxyl, epoxide and carboxylic groups) of GO. The second stage is the reduction of Ag+ ions by galvanic displacement and redox reaction to form nuclei surrounding the interaction sites between Ag+ ions and GO, in which GO plays dual roles as substrates and reducing agents. The third stage is a growth process; when the nuclei forms on the GO substrate, the growth of nanomaterials starts around them. Silver nanocubes gradually grow surrounding the silver nanoparticles. During this process, silver atomic species from smaller nanoparticles transport to larger nanocubes by surface diffusion along the GO substrate, different shapes of silver nanomaterials such as silver nanoparticles and nanocubes on GO sheets can be controllably formed by adjusting concentration of silver ions, sampling order and reaction time. The detailed mechanism is worthy of further exploration for investigations on the interactions between metallic nanomaterials and GO in an attempt to create novel conjugated composites.
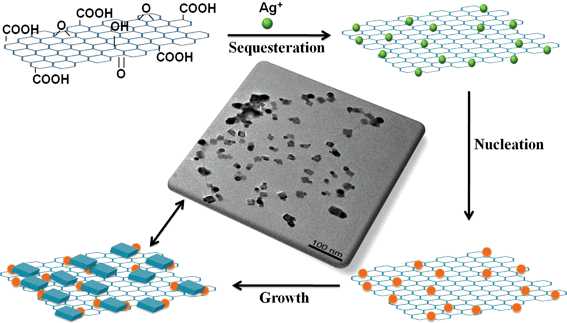 | ||
| Fig. 9 Schematic of the growth process of Ag nanomaterials in situ on graphene oxides. | ||
4. Conclusions
We have controllably prepared silver nanoparticles, nanocubes and dendrites on GO sheets by using different concentrations of silver ions, sampling orders and different reaction times at room temperature. This method does not need any other reducing agents or surfactants. GO plays dual roles – as substrates and reducing agents. This method is important not only because it provides a simple, green, and controllable synthetic route for MNs, but also because it creates novel MNs-conjugated GO-based hybrid materials. Furthermore, this method could provide a platform for further investigation of the growth mechanism of nanomaterials, even watching the nucleation and growth of nanomaterials in real-time. These GO–silver hybrids have great potential in applications such as ultrasensitive detection of biomarkers, SERS enhancement, and as electronic chemical sensors in the near future.Acknowledgements
This work is supported by the National Key Basic Research Program (2010CB933901), Important National Science & Technology Specific Projects (2009ZX10004-311), National Natural Scientific Funds (31170961, 51102258 and 20803040) and New Century Excellent Talent of Ministry of Education of China (NCET-08-0350).References
- P. Huang, J. Lin, Z. Li, H. Hu, K. Wang, G. Gao, R. He and D. Cui, Chem. Commun., 2010, 46, 4800–4802 RSC.
- Y. Sun and Y. Xia, Science, 2002, 298, 2176–2179 CrossRef CAS.
- C. N. R. Rao, G. U. Kulkarni, P. J. Thomas and P. P. Edwards, Chem. Soc. Rev., 2000, 29, 27–35 RSC.
- V. K. Sharma, R. A. Yngard and Y. Lin, Adv. Colloid Interface Sci., 2009, 145, 83–96 CrossRef CAS.
- J. A. Dahl, B. L. S. Maddux and J. E. Hutchison, Chem. Rev., 2007, 107, 2228–2269 CrossRef CAS.
- H. C. Choi, M. Shim, S. Bangsaruntip and H. Dai, J. Am. Chem. Soc., 2002, 124, 9058–9059 CrossRef CAS.
- D. S. Kim, T. Lee and K. E. Geckeler, Angew. Chem., Int. Ed., 2006, 45, 104–107 CrossRef CAS.
- J. W. Kim, E. I. Galanzha, E. V. Shashkov, H. M. Moon and V. P. Zharov, Nat. Nanotechnol., 2009, 4, 688–694 CrossRef CAS.
- J. W. Kim, H. M. Moon, M. Benamara, J. Sakon, G. J. Salamo and V. P. Zharov, Chem. Commun., 2010, 46, 7142–7144 RSC.
- M. N. Nadagouda and R. S. Varma, Aust. J. Chem., 2009, 62, 260–264 CrossRef CAS.
- H. P. Cong, J. J. He, Y. Lu and S. H. Yu, Small, 2010, 6, 169–173 CrossRef CAS.
- W. P. Xu, L. C. Zhang, J. P. Li, Y. Lu, H. H. Li, Y. N. Ma, W. D. Wang and S. H. Yu, J. Mater. Chem., 2011, 21, 4593–4597 RSC.
- J. Zhang, F. Zhang, H. Yang, X. Huang, H. Liu and S. Guo, Langmuir, 2010, 26, 6083–6085 CrossRef CAS.
- C. Xu and X. Wang, Small, 2009, 5, 2212–2217 CrossRef CAS.
- C. Xu, X. Wang and J. Zhu, J. Phys. Chem. C, 2008, 112, 19841–19845 CAS.
- D. Li and R. B. Kaner, Science, 2008, 320, 1170–1171 CrossRef CAS.
- P. V. Kamat, J. Phys. Chem. Lett., 2010, 1, 520–527 CrossRef CAS.
- J. Shen, M. Shi, N. Li, B. Yan, H. Ma, Y. Hu and M. Ye, Nano Res., 2010, 3, 339–349 CrossRef CAS.
- R. Pasricha, S. Gupta and A. K. Srivastava, Small, 2009, 5, 2253–2259 CrossRef CAS.
- J. Huang, L. Zhang, B. Chen, N. Ji, F. Chen, Y. Zhang and Z. Zhang, Nanoscale, 2010, 2, 2733–2738 RSC.
- X. Zhou, X. Huang, X. Qi, S. Wu, C. Xue, F. Y. C. Boey, Q. Yan, P. Chen and H. Zhang, J. Phys. Chem. C, 2009, 113, 10842–10846 CAS.
- G. Lu, S. Mao, S. Park, R. S. Ruoff and J. Chen, Nano Res., 2009, 2, 192–200 CrossRef CAS.
- K. Vinodgopal, B. Neppolian, I. V. Lightcap, F. Grieser, M. Ashokkumar and P. V. Kamat, J. Phys. Chem. Lett., 2010, 1, 1987–1993 CrossRef CAS.
- W. S. Hummers Jr and R. E. Offeman, J. Am. Chem. Soc., 1958, 80, 1339–1339 CrossRef.
- J. Zhang, H. Yang, G. Shen, P. Cheng and S. Guo, Chem. Commun., 2010, 46, 1112 RSC.
- K. Wang, J. Ruan, H. Song, J. Zhang, Y. Wo, S. Guo and D. Cui, Nanoscale Res. Lett., 2011, 6, 8 Search PubMed.
- J. Zhang, G. Shen, W. Wang, X. Zhou and S. Guo, J. Mater. Chem., 2010, 20, 10824–10828 RSC.
- D. Pan, S. Jiang, L. An and B. Jiang, Adv. Mater., 2004, 16, 982–985 CrossRef CAS.
- V. K. LaMer and R. H. Dinegar, J. Am. Chem. Soc., 1950, 72, 4847–4854 CrossRef CAS.
- Y. Wang, P. H. C. Camargo, S. E. Skrabalak, H. Gu and Y. Xia, Langmuir, 2008, 24, 12042–12046 CrossRef CAS.
- X. Wang, H. Itoh, K. Naka and Y. Chujo, Langmuir, 2003, 19, 6242–6246 CrossRef CAS.
- T. Cassagneau and J. H. Fendler, J. Phys. Chem. B, 1999, 103, 1789–1793 CrossRef CAS.
- R. R. Naik, S. J. Stringer, G. Agarwal, S. E. Jones and M. O. Stone, Nat. Mater., 2002, 1, 169–172 CrossRef CAS.
- J. Li and C. Liu, Eur. J. Inorg. Chem., 2010, 2010, 1244–1248 CrossRef.
- Y. Lu, G. L. Liu and L. P. Lee, Nano Lett., 2005, 5, 5–9 CrossRef CAS.
- D. Jean-Francois, M. Ather, G. D. S, R.-J. Isabelle, S. Philippe and E. Dujardin, Small, 2009, 4, 716–720 Search PubMed.
- Y. C. Chen, R. J. Young, J. V. Macpherson and N. R. Wilson, J. Phys. Chem. C, 2007, 111, 16167–16173 CAS.
Footnote |
| † These authors contributed equally to this work. |
| This journal is © The Royal Society of Chemistry 2012 |