Morphology of colloidal metal pyrophosphate salts
Y.Mikal van
Leeuwen
*a,
Krassimir P.
Velikov
b and
Willem K.
Kegel
*a
aUtrecht University, Van't Hoff Laboratory for Physical and Colloidal Chemistry, Padualaan 8, 3584, CH Utrecht, the Netherlands. E-mail: Y.M.vanleeuwen@uu.nl; W.K.Kegel@uu.nl; Fax: +31-302533870; Tel: +31-302532873
bUnilever Research and Development Vlaardingen, Olivier van Noortlaan 120, 3133, AT Vlaardingen, the Netherlands
First published on 7th February 2012
Abstract
We report the preparation and characterization of colloidal particles of several pyrophosphate metal salts, including, for the first time, salts containing multiple metals. These materials are compared in order to determine the influence of the composition and experimental conditions on particle morphology. From this we make two observations: first, the metal ion valence determines the degree of crystallinity of the material. While trivalent metal ions lead to amorphous precipitates, divalent ones result in crystalline nanoparticles. Furthermore, the nature of the metal ion has a significant influence on the morphology of the crystalline particles as we find clear shape preference for each metal ion. Second, methods such as autoclave treatment and surfactant addition can be used to further change particle morphology. Finally we mixed iron(III) with divalent metals during preparation and find that this only has a significant effect on the resulting particles if the FeIII![[thin space (1/6-em)]](https://www.rsc.org/images/entities/char_2009.gif) :
:![[thin space (1/6-em)]](https://www.rsc.org/images/entities/char_2009.gif) MII ratio is 1
MII ratio is 1![[thin space (1/6-em)]](https://www.rsc.org/images/entities/char_2009.gif) :
:![[thin space (1/6-em)]](https://www.rsc.org/images/entities/char_2009.gif) 5 or higher in MII content.
5 or higher in MII content.
I Introduction
The pyrophosphate anion (diphosphate, P2O74− or PPi) is part of the biological energy cycle and DNA synthesis, released upon hydrolysis of adenosine triphosphate (ATP) to adenosine monophosphate (AMP): ATP → AMP + PPi.1 Pyrophosphates form insoluble complexes in water in combination with most multivalent cations.2–4 Metal pyrophosphate salts are known for their chemical and structural complexity5 and wide industrial applications. They are used in catalysis,6–8 as solid electrolytes,9 as battery electrodes10 and in phosphate glasses for immobilisation of nuclear waste.11 Biomedical applications include artificial bone transplant material12 and photoluminescent probes.13 Furthermore, a type of arthritis known as pseudogout is caused by the deposition of small amounts of calcium pyrophosphate (CaPPi) in articular tissue.14,15 Studying the formation of colloidal systems of calcium pyrophosphate might be insightful for the treatment of this disease. Finally, colloidal iron(III) pyrophosphate (FePPi) has the intriguing property of containing iron, yet being transparent/white. Because of this it is commercially available as a food additive and mineral supplement: it is an easily concealable material and useful for fighting iron deficiency due to good bioaccessibility.16,17 Combining iron with other micronutrients such as calcium, zinc and magnesium in a single colloidal system would make it a multi-purpose, widely applicable delivery system for micronutrients.18 While these are many potential applications for colloidal systems not much work has been published on them. In current literature the materials are mainly prepared by solid-state synthesis under harsh conditions8,12,13,19–23 although an intermediate ‘wet chemistry method’ is sometimes used as well.5,10Furthermore, control over morphology is important for many of the biological and food applications since health risks can be induced by particle size and shape, asbestos being a notorious example.
Here we present for the first time a systematic study into the morphology and properties of colloidal metal pyrophosphate salts depending on metal-ion valence and nature. Mixed-metal systems are studied as well, by which we refer to a system of pyrophosphates precipitated with a combination of Fe3+ and either Al3+, Ca2+, Mg2+ or Zn2+. The divalent metal ions were chosen considering the biocompatibility mentioned above, aluminum was chosen for valence comparison to iron(III). We show that the particle morphology is very diverse and depends on metal ion as well as preparation method.
II Experimental section
Materials
FeCl3·6H2O, CaCl2·2H2O, AlCl3·6H2O, sodium dodecyl sulfate (SDS), hexadecyltrimethylammonium bromide (CTAB), Igepal CO-520 (NP-5) and disodium ethylenediaminetetraacetic acid dihydrate (Na2EDTA) were all obtained from Sigma Aldrich. Na4P2O7·10H2O and Zn(NO3)2·4H2O were bought from Merck and MgCl2·6H2O from Fluka. All chemicals were used as received; aqueous solutions were prepared using water deionized by a Millipore Synergy water purification system.Preparation
Colloidal particles of iron pyrophosphate were prepared by dissolving 0.857 mmol FeCl3 in 50 ml water and adding this solution dropwise in about 15 min to 0.643 mmol Na4P2O7 in 100 ml while stirring. A turbid white dispersion forms during the addition of the final ∼5 ml. Mixed systems were prepared by substituting part of the iron content by calcium, magnesium or zinc (together referred to as MII) in the following Fe : MII ratios: Fe10MIIPPi8 (referred to as ‘10 : 1 ratio’), Fe8MII2PPi7 (‘4 : 1’), Fe4MII4PPi5 (‘1 : 1’), Fe2 MII11PPi7 (‘1 : 5’) or Fe2MII19PPi11 (‘1 : 10’). Here we assume complete precipitation without inclusion of the Na+ and Cl− from the reactants. Full substitution of iron results in the pure MIIpyrophosphate, MIIPPi. Substitution of Fe3+ with Al3+ allows for direct stoichiometric exchange, pyrophosphates precipitated with a trivalent metal ion will in general be denoted MIIIPPi. For some experiments, the addition was performed in an ultrasonic bath. These dispersions were stirred for another 30 min while ultrasonicating after complete addition. For autoclave experiments, after complete addition the reaction mixture was transferred to a Teflon holder in a steel autoclave cylinder and stored at 100 °C for four days without stirring. All reaction mixtures were cleaned after preparation by centrifugation and washing with millipore water twice.The influence of surfactants was also investigated. For these experiments surfactant (anionic SDS, cationic CTAB or non-ionic NP-5) was used in a four times excess to the pyrophosphate concentration; 2.6 mmol of the surfactant was dissolved in the pyrophosphate solution before adding the metal ion solution. This resulted in a concentration of 17 mM in the final volume: beyond the critical micelle concentration (cmc) for all surfactants. These samples were centrifuged five times instead of two to remove excess surfactant.
Analysis
Dynamic light scattering (DLS) measurements were performed on a Malvern Instruments Zetasizer Nano series machine in backscatter mode at 25 °C with 5 min equilibration time. Samples were dried on a carbon-coated copper grid prior to transmission electron microscopy (TEM) and energy-dispersive X-ray spectroscopy (EDX) performed on a Tecnai 12 and Tecnai 20 from FEI Company, respectively. Samples for material analysis using X-ray powder diffraction (XRD) and Fourier transform Infrared spectroscopy (FTIR) were prepared by centrifuging the dispersion again, washing the sediment three times with acetone, and drying in an oven at 40 °C for 24 h. FTIR spectra were measured on a Perkin-Elmer IR spectrometer using the KBr pellet technique, XRD measurements were carried out on a Bruker-AXS D8 Advance powder X-ray diffractometer in Bragg–Brentano mode equipped with automatic divergence slit (0.6 mm 0.3 °) and a PSD Våntec-1 detector. The radiation used was Co-Kα1,2, λ = 1.79026 Å, operated at 30 kV, 45 mA. Elemental analysis using inductively coupled plasma atomic emission spectroscopy (ICP-AES) was performed on a solution prepared by dissolving the dried samples using a four times excess of Na2EDTA compared to the (estimated) metal ion content. Measurements performed using a SPECTRO CIROSCCD ICP (8.13) with a radial plasma ion source and Paschen–Runge spectrometer.III Results
Metal pyrophosphate morphology
In a comparison between the influence of divalent and trivalent metal ions on the resulting precipitates, we find that the precipitation method yields similar particles for aluminum, iron and calcium pyrophosphates. TEM analysis shows clusters consisting of primary particles of roughly 20 nm, see Fig. 1a–c. Magnesium and zinc show different morphology: magnesium pyrophosphate forms large micrometer-sized needles and spheres (Fig. 1d), while zinc results in thin platelets with either sharp or rounded corners, see Fig. 1e. Since it is generally known from colloidal synthesis that the preparation method can have a drastic influence on the resulting particles, we tested three frequently used methods for their influence on metal pyrophosphates.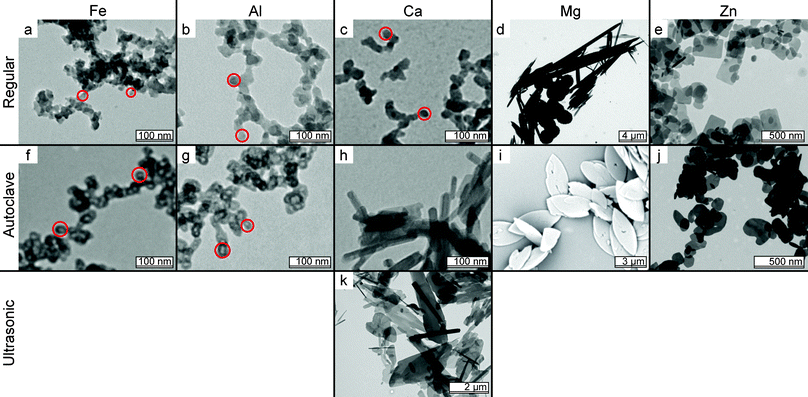 | ||
| Fig. 1 TEM image matrix summarizing the influence of preparation method and metal ion on colloidal MPPis. Rows indicate the preparation method, columns the metal ion used. The red circles indicate what we refer to as primary particles in the amorphous aggregates (i is an SEM image). | ||
The first method is autoclave treatment, used in literature for changing gel-like materials into crystalline particles.24–26 This treatment has a strong influence on the metal-pyrophosphate morphology. For the trivalent materials the primary particles have become hollow, see Fig. 1f and g. We were unable to take high resolution images of these hollow particles during TEM analysis since these seem to be much more beam sensitive than the untreated particles shown in Fig. 1a and b. Even at low-dose illumination the particles shrink within seconds and the hollow centre is no longer visible. CaPPi grows into rods resembling those found from similar treatment of the chemically related hydroxyapatite,27Fig. 1h. The size of these rods can be slightly influenced by the autoclave temperature and treatment time (results not shown). MgPPi forms micrometer sized, ellipsoidal platelets and autoclave treatment of the ZnPPi particles results in thicker, rounded platelets, see Fig. 1i and j.
In the second method, ultrasonication of the dispersions during and/or after preparation does not have a significant influence on particle shape on any material except for CaPPi. This system changes into micrometer sized, crystalline platelets, see Fig. 1k.
The third method makes use of surfactant molecules during preparation, which can have strong effects on particle morphology.28,29 Three types of surfactant were used: anionic (SDS), cationic (CTAB) and nonionic (NP-5). We find that while surfactants have no discernable influence on FePPi and AlPPi, they do change the morphology of the MIIPPis. The results are summarized in the image-matrix in Fig. 2. Two samples are missing from the matrix: Ca2+ forms a precipitate with SDS and therefore CaPPi could not be prepared with SDS. This effect is not observed for any of the other metal ions used in this work. Using CTAB in the reaction mixture of MgPPi results in a clear solution: no particles are formed.
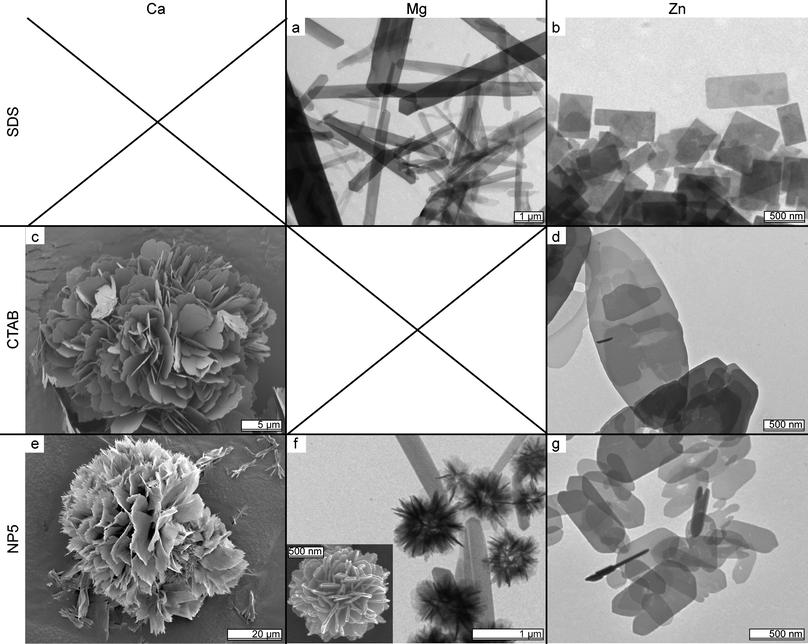 | ||
| Fig. 2 TEM image matrix summarizing the influence of surfactants on MIIPPis. Rows indicate the surfactant, columns the metal ion used (images c, e and the inset of f are SEM images). | ||
For SDS, magnesium forms very thin, elongated platelets (Fig. 2a) while zinc only forms the geometric shapes found in Fig. 1e (Fig. 2b). CaPPi in the presence of CTAB forms large spherical clusters of platelets and ZnPPi results in ∼3 μm ellipsoidal platelets consisting of multiple layers as shown in Fig. 2c and d. Finally, CaPPi grown in the presence of NP-5 shows morphology similar to CTAB treatment but consisting of thinner platelets with frayed edges as shown in Fig. 2e. MgPPi shows particles smaller but similar to those formed with regular synthesis, ZnPPi yields platelets with truncated corners when prepared with NP-5 (see Fig. 2f and g).
Comparing these results we find that MIIIPPis form amorphous precipitates while MIIPPis form different, possibly crystalline, shapes. MgPPi preferably forms elongated, needle-like particles. The spheres shown in Fig. 1d seem to be an exception to this, but they actually consist of platelets and needles clustered together, just like the particles shown in the inset of Fig. 2f. ZnPPi has a clear preference for thin platelets and CaPPi morphology differs per preparation method. In general, the MIIPPis have a preference for thin platelets or needles.
DLS measurements of FeIIIPPi yield volume-average sizes on the order of 200 nm, which is larger than the particles found from TEM (∼20 nm). This indicates that the precipitates formed are present as clusters in dispersion, possibly resembling what is found from TEM analysis (Fig. 1a and b). It should be noted here that aggregates observed from TEM are not necessarily representative for the situation in dispersion, as TEM samples are dried prior to analysis. DLS analysis of AlPPi and the MIIPPis was not successful due to colloidal instability. The fact that DLS analysis on MgPPi and ZnPPi would not be possible could have been expected from TEM analysis: micrometer sized (aggregated) particles of these materials sediment too rapidly. But while AlPPi and CaPPi look morphologically similar to FePPi in TEM images (Fig. 1a–c), sedimentation was too rapid for these samples as well. From this it might be concluded that much larger aggregates are formed in AlPPi and CaPPi compared to FePPi. This is confirmed by the macroscopic observation of the AlPPi and CaPPi dispersions sedimenting significantly faster than the FePPi dispersion (see Fig. 3). This could not be influenced by ultrasonication during or after preparation.
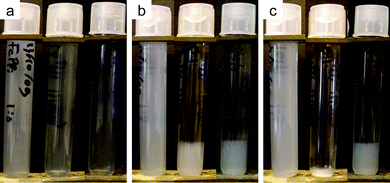 | ||
| Fig. 3 Sedimentation in three metal pyrophosphate dispersions over time: freshly prepared (a), after 24 h (b) and after three days (c). From left to right: FePPi, CaPPi and AlPPi. After three days the gel-like state formed in (b) has collapsed completely into dense aggregates for CaPPi. | ||
XRD analysis confirms the difference between MIIPPi and MIIIPPi found from TEM analysis in Figs. 1 and 2. While the XRD spectra for both MIIIPPis show only noise indicating amorphous materials, the spectra for MIIPPis show clear signals, see Fig. 4a. However, the high signal-to-noise ratio indicates that part of the MIIPPi particles is amorphous as well. The influence of the preparation method is also evident in XRD analysis. For example, autoclave treatment of calcium pyrophosphate increases crystallinity and changes its crystal structure as can be seen from the reduction in background noise and shift in peak location in Fig. 4b, comparing the spectra of CaPPi before (yellow, bottom) and after autoclave treatment (orange, middle). Similar effects have been shown in literature for solid-state preparation methods at much higher temperatures.20,22,30Ultrasonication also changes the XRD spectrum of CaPPi, see the red top spectrum in Fig. 4b. Magnesium shows similar changes and the presence of SDS slightly influences the obtained pattern but not as drastically as the change in preparation method, see Fig. 4c. Comparison of these XRD spectra with literature yields little to no agreement. This could be explained by the fact that, as mentioned before, most of those characterizations are performed on macroscopic crystals obtained from solid-state preparation often at high temperatures, likely to induce different crystal structures.5,21–23,31–33
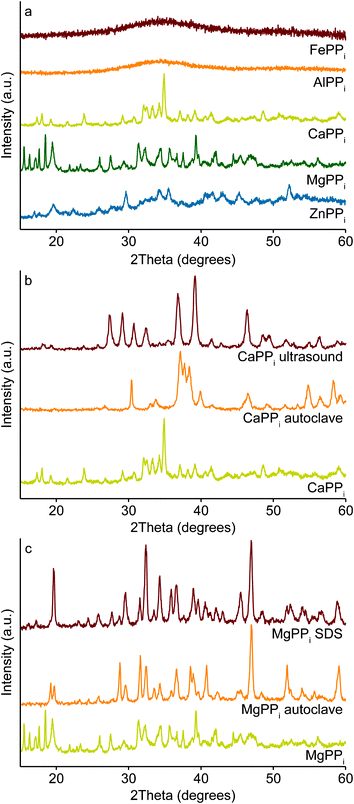 | ||
| Fig. 4 XRD analysis of the metal pyrophosphates. Comparison between MIIPPi and MIIIPPi in (a) shows the MIIIPPis to be amorphous while the MIIPPis are (partly) crystalline. Using different preparation methods such as addition of surfactant, ultrasonication or autoclave treatment results in different crystal structures for CaPPi (b) and MgPPi (c). | ||
FTIR analysis shows that peak positions coincide between materials due to the fact that the main vibrationally active species is the same in all materials (PPi), see Fig. 5. The one exception to this is AlPPi, for which the spectrum is slightly shifted: e.g. the maximum at 1120 cm−1 shifts to 1170 cm−1. This could indicate a stronger influence of Al3+ on the P![[double bond, length as m-dash]](https://www.rsc.org/images/entities/char_e001.gif) O vibration compared to the other metal ions, but why a similar effect is not observed for Fe3+ is not clear.
O vibration compared to the other metal ions, but why a similar effect is not observed for Fe3+ is not clear.
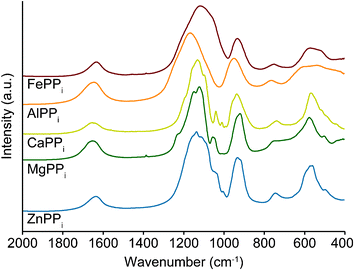 | ||
| Fig. 5 FTIR analysis of the metal pyrophosphates prepared by coprecipitation. At wavenumbers beyond 2000 cm−1 only a broad –OH peak is found (not shown). | ||
MIIIPPis show broad, smooth peaks in FTIR analysis, while MIIPPis result in sharper peaks. This is probably due to the partly amorphous nature of the MIIIPPis found from XRD analysis in Fig. 4. This lower degree of crystallinity also explains the poor agreement in detail with FTIR analysis of crystalline (bulk) materials reported in literature, such as LiFePPi10 or CaPPi.21,34,35 More amorphous materials such as CoFePPi give better agreement in the smoothness of the curves.19
Mixed-metal pyrophosphates
For systems containing mixed metals, charge neutral ratios of FeIII![[thin space (1/6-em)]](https://www.rsc.org/images/entities/char_2009.gif) :
:![[thin space (1/6-em)]](https://www.rsc.org/images/entities/char_2009.gif) MII
MII![[thin space (1/6-em)]](https://www.rsc.org/images/entities/char_2009.gif) :
:![[thin space (1/6-em)]](https://www.rsc.org/images/entities/char_2009.gif) PPi are prepared, see the Methods section for details. Most resulting precipitates are similar to the amorphous clusters observed in Fig. 1a–c, see Fig. 6a and b. The samples deviating from this trend are Fe
PPi are prepared, see the Methods section for details. Most resulting precipitates are similar to the amorphous clusters observed in Fig. 1a–c, see Fig. 6a and b. The samples deviating from this trend are Fe![[thin space (1/6-em)]](https://www.rsc.org/images/entities/char_2009.gif) :
:![[thin space (1/6-em)]](https://www.rsc.org/images/entities/char_2009.gif) Mg and Fe
Mg and Fe![[thin space (1/6-em)]](https://www.rsc.org/images/entities/char_2009.gif) :
:![[thin space (1/6-em)]](https://www.rsc.org/images/entities/char_2009.gif) Zn in ratios of 1
Zn in ratios of 1![[thin space (1/6-em)]](https://www.rsc.org/images/entities/char_2009.gif) :
:![[thin space (1/6-em)]](https://www.rsc.org/images/entities/char_2009.gif) 5 and higher in MII content. For FeMgPPi needle-like particles are formed resembling those seen before in Figs. 1 and 2 although some demixing seems to occur: smaller ∼20 nm particles can be seen on the surface of the needles, see Fig. 6c. In the case of FeZnPPi rough, irregular platelets together with elliptical shapes are found, see Fig. 6d. XRD and FTIR analysis of the Fe
5 and higher in MII content. For FeMgPPi needle-like particles are formed resembling those seen before in Figs. 1 and 2 although some demixing seems to occur: smaller ∼20 nm particles can be seen on the surface of the needles, see Fig. 6c. In the case of FeZnPPi rough, irregular platelets together with elliptical shapes are found, see Fig. 6d. XRD and FTIR analysis of the Fe![[thin space (1/6-em)]](https://www.rsc.org/images/entities/char_2009.gif) :
:![[thin space (1/6-em)]](https://www.rsc.org/images/entities/char_2009.gif) Ca 10
Ca 10![[thin space (1/6-em)]](https://www.rsc.org/images/entities/char_2009.gif) :
:![[thin space (1/6-em)]](https://www.rsc.org/images/entities/char_2009.gif) 1 material shows it to be similar to pure FePPi: amorphous and with little detail in FTIR (results not shown).
1 material shows it to be similar to pure FePPi: amorphous and with little detail in FTIR (results not shown).
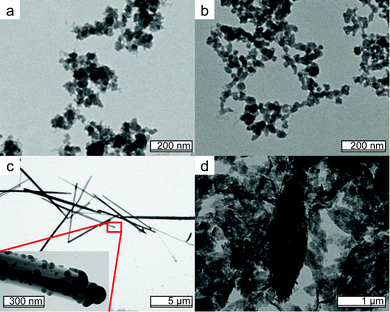 | ||
Fig. 6 Morphology of mixed metal pyrophosphates resembles that of MIIIPPi found in Fig. 1, as shown here for Fe![[thin space (1/6-em)]](https://www.rsc.org/images/entities/char_2009.gif) : :![[thin space (1/6-em)]](https://www.rsc.org/images/entities/char_2009.gif) Al 10 Al 10![[thin space (1/6-em)]](https://www.rsc.org/images/entities/char_2009.gif) : :![[thin space (1/6-em)]](https://www.rsc.org/images/entities/char_2009.gif) 1 (a) and Fe 1 (a) and Fe![[thin space (1/6-em)]](https://www.rsc.org/images/entities/char_2009.gif) : :![[thin space (1/6-em)]](https://www.rsc.org/images/entities/char_2009.gif) Ca 1 Ca 1![[thin space (1/6-em)]](https://www.rsc.org/images/entities/char_2009.gif) : :![[thin space (1/6-em)]](https://www.rsc.org/images/entities/char_2009.gif) 10 (b). The only mixed materials that show different morphology are Fe 10 (b). The only mixed materials that show different morphology are Fe![[thin space (1/6-em)]](https://www.rsc.org/images/entities/char_2009.gif) : :![[thin space (1/6-em)]](https://www.rsc.org/images/entities/char_2009.gif) Mg 1 Mg 1![[thin space (1/6-em)]](https://www.rsc.org/images/entities/char_2009.gif) : :![[thin space (1/6-em)]](https://www.rsc.org/images/entities/char_2009.gif) 10 (c) and Fe 10 (c) and Fe![[thin space (1/6-em)]](https://www.rsc.org/images/entities/char_2009.gif) : :![[thin space (1/6-em)]](https://www.rsc.org/images/entities/char_2009.gif) Zn 1 Zn 1![[thin space (1/6-em)]](https://www.rsc.org/images/entities/char_2009.gif) : :![[thin space (1/6-em)]](https://www.rsc.org/images/entities/char_2009.gif) 5 (d). Ratios with higher MIIcontent show similar morphology (not shown). 5 (d). Ratios with higher MIIcontent show similar morphology (not shown). | ||
From ICP-AES elemental analysis we find that the particle composition is very similar to what is added during reaction, except for the Na+ and Cl− which are predominantly left in solution. For pure FePPi particles this results in Na0.2Cl0.3Fe4(P2O7)2.9, compared to the Na12Cl12Fe4(P2O7)3 added. Most likely the Na and Cl indicated in the formula of the precipitate are largely present as counterions in solution not washed away during cleaning of the reaction mixture, not so much incorporated into the material.
EDX line scans indicate homogeneous composition of the nanoparticles (on the resolution of the analysis method); as can be seen the normalized intensities follow each other closely, see Fig. 7.
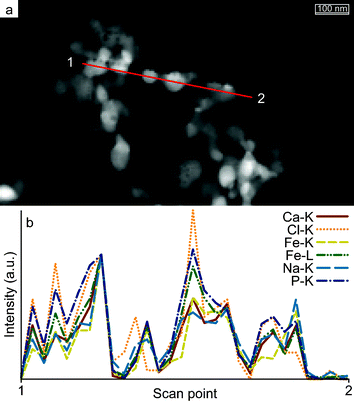 | ||
Fig. 7
EDX analysis of Fe![[thin space (1/6-em)]](https://www.rsc.org/images/entities/char_2009.gif) : :![[thin space (1/6-em)]](https://www.rsc.org/images/entities/char_2009.gif) Ca 1 Ca 1![[thin space (1/6-em)]](https://www.rsc.org/images/entities/char_2009.gif) : :![[thin space (1/6-em)]](https://www.rsc.org/images/entities/char_2009.gif) 10 ratio. (a) dark-field TEM image showing the position of the scan line (red line, scan direction from 1 to 2). The normalized intensities (b) show a uniform material distribution throughout the material. Other materials give similar results (not shown). 10 ratio. (a) dark-field TEM image showing the position of the scan line (red line, scan direction from 1 to 2). The normalized intensities (b) show a uniform material distribution throughout the material. Other materials give similar results (not shown). | ||
Discussion
We have shown that the degree of crystallinity of the colloidal particles is determined by the valence of the metal ion used as we find the MIIIPPis to be amorphous and the MIIPPis to be mostly crystalline. It can be argued that this is caused by the ‘valence mismatch’ in MIIIPPis. While MIIPPi can easily form a charge-neutral MII2PPi unit for (bulk) crystalline material, the combination of Me3+ and PPi4− needs a more complicated stoichiometry to reach charge neutrality. During fast precipitation this could result in an amorphous structure. It is therefore slightly surprising to find so little Na+ or Cl− in the chemical analysis since either could facilitate smaller charge-neutral subunits. Similar complicating effects could cause CaPPi to initially form amorphous material if the Ca–PPi bond is so strong that amorphous precipitation is faster than crystallization. It might also explain why the mixed-metal pyrophosphates remain amorphous up to a FIII![[thin space (1/6-em)]](https://www.rsc.org/images/entities/char_2009.gif) :
:![[thin space (1/6-em)]](https://www.rsc.org/images/entities/char_2009.gif) MII ratio of 1
MII ratio of 1![[thin space (1/6-em)]](https://www.rsc.org/images/entities/char_2009.gif) :
:![[thin space (1/6-em)]](https://www.rsc.org/images/entities/char_2009.gif) 5, simply because the presence of FeIII disrupts the crystal formation.
5, simply because the presence of FeIII disrupts the crystal formation.
It is interesting to note that the chemically related metal phosphate salts seem to follow the opposite trend in valence dependent crystallinity, as colloidal aluminum phosphate is crystalline (vascerite)36 while phosphates containing divalent metals can be prepared as amorphous particles even after autoclave treatment.37,38 This might be caused by the same effect mentioned above: since the phosphate ion is trivalent, the divalent metals would have the ‘valence mismatch’ and the trivalent metals can immediately form a charge-neutral complex. That iron phosphate forms micrometer-sized, amorphous particles could be caused by a similar effect as mentioned for calcium pyrophosphate.39
IV Conclusions
In this work we have studied the morphology of (mixed) metal pyrophosphates. First, we have shown the influence of the metal ion valence on the morphology of metal pyrophosphates; while the trivalent metal ions yield amorphous precipitates, the divalent ones result in crystalline particles. Furthermore, the type of divalent metal ion determines the shape of the particles formed as we find different particles for the different metal ions. Second, we have shown that the morphology of these materials can be further modified by changes in experimental conditions by using methods such as autoclave treatment or addition of surfactants. In general, MIIPPis have a preference for thin, flat platelets or needles differing in size or organization per preparation method, while the MIIIPPis form the same amorphous nanoparticles for every preparation method. The only exception is autoclave treatment: amorphous metal pyrophosphates aged in an autoclave slightly increase in size and become hollow. They do not form crystalline particles as one might expect from other work.24–26 Analysis using XRD shows that these changes in shape coincide with different crystal structures, but no exact match is found with materials in literature. Finally, we have investigated the effects of mixing divalent and trivalent metal ions in a single precipitate. From this, we find the resulting materials to mainly resemble the amorphous MIIIPPis unless the FeIII![[thin space (1/6-em)]](https://www.rsc.org/images/entities/char_2009.gif) :
:![[thin space (1/6-em)]](https://www.rsc.org/images/entities/char_2009.gif) MII ratio is larger than 1
MII ratio is larger than 1![[thin space (1/6-em)]](https://www.rsc.org/images/entities/char_2009.gif) :
:![[thin space (1/6-em)]](https://www.rsc.org/images/entities/char_2009.gif) 5 at which point larger particles tend to form. From EDX analysis we find the components to be homogeneously distributed over the precipitates while ICP-AES analysis indicates overall particle composition to be consistent with what was added during preparation. The difference in crystallinity between MIIPPi and MIIIPPi could be caused by the greater complexity needed for forming an uncharged unit of MIIIPPi compared to MIIPPi, thereby preferring an amorphous structure upon fast precipitation.
5 at which point larger particles tend to form. From EDX analysis we find the components to be homogeneously distributed over the precipitates while ICP-AES analysis indicates overall particle composition to be consistent with what was added during preparation. The difference in crystallinity between MIIPPi and MIIIPPi could be caused by the greater complexity needed for forming an uncharged unit of MIIIPPi compared to MIIPPi, thereby preferring an amorphous structure upon fast precipitation.
Acknowledgements
We thank the following individuals for characterization and analysis: F. Soulimani and M. Versluijs-Helder of the Inorganic Chemistry and Catalysis group at the University of Utrecht for FTIR and XRD measurements, respectively. J. D. Meeldijk of the Electron Microscopy group in Utrecht is thanked for SEM and EDX analysis and H. C. de Waard of the Geolab Analytical services in Utrecht for ICP-AES measurements. We thank Senter Novem for financial support; this work is financially supported by Food Nutrition Delta program grant FND07002.References
- B. Alberts, A. Johnson, J. Lewis, M. Raff, K. Roberts and P. Walter, Molecular Biology of the Cell, Garland Science , 5th edn, 2007 Search PubMed.
- E. Hogfeldt, Stability Constants of Metal-Ion Complexes (Special Publication), 1964 Search PubMed.
- L. G. Sillen and A. E. Martell, Stability Constants of Metal-Ion Complexes (Special Publication), 1970 Search PubMed.
- L. G. Sillen and A. E. Martell, Stability Constants of Metal-Ion Complexes (Special Publication), 1964 Search PubMed.
- J. Belkouch, L. Monceaux, E. Bordes and P. Courtine, Mater. Res. Bull., 1995, 30, 149–160 CrossRef CAS.
- J. Belkouch, B. Taouk, L. Monceaux, E. Bordes, P. Courtine and G. Hecquet, Stud. Surf. Sci. Catal., 1994, 82, 819–828 CrossRef CAS.
- J.-M. Millet and J. C. Vedrine, Appl. Catal., 1991, 76, 209–219 CrossRef CAS.
- G. J. Hutchings, Appl. Catal., 1991, 72, 1–32 CrossRef CAS.
- N. Y. Morozova and N. Y. Selivanova, Russ. J. Inorg. Chem., 1976, 21, 878–879 Search PubMed.
- A. Ait Salah, P. Jozwiak, K. Zaghib, J. Garbarczyk, F. Gendron, A. Mauger and C. M. Julien, Spectrochim. Acta, Part A, 2006, 65, 1007–1013 CrossRef CAS.
- C. S. Ray, X. Fang, M. Karabulut, G. K. Marasinghe and D. E. Day, J. Non-Cryst. Solids, 1999, 249, 1–16 CrossRef CAS.
- U. Gbureck, T. Hölzel, I. Biermann, J. E. Barralet and L. M. Grover, J. Mater. Sci.: Mater. Med., 2008, 19, 1559–1563 CrossRef CAS.
- A. Doat, F. Pelleé and A. Lebugle, J. Solid State Chem., 2005, 178, 2354–2362 CrossRef CAS.
- P. J. Groves, R. M. Wilson, P. A. Dieppe and R. P. Shellis, J. Mater. Sci.: Mater. Med., 2007, 18, 1355–1360 CrossRef CAS.
- G. S. Mandel, P. B. Halverson and N. S. Mandel, Scanning Microsc., 1988, 2, 1177–1188 CAS.
- R. Wegmüller, M. B. Zimmermann, D. Moretti, M. Arnold, W. Langhans and R. F. Hurrell, J. Nutrition, 2004, 134, 3301–3304 Search PubMed.
- M. C. Fidler, T. Walczyk, L. Davidsson, C. Zeder, N. Sakaguchi, L. R. Juneja and R. F. Hurrell, Br. J. Nutr., 2007, 91, 107–112 CrossRef.
- F. M. Hilty, M. Arnold, M. Hilbe, A. Teleki, J. T. N. Knijnenburg, F. Ehrensperger, R. F. Hurrell, S. E. Pratsinis, W. Langhans and M. B. Zimmermann, Nat. Nanotechnol., 2010, 5, 374–380 CrossRef CAS.
- B. Boonchom and N. Phuvongpha, Mater. Lett., 2009, 63, 1709–1711 CrossRef CAS.
- J. Bian, D. Kim and K. Hong, Mater. Lett., 2004, 58, 347–351 CrossRef CAS.
- A. M. El Kady, K. R. Mohamed and G. T. El-Bassyouni, Ceram. Int., 2009, 35, 2933–2942 CrossRef CAS.
- Z. W. Xiao, G. R. Hu, Z. D. Peng, K. Du and X. G. Gao, Chin. Chem. Lett., 2007, 18, 1525–1527 CrossRef CAS.
- R. Pang, C. Li, S. Zhang and Q. Su, Mater. Chem. Phys., 2009, 113, 215–218 CrossRef CAS.
- S. Shen, P. S. Chow, F. Chen, S. Feng and R. B. H. Tan, J. Cryst. Growth, 2006, 292, 136–142 CrossRef CAS.
- L. Hickey, J. T. Kloprogge and R. L. Frost, J. Mater. Sci., 2000, 35, 4347–4355 CrossRef CAS.
- G. Lagaly, O. Mecking and D. Penner, Colloid Polym. Sci., 2001, 279, 1097–1103 CAS.
- R. E. Riman, W. L. Suchanek, K. Byrappa, C-W. Chen, P. Shuk and C. S. Oakes, Solid State Ionics, 2002, 151, 393–402 CrossRef CAS.
- B. Nikoobakht and M. A. El-Sayed, Chem. Mater., 2003, 15, 1957–1962 CrossRef CAS.
- L. Manna, E. C. Scher and A. P. Alivisatos, J. Am. Chem. Soc., 2000, 122, 12700–12706 CrossRef CAS.
- M. Ciopec, C. Muntean, A. Negrea, L. Lupa, P. Negrea and P. Barvinschi, Thermochim. Acta, 2009, 488, 10–16 CrossRef CAS.
- L. K. Elbouaanani, B. Malaman, R. Gerardin and M. Ijjaali, J. Solid State Chem., 2002, 163, 412–420 CrossRef CAS.
- J. Bian, D. Kim and K. Hong, Mater. Lett., 2005, 59, 257–260 CrossRef CAS.
- B. Boonchom and R. Baitahe, Mater. Lett., 2009, 63, 2218–2220 CrossRef CAS.
- P. J. Linstrom and W. G. Mallard, NIST Chemistry WebBook, NIST Standard Reference Database Number, p. 69 Search PubMed.
- B. B. Parekh and M. J. Joshi, Cryst. Res. Technol., 2007, 42, 127–132 CrossRef CAS.
- J. Gómez Morales, R. Rodríguez Clemente and E. Matijević, J. Colloid Interface Sci., 1992, 151, 555–562 CrossRef.
- L. L. Springsteen and E. Matijević, Colloid Polym. Sci., 1989, 267, 1007–1015 CAS.
- T. Ishikawa and E. Matijević, J. Colloid Interface Sci., 1988, 123, 122–128 CrossRef CAS.
- R. B. Wilhelmy and E. Matijevic, Colloids Surf., 1987, 22, 111–131 CrossRef CAS.
| This journal is © The Royal Society of Chemistry 2012 |
