Autothermal reforming of isobutanol
Reetam
Chakrabarti†
,
Jacob S.
Kruger†
,
Richard J.
Hermann
and
Lanny D.
Schmidt
*
Department of Chemical Engineering and Materials Science, University of Minnesota, 421 Washington Ave SE, Minneapolis, MN 55455, USA. E-mail: schmi001@umn.edu; Fax: +1 612 626 7246; Tel: +1 612 625 6391
First published on 7th February 2012
Abstract
Catalytic partial oxidation (CPO) of isobutanol to produce synthesis gas with varying H2/CO ratios has been performed autothermally in a staged millisecond-contact-time reactor. A 1 wt% Rh-1 wt% Ce/α-alumina catalyst was used to carry out CPO of isobutanol over a range of fuel to oxygen ratios (C/O) in ∼20 ms residence times. Steam was added (S/C = 0 to S/C = 3) to promote the water gas shift (WGS) reaction and increase hydrogen production. Without steam addition, the maximum CO and H2 selectivities obtained were greater than 70%. Steam addition increased the maximum hydrogen selectivity to 103%, at C/O = 1 and S/C = 2. Conversion of isobutanol and oxygen was always > 99% at all C/O and S/C ratios after CPO where the autothermal temperatures were typically between 600 and 1000 °C . A 1 wt% Pt–1 wt% Ce catalyst was added downstream of the CPO stage to further reduce the CO and increase the H2 concentrations by the WGS reaction. Addition of the WGS stage resulted in a product stream containing 1.7 to 3 mol% CO at S/C of 2 and 3 which is comparable to the exit stream CO concentration of an industrial high temperature shift catalyst. With steam addition, selectivities to hydrogen greater than 100% were obtained at all C/O ratios, with a maximum of 122% at C/O = 0.9 and S/C = 3. At S/C = 3, the H2/CO ratio increased from ∼3 after the CPO stage to ∼12 after the WGS stage. Also, the WGS catalyst reduced the selectivities of non-equilibrium products like isobutylene and isobutyraldehyde by almost half compared to that after the CPO stage, which can reduce syngas cleanup costs after a reformer. Since the total residence time in the reactor is ∼100 ms and the product distribution can be tuned by addition of steam, this represents a compact and simple system for producing renewable syngas or hydrogen.
1 Introduction
Biomass represents a renewable alternative to fossil fuels to partly fulfil the increasing demand for carbon-based fuels and chemicals. However, the distributed nature of biomass which leads to increased transportation costs and its low energy density compared to fossil fuels represent challenges for large-scale processing to produce biofuels.1 Upgrading biomass to a higher density liquid intermediate reduces transportation costs and is economical for centralized processing. Isobutanol is produced by fermentation of sugars such as glucose and cellulose by different strains of bacteria or yeast.2–4 Efforts are currently underway to commercialize the manufacture of isobutanol by fermentation of different biomass sources.3 Unlike other biofuels such as ethanol, isobutanol has a higher energy-density, lower volatility, and it does not absorb moisture. Transporting a liquid fuel such as isobutanol is more economical than solid biomass, so that operation can be carried out in a central processing location and utilize economies of scale.Gasification of isobutanol by partial oxidation (eqn (1)) produces synthesis gas, a mixture of hydrogen and carbon monoxide.
 | (1) |
Syngas is the starting material for ∼50% of petrochemicals synthesized worldwide.5 Depending upon the H2/CO ratio, different chemicals can be synthesized. For example, a H2/CO = 2 is required for synthesis of Fischer Tropsch diesel and methanol, whereas H2/CO = 1.2 is preferred for mixed alcohols.6 Hydrogen is regarded as an important energy carrier since it is clean and has a high specific energy. High purity hydrogen with low amounts of CO is necessary for fuel cells, which can be used to power vehicles or to generate electricity. To make high purity hydrogen free from CO for fuel cells, the output stream from a reformer containing products such as H2, CO, CO2, H2O is processed by the water gas shift (WGS) reaction (eqn (2)) represented below:
| CO + H2O → H2 + CO2 ΔHr = −41 kJ mol−1 | (2) |
In industry, WGS typically takes place in two stages—a high temperature shift stage on Fe2O3–Cr2O3 at 350–500 °C followed by a low temperature shift stage on Cu–ZnO catalysts at 180–250 °C .7,8 The CO concentration is reduced to about 3–5% after the high temperature shift stage and about 0.5% after the low temperature shift stage. Further CO removal steps include preferential oxidation (PROX) or CO methanation which reduce the CO concentration to ppm levels; ≤50 ppm is desired for PEM fuel cells.9,10
Noble metals such as Rh and Pt have been shown to convert different feedstocks to a high selectivity synthesis gas stream autothermally in milliseconds by catalytic partial oxidation (CPO).6,11–13 This process takes place without the formation of undesired tars or chars. The H2/CO ratio can be manipulated by adjusting the fuel to oxygen ratio and also by addition of steam to drive the WGS reaction. Due to the short contact times involved, heat losses are minimal; making these reactors run close to adiabatic conditions. Hence, the product stream coming from these reactors contains substantial thermal energy which can be used for downstream reactions. In this experiment, we integrate exothermic CPO with a WGS stage without any external heat input to the catalyst. Pt–Ce based catalysts have been shown to equilibrate the WGS reaction at short contact times (order of milliseconds) at temperatures above 550 °C.14 In contrast, commercial WGS catalysts have residence times of the order of seconds. By integrating the noble metal stage and Pt–Ce based WGS stage, we have developed an integrated system which produces CO levels comparable to that after a commercial high temperature shift stage in a total residence time of ∼100 ms. This results in a compact system suitable for small-scale distributed applications or onboard a fuel cell powered vehicle.
The reactions in this integrated system are oxidation of isobutanol (eqn (3)) which provides the necessary heat energy to drive the entire system, endothermic steam reforming (eqn (4)) and the slightly exothermic WGS reaction (eqn (2)), represented below:
| i-C4H9OH + 6O2 → 4CO2 + 5H2O ΔHr = −2500 kJ mol−1 | (3) |
| i-C4H9OH + 3H2O →4CO + 8H2 ΔHr = 566 kJ mol−1 | (4) |
In addition to the above products, hydrocarbon-based products such as methane, ethylene, ethane, propylene, propane, acetone, propanaldehyde, isobutylene, cis- and trans-2-butene and isobutyraldehyde are also formed. Thermodynamic equilibrium at reactor temperatures exclusively predicts syngas and combustion products with small amounts of methane (≤ 1% at C/O ≤ 1) and negligible selectivities to the other non-equilibrium products (≤ 0.1%). These undesired products become significant with decreasing temperatures in a CPO reactor and they tend to further react to form tars and chars. Since these products are not likely to desorb on the rhodium surface, their formation may be attributed mostly to homogeneous chemistry within the reactor.15 The above three equations can be combined to give the overall reaction (eqn (5)) for the integrated system consisting of CPO and WGS.
 | (5) |
In this work, we convert isobutanol to a high selectivity synthesis gas stream using Rh–Ce based catalysts. The effect of different fuel to oxygen ratios was studied to maximize syngas yields. Additionally, the effect of steam addition to drive the WGS reaction was investigated. To produce a high purity hydrogen stream free from CO for fuel cell applications, a Pt–Ce based WGS catalyst was added downstream of the Rh–Ce catalyst. This resulted in a stream containing ∼2% CO.
2 Experimental
A schematic of the reactor configuration is shown in Fig. 1. Experiments were carried out in a 19 mm I.D. quartz tube. Isobutanol was fed in through a HPLC pump (Chromtech) and water was fed through a syringe pump. Both isobutanol and water were vaporized by a resistively heated rod maintained at ∼200 °C . Gases were fed to the reactor at a controlled flow rate by mass flow controllers accurate to within ± 2%. The catalyst consisted of 5 g of 1%Rh–1%Ce supported on 1.3 mm α-Al2O3 spheres. Uncoated 80 ppi α-Al2O3 monoliths (17 mm diameter, 10 mm long) were used as front and back heat shields to minimize heat losses due to radiation. The reactor tube was wrapped in 2 cm thick insulation to minimize heat losses. 30 mm downstream of the back heat shield, 15 g of 1%Pt–1%Ce supported on 1.3 mm α-Al2O3 catalyst was placed for WGS. Products were analyzed after each stage with a HP 5890 Series II GC. The temperature at the back of the CPO stage and at the top and back of the WGS stage were measured with type-K thermocouples. Catalysts were run for up to 20 h without any observable deactivation.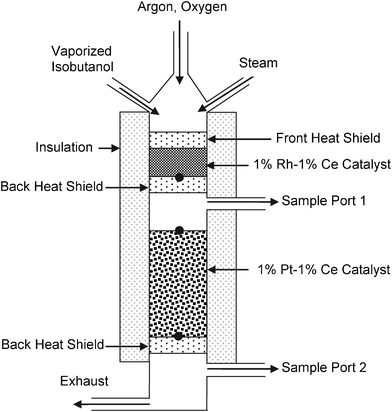 | ||
| Fig. 1 Reactor configuration for autothermal catalytic partial oxidation of isobutanol. Black circles indicate positions of thermocouples. | ||
2.1 Catalyst preparation
The CPO catalyst consisted of 1 wt% Rh–1 wt% Ce supported on 1.3 mm α-Al2O3 spheres while the WGS catalyst consisted of 1 wt% Pt–1 wt% Ce supported on 1.3 mm α-Al2O3 spheres. Both the catalysts were prepared by the incipient wetness technique using rhodium nitrate, cerium nitrate and chloroplatinic acid as precursors for Rh, Ce and Pt respectively, as described previously.16 Catalysts were dried in a vacuum oven. The Rh–Ce catalyst was calcined in a furnace at 800 °C for 6 h and the Pt–Ce catalyst was reduced at 500 °C in a 5% H2 atmosphere for 6 h.2.2 Product analysis
Products were analyzed after each stage with a HP 5890 Series II GC with thermal conductivity and flame ionization detectors, and a 60 m Plot-Q column. Argon was used as an internal standard. Water flow rate was quantified by closing the hydrogen and oxygen balances and averaging the two. Carbon, hydrogen and oxygen balances typically closed with ± 10%. Each data point represents the average of three runs. 95% confidence intervals were typically less than 5%. Selectivities to carbon-based products were defined on a carbon-basis and selectivities to H2 and H2O on a hydrogen basis. Selectivity (C or H) to a species was defined as the number of atoms of C or H in a species divided by the total number of atoms of carbon or hydrogen in the fuel, respectively. Steam, which was co-fed was not considered fuel, and made it possible to obtain H2 selectivities greater than 100%. Equilibrium calculations were performed with HSC 7.1 software by minimizing Gibbs free energy.3 Results
For all the experiments presented, the backface temperature of the catalyst was less than 1000 °C to limit deactivation due to sintering. In all experiments, the flow rate of isobutanol was 0.65 ml min−1. The results are reported after the CPO stage and after the WGS stage. For each of the two configurations, the fuel to oxygen ratio and the steam to carbon ratio was varied. The C/O ratio is defined as the ratio of number of carbon atoms in the fuel to number of oxygen atoms in the O2 feed. Argon was used as a substitute nitrogen in air; the ratio of argon to oxygen corresponded to air stoichiometry (79![[thin space (1/6-em)]](https://www.rsc.org/images/entities/char_2009.gif) :
:![[thin space (1/6-em)]](https://www.rsc.org/images/entities/char_2009.gif) 21). The steam to carbon ratio (S/C) is defined as the ratio of molar flow rates of steam to that of carbon in the fuel.
21). The steam to carbon ratio (S/C) is defined as the ratio of molar flow rates of steam to that of carbon in the fuel.
3.1 CPO of isobutanol
For all the conditions studied, the conversion of isobutanol and oxygen at all C/O ratios and S/C ratios was greater than 99%. The results of CPO of isobutanol are shown in Fig. 2. At low C/O ratios, nearly equilibrium product selectivities were obtained. The hydrogen selectivities for different C/O and S/C ratios are shown in Panel A. At all S/C ratios, the hydrogen selectivity passes through a maximum. At lower C/O ratios, combustion chemistry dominates, which reduces H2 selectivity, whereas at higher C/O ratios, reforming activity is suppressed due to lower temperatures (Panel B), which also reduces H2 selectivity. Steam addition from S/C = 0 to S/C = 2 caused an increase in hydrogen selectivities due to increased WGS activity. Hydrogen selectivities greater than 100% were observed at C/O = 1 and 1.1 for S/C = 2. Further addition of steam (S/C) = 3, decreased hydrogen selectivities, most likely due to quenching of the reactor from steam addition, which lowers temperatures and inhibits syngas-producing reforming reactions.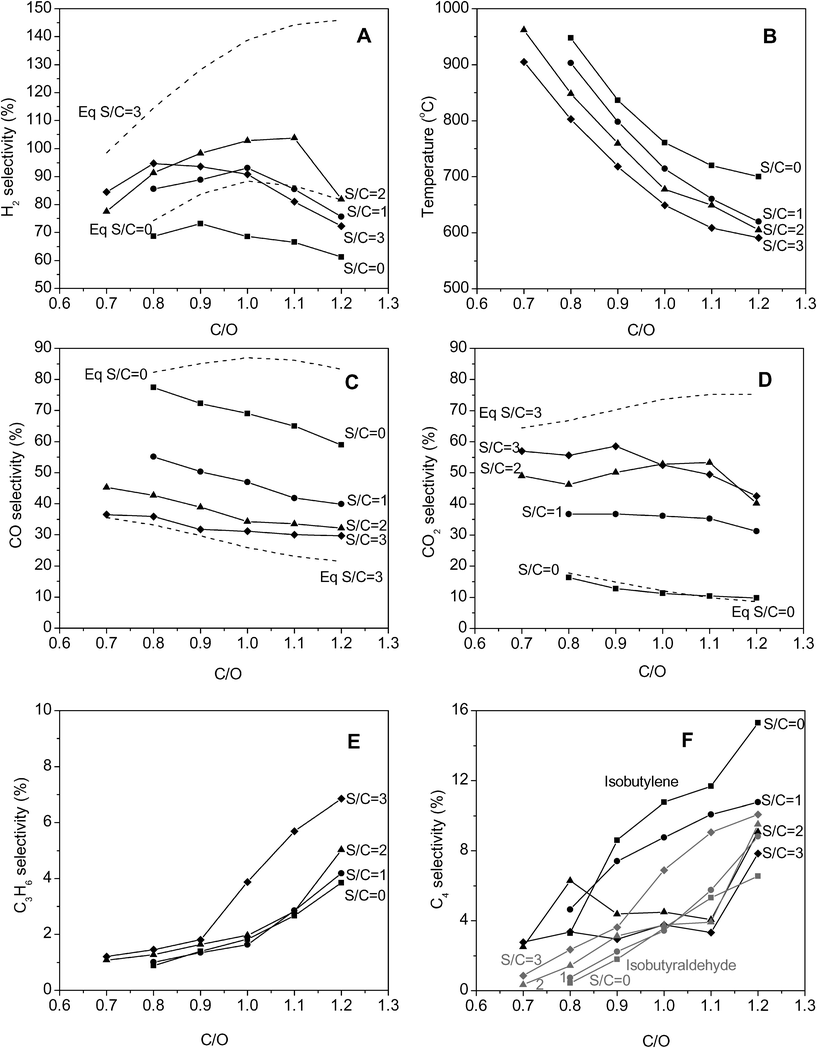 | ||
| Fig. 2 Product distributions and temperatures from catalytic partial oxidation of isobutanol. ■ represent S/C = 0, ● S/C = 1, ▲ S/C = 2 and ◆ S/C = 3. Dashed lines represent equilibrium values at S/C = 0 and 3, calculated at the catalyst backface temperature. | ||
The temperatures in the reactor decreased with both increasing C/O and S/C ratios (Panel B). Backface temperatures within the catalyst bed ranged from ∼950 °C to 600 °C. At S/C ≤ 1, at C/O = 0.7, the backface temperature was greater than 1000 °C , hence this regime was not investigated. Since experiments were carried out at a constant fuel flow rate, greatest decline in temperatures was observed from C/O of 0.7 to 0.8 (∼100 °C) compared to ∼20 °C from 1.1 to 1.2.
Similar to the trends in temperatures, the CO selectivities decreased with increasing C/O and increasing S/C ratios (Panel C). At a S/C = 0, CO selectivities ranged from 77% (C/O = 0.8) to 59% (C/O = 1.2), whereas at S/C = 3, they varied from 37% (C/O = 0.7) to 30% (C/O = 1.2). At the same C/O ratio, CO2 selectivities increased with increasing steam addition due to increased WGS and reduced reforming as a result of lower temperatures (Panel D). At S/C = 0, CO2 selectivities ranged from 16% (C/O = 0.8) to 10% (C/O = 1.2), whereas at S/C = 3, they ranged from 57% (C/O = 0.7) to 43% (C/O = 1.2).
Non-equilibrium products from isobutanol CPO included ethylene, ethane, propylene, propane, isobutylene, cis- and trans-2-butene, acetone, propanal and isobutyraldehyde. At a given S/C ratio, their selectivities increased with increasing C/O ratios due to reduced reforming activity at lower temperatures. Propylene, isobutyraldehyde and isobutylene were generally the major non-equilibrium products. Propylene selectivities were mostly invariant to steam addition and were generally 5% or lower (Panel E). Isobutylene selectivities decreased with steam addition whereas isobutyraldehyde selectivities increased (Panel F).
3.2 Addition of WGS stage
A 1% Pt–1% Ce/α-alumina catalyst was placed 30 mm downstream of the CPO catalyst to produce a high purity hydrogen stream. The product distributions are shown in Fig. 3. The hydrogen selectivities obtained with this staged reactor system are shown in Panel A. The hydrogen selectivities were higher than that with just the CPO stage and increased with addition of steam due to more favorable equilibrium of the WGS reaction. As with the CPO stage, for a given S/C ratio, the hydrogen selectivites displayed a maximum at a particular C/O ratio. Without any steam addition (S/C = 0), the highest H2 selectivity obtained was 84% at a C/O of 0.9. With steam addition, H2 selectivities were generally greater than 100%. The highest hydrogen selectivity of 122% was obtained at a C/O of 0.9 and S/C = 3 as compared to the theoretical maximum of 180% as predicted by eqn (5).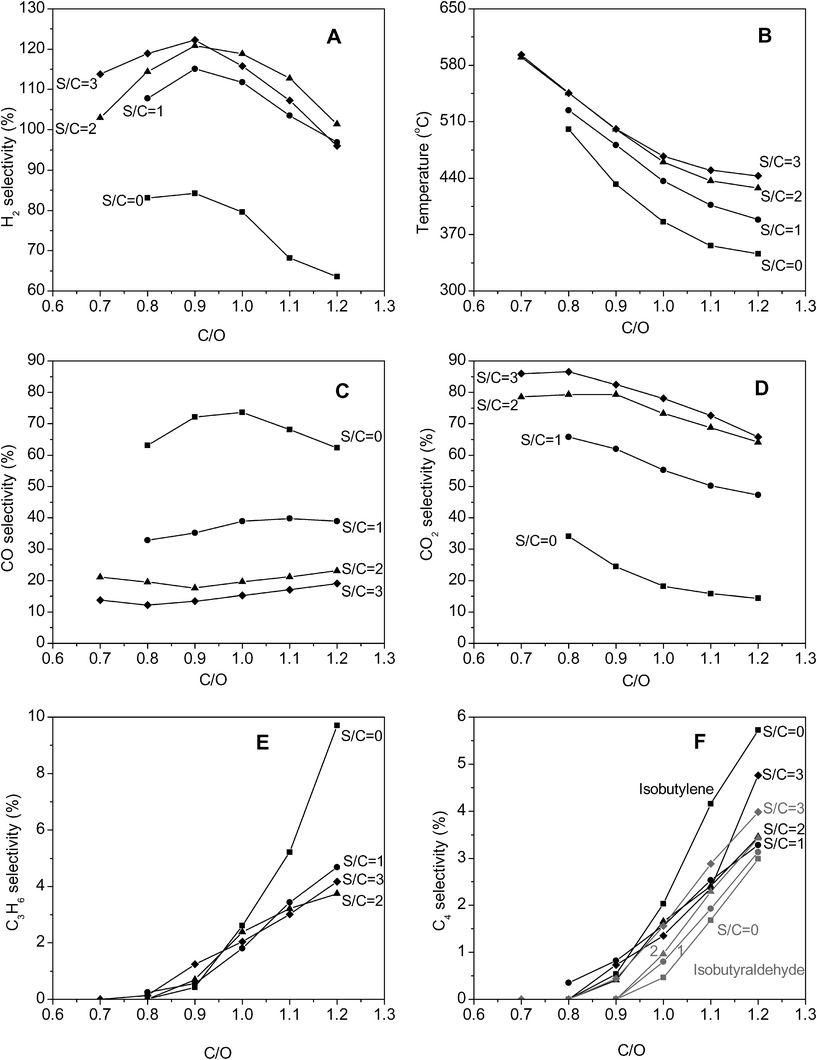 | ||
| Fig. 3 Product distributions and temperatures from WGS after catalytic partial oxidation of isobutanol. ■ represent S/C = 0, ● S/C = 1, ▲ S/C = 2 and ◆ S/C = 3. | ||
The backface temperatures in the WGS stage are shown in Panel B. At a given C/O ratio, from S/C = 0 to S/C = 2, the backface temperature in the WGS stage increased due to the exothermic nature of the WGS reaction and increasing conversion of CO with increasing S/C. Temperatures at S/C = 2 were similar to that at S/C = 3. For a given S/C ratio, temperatures decreased with increasing C/O ratios. The typical difference between the backface temperatures in the CPO stage and outlet of the WGS stage was ∼300 °C .
Similar to the CPO stage, the largest changes in H2, CO and CO2 selectivities were observed from S/C = 0 to S/C = 1. The CO and CO2 selectivities are shown in Panels C and D respectively. At S/C = 0, at C/O ratios greater than 0.9, the CO selectivities were similar to that with just the CPO stage due to negligible shift activity in the WGS stage. As S/C ratios increased, the amount of CO converted in the shift stage increased, reducing CO selectivities. The lowest CO selectivity of ∼12% was obtained at a C/O of 0.8 and S/C ratio of 3. CO2 selectivities decreased with increasing C/O ratio and increased with increasing S/C ratio. The WGS stage also resulted in reduced concentrations of isobutyraldehyde and isobutylene (Panel F) while propylene selectivities were mostly unchanged (Panel E).
The CO conversion in the WGS stage increased with an increasing amount of steam and was higher at lower C/O ratios as shown in Fig. 4. The highest CO conversion was 66% at C/O = 0.8 and S/C = 3. The WGS reaction was close to equilibrium (Kobs/Keq ≥ 0.75) at temperatures greater than 530 °C. Increasing the amount of steam results in a more favorable equilibrium conversion, whereas decreasing C/O ratios led to higher temperatures which led to more favorable kinetics driving the reaction to equilibrium.
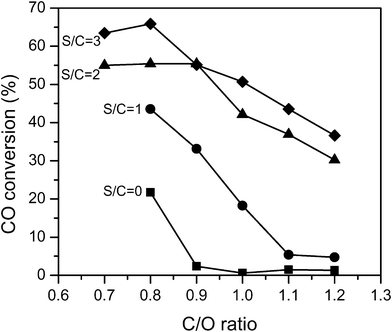 | ||
| Fig. 4 CO conversion in the water gas shift stage. ■ represents S/C = 0, ● S/C = 1, ▲ S/C = 2 and ◆ S/C = 3. | ||
4 Discussion
4.1 CPO stage
The Rh–Ce based catalyst produced high yields of synthesis gas with > 99% conversion of isobutanol and oxygen. At low C/O ratios (C/O ≤ 0.9), nearly equilibrium syngas products were obtained while non-equilibrium products became significant at high C/O ratios. Similar results in terms of high syngas selectivities and conversions have been observed with Rh–Ce based catalysts with other oxygenated fuels.17,18 The formation of non-equilibrium products can be attributed mostly to homogeneous gas-phase chemistry; since they have a low tendency to desorb from the rhodium surface and their adsorption on the rhodium surface generally leads to syngas formation.15In the C/O range of interest, the range of temperatures at a given S/C ratio was about 250–300 °C. CPO has been shown to occur in two stages: oxidation and reforming; >99% of the oxygen is consumed within ∼2 mm.19 With increasing C/O ratios, conversion of the fuel starts to spread out as compared to occurring mostly within the oxidation zone at low C/O ratios.18 The absence of oxygen in the reforming zone at high C/O ratios and lower temperatures results in slower surface kinetics and increased formation of homogeneous non-equilibrium products from isobutanol. At lower C/O ratios closer to the combustion stoichiometry, higher temperatures and faster kinetics on the catalyst surface increase yields to equilibrium products and reduces selectivities to non-equilibrium products.
Steam addition reduced the reactor temperature and caused a significant change in H2, CO, CO2 and H2O selectivities due to increased WGS. The maximum in hydrogen selectivity shifts to a higher C/O ratio from S/C = 0 to S/C = 2 which may be due to the more favorable equilibrium of the WGS reaction at lower temperatures caused by steam addition.
4.2 CPO + WGS
After the WGS stage, the WGS reaction was equilibrated at temperatures greater than 530 °C, consistent with results previously reported by Wheeler et al.14 At S/C ratios of 2 and 3, for most C/O ratios, the CO conversion in the WGS stage was greater than 40% thereby reducing the amount of CO in the exit stream to concentrations comparable to or lower than after an industrial high temperature shift catalyst. Also, selectivities to isobutylene and isobutyraldehyde reduced by almost half, indicating cleanup of hydrocarbons in the WGS stage over the Pt–Ce catalyst, likely due to the steam reforming of hydrocarbons. The reduction in concentrations of isobutylene and isobutyraldehyde as compared to propylene may be attributed to the higher steam reforming activity of larger hydrocarbons.20 In the WGS stage with steam addition, an increase in temperatures was observed with increasing S/C ratios in contrast with the CPO stage where increasing amounts of steam reduced temperatures. The increase in temperatures in the WGS stage may be attributed to the exothermic nature of the WGS reaction and the increasing conversion of CO with increasing S/C ratios.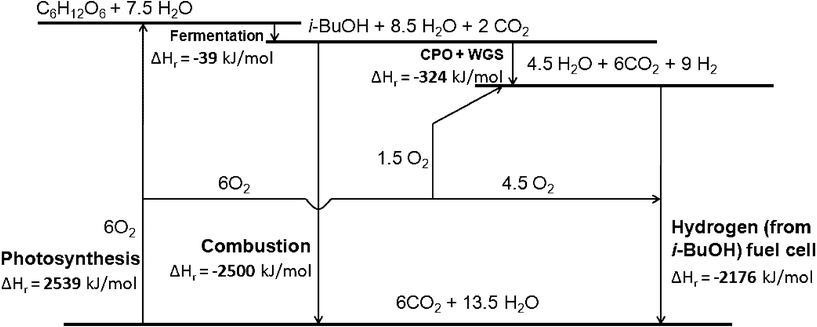 | ||
| Fig. 5 Thermodynamic analysis of the current system including photosynthesis, fermentation, CPO-WGS, hydrogen use in fuel cell and combustion. | ||
5 Conclusions
CPO of isobutanol was carried out in an autothermal millisecond contact time reactor with > 99% conversion of isobutanol over a 1% Rh–1% Ce catalyst. The H2 and CO yields could be adjusted by varying the fuel to oxygen ratio and also by adding steam. Steam addition promoted the WGS reaction and significantly increased yields of H2. In addition, a WGS stage consisting of 1% Pt–1% Ce was added downstream over the CPO stage, which resulted in H2/CO ratio of ∼ 12 and a CO concentration of about 1.7–3%, with negligible yields of non-equilibrium products (≤1%). Thus, this integrated autothermal system producing high yields of hydrogen in residence times less than 100 ms represents an attractive option as an onboard reformer or other portable systems.Acknowledgements
We acknowledge funding for this research provided by the Department of Defense (DOD) through Fuel Cell Energy, Inc. in Danbury, CT. We would like to thank Stephen Jolly (Fuel Cell Energy) for valuable discussions and Dr. Brian Michael for help with setup of experiments.References
- Y. Yu, J. Bartle, C.-Z. Li and H. Wu, Energy Fuels, 2009, 23, 3290–3299 Search PubMed.
- C. Weber, A. Farwick, F. Benisch, D. Brat, H. Dietz, T. Subtil and E. Boles, Appl. Microbiol. Biotechnol., 2010, 87, 1303–1315 CrossRef CAS.
- N. Savage, Nature, 2011, 474, S9–S11 CrossRef CAS.
- S. Atsumi, T. Hanai and J. C. Liao, Nature, 2008, 451, 86 CrossRef CAS.
- E. R. Riegel and J. A. Kent, Riegel's Handbook of Industrial Chemistry, Kluwer Academic/Plenum Publishers: New York, NY, Tenth edn, 2003 Search PubMed.
- J. L. Colby, P. J. Dauenhauer and L. D. Schmidt, Green Chem., 2008, 10, 773–783 RSC.
- C. Ratnasamy and J. Wagner, Catal. Rev. Sci. Eng., July 2009, 51, 325–440 Search PubMed 116.
- D. Trimm, Appl. Catal., A, 2005, 296, 1–11 CrossRef CAS.
- A. S. Chellappa, C. M. Fischer and W. J. Thomson, Appl. Catal., A, 2002, 227, 231–240 CrossRef CAS.
- J. M. Zalc and D. G. Lffler, J. Power Sources, 2002, 111, 58–64 CrossRef.
- J. R. Salge, B. J. Dreyer, P. J. Dauenhauer and L. D. Schmidt, Science, 2006, 314, 801–804 CrossRef CAS.
- P. J. Dauenhauer, B. J. Dreyer, N. J. Degenstein and L. D. Schmidt, Angew. Chem., Int. Ed., 2007, 46, 5864–5867 CrossRef CAS.
- D. A. Hickman and L. D. Schmidt, Science, 1993, 259, 343–346 CrossRef CAS.
- C. Wheeler, A. Jhalani, E. J. Klein, S. Tummala and L. D. Schmidt, J. Catal., 2004, 223, 191–199 CrossRef CAS.
- J. S. Kruger, R. Chakrabarti, R. J. Hermann and L. D. Schmidt, Appl. Catal., A, 2012, 411–412, 87–94 Search PubMed.
- A. Bodke, S. Bharadwaj and L. Schmidt, J. Catal., 1998, 179, 138–149 CrossRef CAS.
- J. Salge, G. Deluga and L. Schmidt, J. Catal., 2005, 235, 69–78 CrossRef CAS.
- P. Dauenhauer, J. Salge and L. Schmidt, J. Catal., 2006, 244, 238–247 CrossRef CAS.
- R. Horn, K. Williams, N. Degenstein, A. Bitsch-Larsen, D. D. Nogare, S. Tupy and L. Schmidt, J. Catal., 2007, 249, 380–393 CrossRef CAS.
- X. Wang and R. Gorte, Appl. Catal., A, 2002, 224, 209–218 CrossRef CAS.
- G. A. Deluga, J. R. Salge, L. D. Schmidt and X. E. Verykios, Science, 2004, 303, 993–997 CrossRef CAS.
- B. C. Michael, A. Donazzi and L. D. Schmidt, J. Catal., 2009, 265, 117–129 CrossRef CAS.
Footnote |
| † These authors contributed equally to this work. |
| This journal is © The Royal Society of Chemistry 2012 |
