Fluorite-pyrochlore transformation in Eu2Zr2O7—direct calorimetric measurement of phase transition, formation and surface enthalpies
M. P.
Saradhi
,
S. V.
Ushakov
and
A.
Navrotsky
*
Peter A Rock Thermochemistry Laboratory and NEAT ORU, University of California Davis, Davis, 95616, California. E-mail: anavrotsky@ucdavis.edu
First published on 24th February 2012
Abstract
The energetics of the order-disorder phase transformation in the binary oxide system, Eu2O3–ZrO2, is studied by powder X-ray diffraction and high temperature drop solution calorimetry. The nanocrystalline defect fluorite phase of Eu2Zr2O7 is synthesized on crystallization of an amorphous precursor from aqueous precipitation. The defect fluorite transforms to an ordered pyrochlore above 1200 °C. Aerodynamic levitation combined with laser heating is used to prepare coarse defect fluorite, which is otherwise impossible by conventional synthesis techniques. Formation enthalpies from oxides are −62.4 ± 2.6 and −24.6 ± 3.7 kJ mol−1 for the pyrochlore and defect fluorite phase, respectively. The transformation enthalpy from pyrochlore to defect flourite in the coarse sample is 37.8 ± 3.1 kJ mol−1 at 25 °C. The enthalpy of water vapor adsorption on the surface of the nanocrystalline defect fluorite Eu2Zr2O7 is −75 ± 2.5 kJ mol−1 H2O for coverage of 9.5 ± 0.8 H2O/nm2. The calculated surface enthalpies for the anhydrous and hydrous surfaces of defect fluorite Eu2Zr2O7 are 1.47 ± 0.13 and 1.01 ± 0.15 J m−2, respectively.
1. Introduction
The equilibrium phase diagram of Ln2O3–ZrO2 has been investigated by many researchers over a number of years.1–5 The allied structures of the phases in these systems change from fluorite-type (BO2) to the structure of the A2O3-type with increase in lanthanide content. At lower temperatures, (∼1200 to 1500 °C) pyrochlore phases (Ln2Zr2O7) form based on the ordered cubic fluorite.The Ln2Zr2O7 [Ln = lanthanide] type phases are of great interest. These compounds adopt a defect fluorite structure (F) with space group: Fm3m, or a pyrochlore structure (P) with space group: Fd3m, depending on the size of Ln3+ cation.6,7 The ‘P’ structure can be considered as being derived from the ‘F’ structure by removing one eighth of the anions in such a way that the vacancies constitute a diamond sublattice. Many of these phases undergo a high-temperature order-disorder (P→F) phase transformation at elevated temperatures (1530–2400 °C),8–10 which has a strong influence on their physical properties.
Due to the extensive compositional range of possible compounds between Ln2O3 and ZrO2 exhibiting ‘F’ or ‘P’ structure, there are a variety of potential applications for these materials viz., dielectric materials, host materials for fluorescence centers,11,12 catalysts,14,15 and fuel cell electrolyte materials.7,15,16 The highest ionic conductivity is observed in the compounds Ln2Zr2O7 (Ln = Sm-Gd), which lie near the ‘P’ to ‘F’ phase boundary.17 In addition, these materials are also developed for thermal barrier coatings due to their low thermal conductivity and high thermal stability.18,19
It is known that the lighter lanthanide zirconates are good for thermal barrier coatings,20 whereas heavier lanthanide zirconates are good for oxide ion conduction.17 The phase transformation from P→F disorders oxygen vacancies and provides extra paths for oxide-ion movement thus increasing ionic and thermal conductivity.
The degree of cation disorder is not only related to the difference in ionic radius between Ln3+ and Zr4+, but can also be induced by systematic doping with small amounts of cations of different sizes, for example, (Yb0.91Sc0.09)2Ti2O7.21 Ln2Ti2O7 (Ln = Tm-Lu), and Gd2M2O7 (M = Zr, Hf) compounds prepared by co-precipitation showed low-temperature (800–1000 °C) F→P transformations.22–26 Though the thermodynamic driving force behind such phase transformation is not well understood quantitatively, this phase transformation greatly influences thermophysical properties and oxide-ion conduction.19 Thus, a better understanding of the phase transformation energetics is critical for long-term predictions of material stability in these potential applications.
In the present study, we deal with one such compound in Ln2Zr2O7 which lies close to the P to F stability boundary. We study the energetics of phase transformation, formation enthalpies, and surface enthalpy for the first time using high temperature oxide melt solution calorimetry.27–30 Among the rare-earth zirconates, Eu2Zr2O7 received considerable attention because of its high ionic conductivity.23,24 The low temperature (4 to 400 K) heat capacity of Eu2Zr2O7 was measured by Lutique et al. by adiabatic calorimeter.31 Korneev et al. measured the enthalpy of formation of Eu2Zr2O7 from oxides using combustion bomb calorimeter to be –79.95 kJ mol−1.32
2. Experimental section
2.1 Synthesis
Conventional high temperature solid state reaction for the synthesis of Ln–Zr–O phases requires repeated heating and grinding of the constituent oxides at very high temperatures, viz., 1600 °C, for several hours. In the present study, the defect ‘F’ Eu2Zr2O7 phase was synthesized by co-precipitation (Fig. 1).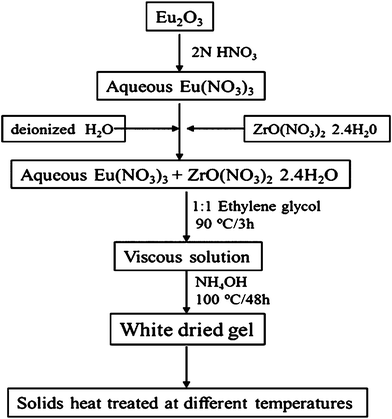 | ||
| Fig. 1 Flow chart of experimental procedures for the synthesis of Eu2Zr2O7. | ||
Co-precipitation is a useful method for the preparation of finely divided mixed oxides, and is capable of achieving a high degree of homogeneity and small grain size. Stoichiometric amounts of high purity ZrO(NO3)2·2.4H2O (Alfa Aesar; 99.9%) and Eu2O3 (Alfa Aesar; 99.9%) were dissolved in 2N HNO3. Polyethylene glycol (Alfa Aesar, PEG 400) was added to the metal nitrate solution in 1![[thin space (1/6-em)]](https://www.rsc.org/images/entities/char_2009.gif) :
:![[thin space (1/6-em)]](https://www.rsc.org/images/entities/char_2009.gif) 1 molar ratio and the mixture stirred at 60 °C for 3 h. The resulting solution was co-precipitated by drop-wise addition of dilute NH4OH with constant stirring until the pH of the solution reached 11. Upon completion of the precipitation, the slurry was dried at 100 °C overnight. The obtained precursor was fired at 800 °C/3 h, 800 °C/6 h, 1000 °C/3 h, 1000 °C/6 h, 1200 °C/3 h, and 1400 °C/3 h, and phase identification was carried out at each stage of the reaction using powder X-ray diffraction (XRD). Eu2Zr2O7 ‘P’ phase was synthesized by high temperature solid state reaction. High purity Eu2O3 (Alfa Aesar; 99.9%) and ZrO2 (Aldrich; 99.99%) were ground well, placed in a platinum crucible, and heated to 1550 °C for 24 h inside a muffle furnace. The precursors, Eu2O3 and ZrO2, were preheated over night at 1000 °C to remove adsorbed water and carbon dioxide.
1 molar ratio and the mixture stirred at 60 °C for 3 h. The resulting solution was co-precipitated by drop-wise addition of dilute NH4OH with constant stirring until the pH of the solution reached 11. Upon completion of the precipitation, the slurry was dried at 100 °C overnight. The obtained precursor was fired at 800 °C/3 h, 800 °C/6 h, 1000 °C/3 h, 1000 °C/6 h, 1200 °C/3 h, and 1400 °C/3 h, and phase identification was carried out at each stage of the reaction using powder X-ray diffraction (XRD). Eu2Zr2O7 ‘P’ phase was synthesized by high temperature solid state reaction. High purity Eu2O3 (Alfa Aesar; 99.9%) and ZrO2 (Aldrich; 99.99%) were ground well, placed in a platinum crucible, and heated to 1550 °C for 24 h inside a muffle furnace. The precursors, Eu2O3 and ZrO2, were preheated over night at 1000 °C to remove adsorbed water and carbon dioxide.
The bulk defect ‘F’ phase was prepared by aerodynamic levitation combined with laser heating. This technique uses gas pressure to levitate materials so that they are not in physical contact with any container. This removes contamination issues associated with the use of a container, particularly at very high temperatures. This technique provides quench rates up to ∼700 °C s−1 and eliminates the possibility of heterogeneous nucleation on container surfaces. Spherical samples of 2–3 mm diameters were prepared by melting Eu2Zr2O7 ‘P’ by laser hearth melting. The as-melted spherical beads were then levitated in a stream of pure oxygen, and re-melted using a continuous-wave CO2 laser. The levitated molten beads were quenched from ∼2700 °C by blocking the laser beam leading to their crystallization; temperature was monitored using optical pyrometer. Upon quenching, the defect ‘F’ phase of Eu2Zr2O7 was formed. Annealing at 1550 °C/24 h transformed the material to the ordered ‘P’ phase.
2.2 Characterization and calorimetry
Powder XRD patterns were recorded on a Bruker D8 diffractometer with a rotating sample stage attachment using Cu-Kα radiation. The crystallite size of samples synthesized at different temperatures was calculated from diffraction peak broadening using a whole profile fitting procedure (Jade v6.11, 2002, Materials Data Inc., Livermore, CA). A Micromeritics ASAP 2020 instrument (Micromeritics, Norcross, GA, USA) was used to measure the Brunauer-Emmett-Teller (BET) surface areas of nanocrystallite phases from the nitrogen adsorption isotherm. Ten-point adsorption isotherms of nitrogen were collected in the P/P° relative pressure range (P° = saturation pressure) of 0.05–0.03 at 77 K. This instrument was also used to dose water vapor into custom made cells for the Setaram DSC 111 Calvet calorimeters (Setaram Instrumentation, Caluire, France) to measure the enthalpy of water adsorption at 25 °C. The adsorbent is placed into one side of the quartz forked sample tube, which fits into twin micro-calorimeter cells. The other side of the fork is left empty to serve as a reference. A correction from a blank run is applied to integral value to account for water vapor adsorbed on the instrument manifold and on the walls of the sample fork tube. Prior to gas adsorption experiments, all samples were degassed at 400 °C for 4 h in order to remove adsorbed H2O and other gases. Two types of calorimetric experiments were performed in order to calculate both formation and surface enthalpies. The drop solution enthalpy of samples with the same bulk composition, but different surface areas was determined by high temperature drop solution calorimetry in molten sodium molybdate solvent (3Na2O•4MoO3) at 702 °C. Oxygen gas was flushed through the calorimeter assembly and bubbled through the solvent throughout the experiment at rates of 40 and 10 ml min−1, respectively. Standard calibration against the heat content of α-Al2O3 was used. Before the drop solution experiments, all samples were equilibrated at 24 ± 1 °C and 50 ± 5% humidity to prepare a H2O-equilibrated surface. The water content of the equilibrated samples was determined by weight loss after annealing at 1200 °C/6 h. An average from four experiments was used for each sample. The calculation of surface energy from high temperature drop solution calorimetry data was completed according to an earlier study.27–303. Results and discussion
3.1 Phase formation
All the synthesized phases were analysed by powder X-ray diffraction combined with Rietveld refinement. The Rietveld analysis revealed a single phase with a cubic structure corresponding to the stoichiometric composition, no second phase could be detected in any of the samples. The powder XRD patterns of the Eu2Zr2O7 precursor fired at different temperatures are shown in Fig. 2. All diffraction patterns are indexed based on the cubic defect ‘F’ unit cell. It is known that the higher intensity reflections (222), (400), (440) and (622) can also be indexed on the basis of both defect ‘F’ and ‘P’ structures. The presence of superlattice reflections, (111), (311), (331) and (511), indicates the doubling of the cubic unit cell and is characteristic of the ‘P’ structure, distinguishing it from ‘F’ structure. However, in the present case, the characteristic ‘P’ superlattice reflections are low in intensity and appear only for samples annealed at 1200 °C. For example, the appearance of superlattice reflections or phase transition from ‘F’ to ‘P’ for the compounds Ln2Zr2O7 and Ln2Hf2O7 [Ln = Eu, Gd] is observed above 1200 °C.12,23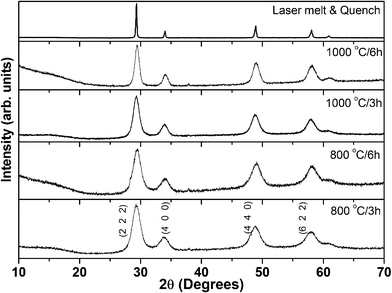 | ||
| Fig. 2 Powder X-ray diffraction patterns of Eu2Zr2O7 annealed at various reaction temperatures. All the patterns are indexed based on cubic defect fluorite structure, JCPDS No. 78–1292. | ||
Powder XRD patterns of samples annealed at 800 and 1000 °C are broad due to small crystallite size, and are dominated by defect ‘F’ reflections. As the reaction temperature increases from 1000 to 1400 °C, superlattice reflections start appearing: (111), (311) [weak], and (331), (511) [significant]. This indicates the formation of the ordered cubic ‘P’ structure. The powder X-ray patterns of furnace annealed samples at 1200 °C and above, are shown in Fig. 3. Since the defect ‘F’ structure transforms to the ‘P’ structure at high temperatures, it can be concluded that the preparation of the bulk defect ‘F’ may be a daunting task. However, the laser melt and quench technique enables us to synthesize the desired bulk defect ‘F’ phase, which is not possible by conventional synthesis methods. From XRD (Fig. 2), it is clear that the laser melted and quenched sample crystallizes with defect ‘F’ structure. The obtained refinement factors and the lattice parameters are given in Table 1. The lattice constant of fluorite/pyrochlore match well with those reported in the literature.
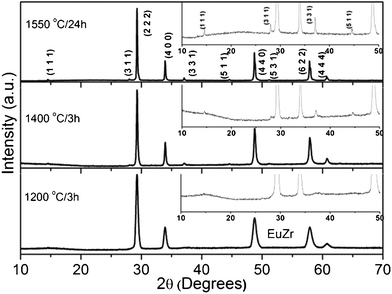 | ||
| Fig. 3 Powder X-ray diffraction patterns of pyrochlore Eu2Zr2O7. All the patterns are indexed based on cubic pyrochlore structure, JCPDS No. 24–0418. | ||
| Eu2Zr2O7 Temp. (°C) | Space group | Lattice constant (Å) | χ 2 (%) | Bragg R-factor (%) |
|---|---|---|---|---|
| For comparison the lattice constants for pyrochlore phases are given based on the fluorite phase. | ||||
| 800/3 h (F) | Fm3m | 5.276 (4) | 3.91 | 1.45 |
| 800/6 h (F) | Fm3m | 5.260 (5) | 5.62 | 2.98 |
| 1000/3 h (F) | Fm3m | 5.279 (4) | 5.17 | 1.05 |
| 1000/6 h (F) | Fm3m | 5.270 (3) | 5.99 | 3.01 |
| 1200/3 h (P) | Fd3m | 5.274 (2) | 5.68 | 2.83 |
| 1400/3 h (P) | Fd3m | 5.279 (9) | 8.96 | 3.62 |
| 1550/24 h (P) | Fd3m | 5.282 (1) | 6.51 | 2.63 |
| Melt quench (F) | Fm3m | 5.270 (5) | 5.19 | 3.21 |
The formation of ‘P’ or defect ‘F’ structures is essentially determined by the ratio of the A and B cation radii in A2B2O7. It is well known that cations of similar radii are prone to crystallize in the disordered ‘F’ phase instead of the ordered ‘P’ phase. In the case of zirconates, Gd2Zr2O7 with rc.n.=8(Gd3+)/rc.n.=8(Zr4+) = 1.26 is considered a phase boundary between ‘P’ and ‘F’.25 Since the radius ratio rc.n.=8(Eu3+)/rc.n.=8(Zr4+) = 1.27 is close to this boundary, it can be formed as either the F-type or the P-type, depending on the thermal history and synthesis method.12 In our earlier container-less quenching studies, ‘P’ phase La2Hf2O7 (radius ratio: 1.39) and defect ‘F’ phase in Gd2O3–HfO2 solid solutions (radius ratio: 1.26) were observed.26
3.2 Water adsorption calorimetry
In the present study, samples were prepared by co-precipitation to produce small crystallite size. However, nanoparticles of normally ‘inert’ ceramics can be very reactive because of their enhanced surface areas, leading to the bonding of H2O to the surface. Their surface energy can differ greatly from that of the anhydrous surface. It is important to account for chemically and physically adsorbed water in order to deduce accurate formation and surface enthalpies. Based on the nature of the chemical bonding between the adsorbed water molecules with the surface of the adsorbent has been frequently used as a criterion to distinguish chemisorption from physisorption.33,34 If the enthalpy of water adsorption is more negative than −44 kJ mol−1, the enthalpy of water vapor condensation, the adsorption is regarded as chemisorption. If it is at −44 kJ mol−1, the adsorption is regarded as physisorption.33,34 The total adsorbed (total = chemi + physi) water on the nanopowders equilibrated at 24 ± 1 °C and 50 ± 5% humidity is measured by weight loss experiments using furnace heating at 1200 °C/6 h. Fig. 4 shows the total (chemi + physi) amount of adsorbed water in moles vs. BET surface area of samples prepared at different temperatures, showing as is commonly seen, a linear trend.35 Chemically bound water is estimated by incremental water vapor dosing at ∼1 μmol H2O/m2 of total surface area. Summing the enthalpies of adsorption for all doses and dividing by the total number of moles of adsorbed water gives the integral enthalpy of adsorption for a given coverage. Samples with different surface areas listed in Table 4 were used for water adsorption calorimetry. The results, normalized to surface coverage, did not vary.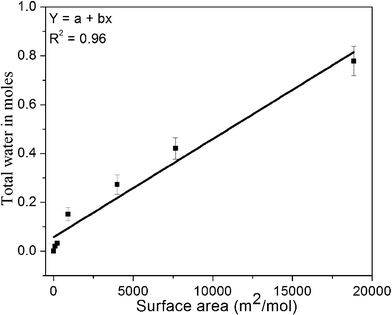 | ||
| Fig. 4 Total water content obtained from weight loss experiments for different samples vs. BET surface area. X-axis error bars are not visible since they are smaller than the symbol size. | ||
The heat of adsorption decreases with increasing H2O coverage (see Fig. 5). The first dose of water vapor gives strongly negative heats of adsorption (−140 kJ mol−1), indicating the strong chemisorption of water on high-energy surface sites. With increasing H2O coverage, the heat of adsorption became less exothermic; and at a coverage of 9 H2O/nm2, it reached −44 kJ mol−1, the enthalpy of condensation of H2O at 25 °C, indicating physisorption of water at higher coverage. The integral enthalpy and surface coverage are calculated as an average of three experiments as −74.9 ± 2.5 kJ mol−1 with coverage of 9.5 ± 0.9 H2O/nm2. These values were used for correction for chemisorbed water (Table 2) to derive enthalpy of anhydrous surface.
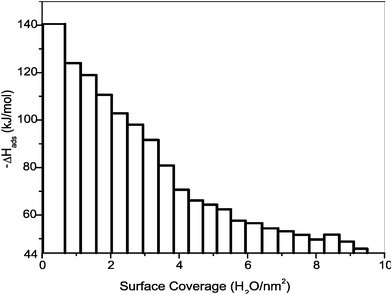 | ||
| Fig. 5 Differential enthalpy of H2O adsorption on the surface of defect fluorite nanoparticles vs. water coverage. Sample synthesized at 800 °C/3 h and degassed at 400 °C/4 h. Total surface area of the sample 2.7 m2. Each bar represents individual dose 2 μmole H2O. | ||
| a Where, ΔH1, ΔH2 and ΔH3 are drop solution enthalpies for ZrO2, Eu2O3.35,36 For convincing calculation the formula weight of defect fluorite was taken as pyrochlore (F.W = 598.37 g mol−1). | |
|---|---|
| Eu2O3 (solid, 298 K) → Eu2O3 (soln, 975 K) | ΔH1 |
| ZrO2 (solid, 298 K) → ZrO2 (soln, 975 K) | ΔH2 |
| Eu2Zr2O7 (solid, 298 K) → Eu2O3 (soln, 975 K) + 2ZrO2 (soln, 975 K) | ΔH3 = ΔHds |
| Eu2O3 (solid, 298 K) + 2ZrO2 (solid, 298 K) → Eu2Zr2O7 (pyr, 298 K) | ΔH4 |
| Enthalpy of formation from the oxides at RT | ΔH4 = ΔHf,ox = ΔH1 + 2ΔH2− ΔH3 |
| Eu2Zr2O7 (flrt, 298 K) → Eu2Zr2O7 (soln, 975 K) | ΔHds(F) = −65.6 ± 2.9 kJ mol−1 |
| Eu2Zr2O7 (pyk, 298 K) → Eu2Zr2O7 (soln, 975 K) | ΔHds(P) = −28.5 ± 1.0 kJ mol−1 |
3.3 High temperature oxide melt drop solution calorimetry
The enthalpy of drop solution (ΔHds) is the sum of the heat content of the sample and its heat of solution in the solvent, plus the heat associated with H2O desorption, and, in the case of nanomaterials, the excess enthalpy related to the surface. The formation enthalpies of the defect ‘F’ and ‘P’ phases are derived from the oxides, Eu2O3 and ZrO2, obtained from the drop solution enthalpies. The thermochemical cycles used for the calculation are given in Table 2. The drop solution enthalpies of the nanopowders are corrected for the heat of water adsorption in two ways. One is by assuming all water is energetically equivalent to liquid water physically adsorbed on the surface. Using this assumption the enthalpy of the hydrous surface can be obtained.27 The other approach is to correct the fraction of water that chemically interacts with the surface (using the measured integral enthalpy of water adsorption) in addition to the physically adsorbed water, thus providing the enthalpy of the anhydrous surface.27 The thermochemical cycles used for the two water corrections are in Table 3. The corrected drop solution enthalpies and formation enthalpies of the defect ‘F’ and ‘P’ phases and estimated amount of chemi- and physisorbed water based on water adsorption calorimetry are given in Table 4. The formation enthalpy of coarse ‘P’ is more negative (−62.4 ± 2.6 kJ mol−1) than coarse defect ‘F’ (−24.6 ± 3.7 kJ mol−1), which means the formation of defect ‘F’ is less favorable than the ‘P’ phase at 25 °C.| a Where, n = total amount of adsorbed water, c = chemically adsorbed water, p = physisorbed water, ΔH5 measured drop solution enthalpy, ΔH11 is measured integral water adsorption enthalpy ΔH6/ΔH8/ΔH10 and ΔH7/ΔH9 are reference values.33 | |
|---|---|
| Eu2Zr2O7nH2O (solid, 298 K) → Eu2Zr2O7 (soln, 975 K) + nH2O (g, 975 K) | ΔH5 = ΔHds |
| Type I: Physically adsorbed water correction (Hydrous surface) | |
| nH2O (g, 975 K) → nH2O (g, 298 K) | ΔH6 = n (−25.0 ± 0.1) kJ mol−1 |
| nH2O (g, 298 K) → nH2O (sur, 298 K) | ΔH7 = n (−44.0 ± 0.1) kJ mol−1 |
| n = total number of mols of water i.e., n = Physi (p) + Chemi (c) | |
| Corrected for hydrated drop solution enthalpy | ΔHhyd = ΔH5 + ΔH6+ΔH7 |
| Type II: Chemically adsorbed water correction (Anhydrous surface) | |
| (n − c)H2O (g, 975 K) → pH2O (g, 298 K) | ΔH8 = (n − c) (−25.0 ± 0.1) kJ mol−1 |
| (n − c)H2O (g, 298 K) → pH2O (sur, 298 K) | ΔH9 = (n − c) (−44.0 ± 0.1) kJ mol−1 |
| cH2O (g, 975 K) → cH2O (g, 298 K) | ΔH10 = c (−25.0 ± 0.1) kJ mol−1 |
| cH2O (g, 298 K) → cH2O (sur, 298 K) | ΔH11 = c (ΔHads = −74.9 ± 2.5 kJ mol−1) |
| Corrected for anhydrous drop solution enthalpy | ΔHanhyd = ΔH5 + ΔH8 + ΔH9 + ΔH10 + ΔH11 |
| Eu2Zr2O7T/°C | Crystallite size from XRD/nm | BET SA m2 mol−1 | H2O (mol) | ΔHds kJ mol−1 2Na2O·4MoO3 solvent at 702 °C | Formation Enthalpy ΔHf,ox | |||
|---|---|---|---|---|---|---|---|---|
| n t (total) | c (chemi) | (n-c) Physi | Hydrous | Anhydrous | ||||
| a Structure of the composition, F = defect fluorite, P = pyrochlore; t = estimated by gravimetric analysis. b Bulk pyrochlore obtained by annealing of co-precipitated sample at 1550 °C/24 h. c Value is the mean of the number of experiments, indicated in parentheses; uncertainties are calculated as two standard deviations of the mean. | ||||||||
| 800/3 h (F)a | 5 ± 1 | 18![[thin space (1/6-em)]](https://www.rsc.org/images/entities/char_2009.gif) 848 ± 72 848 ± 72 |
0.779 ± 0.06 | 0.2876 ± 0.04 | 0.4915 ± 0.07 | −85.8 ± 4.3 | −94.6 ± 2.8 (8)c | 4.4 ± 3.6 |
| 800/6 h (F) | 6 ± 2 | 7653 ± 30 | 0.421 ± 0.04 | 0.1168 ± 0.01 | 0.3040 ± 0.05 | −71.5 ± 3.1 | −75.1 ± 2.6 (9) | −15.1 ± 3.5 |
| 1000/3 h (F) | 7 ± 2 | 4003 ± 41 | 0.273 ± 0.04 | 0.0611 ± 0.008 | 0.2121 ± 0.04 | −72.9 ± 2.7 | −74.7 ± 2.5 (9) | −15.5 ± 3.4 |
| 1000/6 h (F) | 10 ± 3 | 909 ± 54 | 0.152 ± 0.03 | 0.0139 ± 0.002 | 0.1384 ± 0.03 | −65.6 ± 2.1 | −66.1 ± 2.7 (8) | −24.1 ± 3.5 |
| 1200/3 h (P) | 20 ± 4 | 229 ± 28 | 0.033 ± 0.003 | 0.0035 ± 0.0006 | 0.0298 ± 0.003 | −49.7 ± 1.9 | −49.8 ± 3.2 (9) | −40.4 ± 3.9 |
| 1400/3 h (P) | 68 ± 34 | 93 ± 11 | 0.02 ± 0.006 | 0.0014 ± 0.0003 | 0.0185 ± 0.007 | −42.8 ± 1.2 | −42.9 ± 1.2 (8) | −47.3 ± 2.6 |
| 1550/24 h (P) | >1000 | N/A | N/A | N/A | N/A | N/A | −27.8 ± 1.2 (8) | −62.4 ± 2.6 |
| 1550/24 h (P)b | >1000 | N/A | N/A | N/A | N/A | N/A | −26.5 ± 0.6 (9) | −63.7 ± 2.4 |
| Melt quench (F) | >1000 | N/A | N/A | N/A | N/A | N/A | −65.6 ± 2.9 (4) | −24.6 ± 3.7 |
3.4 Comparison with previous data
The enthalpy of phase transformation from ‘P’ to ‘F’ is directly calculated from drop solution as (P→F) = ΔHds(P) − ΔHds(F) = 37.8 ± 3.1 kJ mol−1 for Eu2Zr2O7. It suggests that the P→F phase transformation is less favourable for this system than for Gd2Hf2O7 (23.6 ± 3.1 kJ mol−1).26 The formation enthalpies ΔHf-ox, for the Ln2Zr2O7 pyrochlores previously reported37,38 and in the present study are shown in Fig. 6.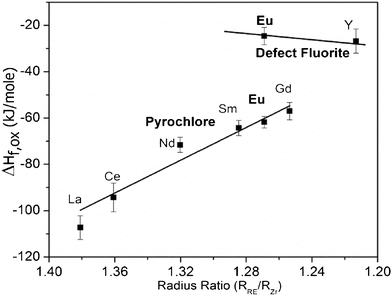 | ||
| Fig. 6 Formation enthalpies of defect ‘F’ and ‘P’ phases of rare-earth zirconates from oxides. The literature data are from Demkov and Navrotsky,38 La2Zr2O7 from Radha et al..37 | ||
The ‘P’ phase has an increasing tendency to disorder (smaller differences in enthalpy of ordered and disordered phases) as rc.n.=8(Ln3+)/rc.n.=8(Zr4+) decreases. In general, a plot of the cation radius ratio against formation enthalpy shows a decrease in stability with respect to the oxides as r(Ln3+)/r(Zr4+) decreases (Fig. 6). The observed trend is consistent with previous studies from our group on titanate ‘P’s.39
3.5 Surface energy
The excess enthalpy of the nanocrystalline samples with respect to bulk can be written as,| ΔHexcess = ΔHds (bulk) − ΔHcorr (nano) | (1) |
The relationship between the drop solution enthalpy of nanopowders and the drop solution enthalpy of bulk phases can be expressed as follows:
| SE * SA = ΔHds (bulk) − ΔHds (nano) | (2) |
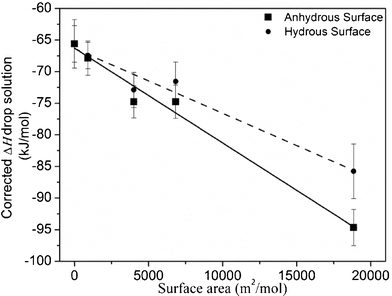 | ||
| Fig. 7 Drop solution enthalpies of defect ‘F’ Eu2Zr2O7vs. surface area, corrected for water content as described in the text. | ||
The calculated surface enthalpies for defect ‘F’ Eu2Zr2O7 and other oxides are given in Table 5. The surface enthalpy of defect ‘F’ Eu2Zr2O7 is similar to that of other related fluorite oxides.28–30
| Compound | Chemisorbed coverage H2O/nm2 | Integral adsorption enthalpy −ΔHads (kJ mol−1) | Surface enthalpy (J m−2) | |
|---|---|---|---|---|
| Hydrous | Anhydrous | |||
| a Shmuel et al.28 b Alexandrov et al..29 c Costa et al..30 | ||||
| CeO2 | 8.8 ± 0.4 | 60 ± 1 | 0.86 ± 0.02 | 1.16 ± 0.02 |
| ThO2 | 8.2 ± 0.3 | 65 ± 1 | 0.92 ± 0.1 | 1.21 ± 0.16 |
| 8 mol% YSZ | 6.3 ± 0.3 | 74 ± 2 | 0.85 ± 0.07 | 1.16 ± 0.08 |
| 10 mol% YSZ | 8.0 ± 1.0 | 79 ± 3 | 1.04 ± 0.05 | 1.51 ± 0.2 |
| 12 mol% YSZ | 11.0 ± 1.0 | 78 ± 4 | 1.27 ± 0.08 | 1.80 ± 0.13 |
| Fluorite Eu2Zr2O7 | 9.5 ± 0.8 | 75 ± 2 | 1.01 ± 0.15 | 1.47 ± 0.13 |
4. Conclusion
Nanocrystalline defect fluorite Eu2Zr2O7 was synthesized by co-precipitation, with a BET SA ranging from 1.6 to 31.5 m2 g−1. Coarse defect fluorite Eu2Zr2O7, which is not possible to synthesize using conventional techniques, was prepared by melt quench in oxygen using laser heating and aerodynamic levitation. Using water adsorption calorimetry and high temperature oxide melt solution calorimetry, we determined the surface enthalpy for the hydrated defect fluorite (1.01 ± 0.15 J m−2) and for the anhydrous defect fluorite (1.47 ± 0.13 J m−2). The enthalpy of water vapour adsorption on the surface of nanocrystalline defect fluorite was found to be −75 ± 2.5 kJ mol−1 H2O for coverage of 9.5 ± 0.8 H2O/nm2. The enthalpy of the pyrochlore-fluorite phase transformation in Eu2Zr2O7 is 37.8 ± 3.1 kJ mol−1 at 25 °C, which is more endothermic when compared to 23.6 ± 3.1 kJ mol−1 for Gd2Hf2O7. This observation suggests that, as the size of rare earth ion decreases, the fluorite phase becomes more favourable.Acknowledgements
This work is supported by the U.S. Department of Energy, Office of Basic Energy Sciences, grant DE-FG02-03ER46053.References
- F. H. Brown and P. Duwez, J. Am. Ceram. Soc., 1955, 38(3), 95 CrossRef CAS.
- R. S. Roth, J. Res. Natl. Bur. Stand, 1956, 56(1), 17 CAS.
- M. Perez-Jorba, Ann. Chim, 1962, 7(7–8), 479 Search PubMed.
- S. S. Kiparisov, R. A. Belyaev, A. L. Belyakov, V. V. Bondarenko, V. P. Vyskubov, V. G. Kozlov, S. A. Kuznetsov and L. P. Melikhova, Izv. Akad. Nauk SSSR, Neorg. Mater, 1976, 12(9), 1693 CAS.
- H. Ohtani, S. Matsumoto, B. Sundman, T. Sakuma and M. Hasebe, Mater. Trans., 2005, 46(6), 1167 CrossRef CAS.
- M. A. Subramanian, G. Aravamudan and G. V. Subba Rao, Prog. Solid State Chem., 1983, 15, 55 CrossRef CAS.
- A. Navrotsky, J. Mater. Chem., 2010, 20, 10577 RSC.
- D. Michel, M. Perez, Y. Jorba and R. Collongues, Mater. Res. Bull., 1974, 9, 1457 CrossRef CAS.
- P. Duran, Ceram. Int, 1977, 14, 435 Search PubMed.
- E. I. Zoz, A. M. Gavrish and N. V. Gul'ko, Inorg. Mat, 1978, 14, 84 Search PubMed.
- A. Zhang, Mengkai Lu, Z. Yang, G. Zhou and Y. Zhou, Solid State Sci., 2008, 10, 74 CrossRef CAS.
- R. A. McCauley and F. A. Hummel, J. Lumin., 1972, 6, 105 CrossRef.
- J. B. Goodenough and R. N. Castellano, J. Solid State Chem., 1982, 44, 108 CrossRef CAS.
- S .J. Korf, H. J. A. Koopmans, B. C. Lippens, A. J. Burggraaf and P. J. Gellings, J. Chem. Soc., Faraday Trans. 1, 1987, 83, 1485 RSC.
- D. A. Belov, A. V. Shlyakhtina, S. Yu. Stefanovich, A. N. Schegolikhim, A. V. Knotko, O. K. Karyagina and L. G. Shcherbakova, Solid State Ionics, 2011, 192, 188 CrossRef CAS.
- H. Yamamura, H. Nishino, K. Kakinuma and K. Nomura, Solid State Ionics, 2003, 158, 359 CrossRef CAS.
- A. V. Shlyakhtina, I. V. Kolbanev, A. V. Knotko, M. V. Boguslavskii, S. Yu. Stefanovich, O. K. Karyagina and L. G. Shcherbakova, Inorg. Mater., 2005, 41, 854 CrossRef CAS.
- N. P. Padture, M. Gell and E. H. Jordan, Science, 2002, 296, 280 CrossRef CAS.
- H. Lehmann, D. Pitzer, G. Pracht, R. Vassen and D. Stover, J. Am. Ceram. Soc., 2003, 86, 1338 CrossRef CAS.
- M. Bolech, E. H. P. Cordfunke, A. C. G. Van Genderen, R. R. Van Der Laan, F. J. J. G. Janssen and J. C. Van Miltenburg, J. Phys. Chem. Solids, 1997, 58, 433 CrossRef CAS.
- K. W. Eberman, B. J. Wuensch and J. D. Jorgensen, Solid State Ionics, 2002, 148, 521 CrossRef CAS.
- A. V. Shlyakhtina, A. V. Knotko, M. V. Boguslavskii, S. Yu. Stefanovich, D. V. Peryshkov, I. V. Kolbanev and L. G. Shcherbackova, Solid State Ionics, 2005, 176, 2297 CrossRef CAS.
- A. V. Shlyakhtina, A. V. Knotko, M. V. Boguslavskii, S. Yu. Stefanovich, I. V. Kolbanev, L. L. Larina and L. G. Shcherbakova, Solid State Ionics, 2007, 178, 59 CrossRef CAS.
- A. V. Shlyakhtina, I. V. Kolbanev, A. V. Knotko, M. V. Boguslavskii, S. Yu. Stefanovich, O. K. Karyagina and L. G. Shcherbakova, Inorg. Mater., 2005, 41, 854 CrossRef CAS.
- H. Yamamura, H. Nishino, K. Kakinuma and K. Nomura, Solid State Ionics, 2003, 158, 359 CrossRef CAS.
- S. V. Ushakov and A. Navrotsky, J. Am. Ceram. Soc., 2007, 90, 1171 CrossRef CAS.
- V. Ushakov Sergey and A. Navrotsky, Appl. Phys. Lett, 2005, 87, 1641031 Search PubMed.
- Shmuel Hayun, Y. Shvareva Tatiana and A. Navrotsky, J. Am. Ceram. Soc., 2011, 1 Search PubMed.
- V. Alexandrov, T. Y. Shvareva, S. Hayun, M. Asta and A. Navrotsky, Manuscript under preparation Search PubMed.
- G. C. C. Costa, S.V. Ushakov, R. H. R. Castro and A. Navrotsky, Chem. Mater., 2010, 22, 2937 CrossRef CAS.
- S. Lutique, P. Javorsky, R. J. M. Konings, J. C. Krupa, A. C. G. van Genderen, J. C. van Miltenburg and F. Wastin, J. Chem. Thermodyn., 2004, 36, 609 CrossRef CAS.
- V. R. Kornee and V. B. Glushkova, Inorg, Mat, 1971, 7, 886 Search PubMed.
- R. A. Robie, B. S. Hemingway, Thermodynamic Properties of Minerals and Related Substances at 298.15 K and 1 bar Pressure and at Higher Temperatures; U.S. Geological Survey Bulletin 2131; U.S. Geological Survey: Reston, VA, 1995 Search PubMed.
- G. Della Gatta, Thermochim. Acta, 1985, 96, 349 CrossRef CAS.
- A. V. Radha, O. B. Miguel, S. V. Ushakov, A. Navrotsky and P. Tartaj, J. Am. Ceram. Soc., 2009, 92, 133 CrossRef CAS.
- S. V. Ushakov, K. B. Helean, A. Navrotsky and L. A. Boatner, J. Mater. Res., 2001, 16, 2623 CrossRef CAS.
- A. V. Radha, S. V. Ushakov and A. Navrotsky, J. Mater. Res., 2009, 24, 3350 CrossRef CAS.
- Materials Fundamentals of Gate Dielectrics by A. A. Demkov and A. Navrotsky, Chater 3, page 73.
- K. B. Helean, S. V. Ushakov, C. E. Brown, A. Navrotsky, J. Lian, R. C. Ewing, J. M. Farmer and L. A. Boatner, J. Solid State Chem., 2004, 177, 1858 CrossRef CAS.
| This journal is © The Royal Society of Chemistry 2012 |
