A bilayer structure of a titania nanoparticle/highly-ordered nanotube array for low-temperature dye-sensitized solar cells†
Jianqiang
Luo
,
Lian
Gao
*,
Jing
Sun
* and
Yangqiao
Liu
State Key Laboratory of High Performance Ceramics and Superfine Microstructures, Shanghai Institute of Ceramics, Chinese Academy of Sciences, Shanghai, 200050, China. E-mail: liangao@mail.sic.ac.cn (Lian Gao) and jingsun@mail.sic.ac.cn (Jing Sun); Fax: 86-21-5241-3122; Tel: 86-21-5241-2720
First published on 6th January 2012
Abstract
A chemical-free, environmentally friendly and harmless water immersion method is developed to delaminate anode oxidationtitania nanotube (TNT) arrays from Ti foils to obtain a free-standing TNT membrane. The as-synthesized TNT membrane with tunable thickness which is controlled by anodization time are used in low-temperature dye-sensitized solar cells (DSSCs) as a second layer to improve the DSSC efficiency. Compared with the common titania nanoparticle electrode, a water-delaminated TNT membrane electrode of 16 μm in thickness can significantly enhance the DSSCs photovoltaic performance with a short-circuit current density from 3.87 to 7.63 mA cm−2 and a fill factor from 0.637 to 0.708, which combinatorially lead to a remarkable increment of photo conversion efficiency from 1.70% to 3.68%. The results show that, owing to its vertically aligned ordered nanotube structure, the TNT arrays exhibit trifunctional behavior when used as an electrode, which are charge generation, light scattering and I3− diffusion improvement.
1. Introduction
Since the first report by O'Regan and Grätzel in 1991, high-efficiency dye-sensitized solar cells have drawn much attention as potential replacements of silicon solar cells.1 One of the key point of the Grätzel cell is the use of high-surface-area titania nanoparticles as the photoanode. However during the research on improving the DSSC performance, the nanoparticle electrode is believed to limit the cell efficiencies mainly owing to two key problems, i.e. their poor absorption of long-range wavelength light and the presence of many electron–hole recombination centers. Therefore, considerable efforts have been devoted to fabricate more efficient nano-structured titiania photoanodes, such as ordered meso-structured titania,2 1D nanostructured titania (nanowire, nanotube, nanorod),3–6 and 3D spheres.7 Among these nanostructures, the 1D nanostructure has shown the greatest potential for producing a direct electron-transporting path and consequently reducing the electron–hole recombination probability. A member of 1D titania nanostructures, the titania nanotube (TNT) array, has become the focus of research because of its highly-ordered structure and convenient and controllable synthesis, e.g. the anode oxidation method.4,8 In recent years, the TNT arrays have been demonstrated to effectively solve the above-mentioned two problems of nanoparticle photoanode-based DSSC.9Generally, the TNT used in DSSC employs a back-side illumination mode which is not optimal for DSSC.10–11 Because the incident light has to go through the Pt counter electrode and the electrolyte before reaching dyes, there is much light loss in the back-side illumination mode. In contrast, the front-side illumination mode allows the incident light to directly reach dyes on the titania electrode, and therefore could make the best use of incident light. In order to employ a front-side illumination mode, two main methods can be used to fabricate the TNT electrode, the sputtering method and the chemical delamination method. By the sputtering method, the Ti metal is firstly sputtered on a transparent conducting oxide (TCO), and then anodized directly into TNTs on the TCO. It is found that the sputtering method is high cost, material consuming and difficult to obtain both high-quality Ti and high aspect-ratio TNTs.12–13 By the chemical delamination method, the TNTs are delaminated from the Ti foil substrate mainly by using some highly corrosive chemicals such as HCl,14Br2,15H2O216etc. It is obvious that chemical delamination method is dangerous, material consuming and not well-suited for wide application. Recently, Wang et al. applied a methanol immersion method to delaminate TNT arrays.17 However, methanol is highly toxic and only membranes thicker than 100 μm were obtained by this method, which is not suitable for DSSCs. Therefore, it is of great importance for DSSCs to find a harmless and convenient way to fabricate a thin free-standing TNT membranes. Here, we developed a convenient, low-cost and harmless way to obtain a free-standing TNT arrays just by using a water immersion process. This process can produce free-standing TNT arrays as thin as 16 μm.
Low temperature fabrication of DSSCs on flexible substrates has attracted much attention in recent years due to its low cost and more extensive applications.18 Studies on low-temperature DSSCs mainly focus on improving charge transportation and collection by enhancing nanoparticle necking and reducing organic residues by techniques such as chemical sintering,19 high pressure processing20–21 and UV illumination22etc. Improving charge generation from light harvesting and light scattering seems to be being ignored which is another important factor that affects DSSC efficiency. In high-temperature DSSCs, a nanocrystal/scattering TiO2 particle bilayer structure is usually used to improve the DSSCs light harvesting ability by the sequential casting of TiO2 paste with an organic binder on glass substrate.23–24 Furthermore, it would be better if the scattering TiO2 particles showed the ability of both charge generation and light scattering.25 However, the bilayer structure of scattering TiO2 particles in high-temperature DSSCs is not applicable to low-temperature DSSCs because of the organic binder residues in the scattering layer. We believe that the free-standing TNT array film is suitable for the bilayer structure of low-temperature DSSCs because of the TNT film's prominent properties of being binder-free, having a direct electron transportation pathway and an ordered porous structure. Here, we report of using the free-standing TNT array membrane as a second layer in the low-tempature fabrication of DSSCs. The present application of TNTs gives three impressive positive effects to the DSSCs: (1) generating charges; (2) scattering light to absorb more long-wavelength light; (3) enhancing I3− diffusion in the electrolyte.
2. Experimental section
2.1 Preparation of TNT arrays
Vertically aligned and highly-ordered TNT arrays were grown at 20 °C by an anodic oxidation of Ti foil at 60 V in an electrolyte of 0.25 wt% NH4F and 2 vol% H2O containing ethylene glycol. The Ti foil was pressed into an O-ring in a configured polyflon cell. Ti foil and Pt foil served as the anode and the cathode, respectively. The distance between the Ti foil and the Pt foil was set to be 3 cm. After anodization, the Ti foil was washed with deionized water several times, and then ultrasonificated for 70 s to remove the covered disordered porous layer. The free-standing TNT array membrane was obtained by immersing the anodizated Ti foil in deionized water overnight, and then dried slowly in air at room temperature. The as-prepared free-standing TNT array membrane was then sandwiched between two quartz glass slides followed by annealing at 450 °C for 30 min in air.2.2 Preparation of NP-TiO2 paste
TiO2 nanocrystalline particles in the form of a viscous paste were prepared by the chemical sintering method as described in the literature.19 Typically, 74 ml titanium(IV) isopropoxide (Aldrich, 99.9%) in 20 ml of 2-propanol was slowly dripped into a mixture of 160 ml acetic acid and 500 ml deionized water at 0 °C under stirring. The resulting solution was heated to 80 °C and kept at constant temperature of 80 °C for 8 h. Then, it was transferred to a Teflon lined autoclave for a 12-hour hydrothermal process at 240 °C. The prepared titania colloid was concentrated at 40 °C in a rotary evaporator to a TiO2 concentration of 15 wt%. The NP-TiO2 viscous paste was prepared by adding 0.1 g of 10 M ammonia solution into 5 g 15 wt% TiO2 colloid.2.3 Solar cell fabrication
A layer of NP-TiO2 was doctor-bladed onto the FTO. After that, the annealed TNT array membrane was adhered immediately onto the NP-TiO2 viscous paste. The electrodes were then heated for 4 h at 180 °C, and then immersed in a 0.3 mM N719 (Solaronix) dye solution (solvent mixture of acetonitrile and tert-butyl alcohol in volume ratio of 1![[thin space (1/6-em)]](https://www.rsc.org/images/entities/char_2009.gif) :
:![[thin space (1/6-em)]](https://www.rsc.org/images/entities/char_2009.gif) 1) for 12 h. The N719-sensitized electrode was further covered with a sputtered-Pt FTO glass, separated by a Parafilm spacer. The electrolyte (0.5 M LiI, 0.05 M I2, and 0.5 M tert-butylpyridine in acetonitrile) was injected to the electrode. The fabrication process is illustrated in Scheme 1.
1) for 12 h. The N719-sensitized electrode was further covered with a sputtered-Pt FTO glass, separated by a Parafilm spacer. The electrolyte (0.5 M LiI, 0.05 M I2, and 0.5 M tert-butylpyridine in acetonitrile) was injected to the electrode. The fabrication process is illustrated in Scheme 1.
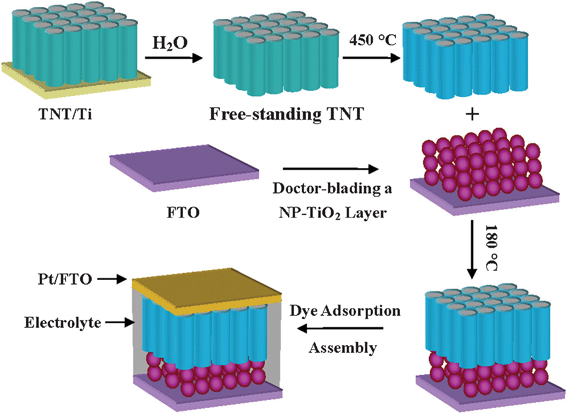 | ||
| Scheme 1 Scheme for incorporating TNT arrays in the low-temperature fabrication of DSSCs. | ||
2.4 Characterization
The morphology and the structures of the TNT array membrane were characterized by scanning electron microscopy (SEM; JSM-6700F, Japan) and X-ray diffractometry (D/max 2550V, Rigaku Tokyo, Japan). Photovoltaic measurements were performed using an AM 1.5 solar simulator (100 mW cm−2, model YSS-80a, Yamashita). The photocurrent–photovoltage relationship was recorded with an electrochemical workstation (CHI 660C, CH Instrucments). The incident photon-to-current conversion efficiency (IPCE) was recorded with a specially designed IPCE system (CEP-1500, Bunkon-Keiki., Japan). Electrochemical impedance spectra (EIS) were observed under the bias of the DSSC open-circuit voltage (Voc). The frequency was tunable from 0.1 Hz to 100 kHz. The dye desorbing was conducted with 0.1 M NaOH solution and the dye concentration was measured using a UV-vis spectrometer (Perkin Elmer, Lambda 950).3. Results and discussion
For DSSCs, high-aspect-ratio TNT arrays are desired. However, during the preparation of high-aspect-ratio TNT arrays, the freshly prepared TNTs are generally covered with a disordered porous layer (Fig. 1a). By virtue of ultrasonication in deionized water, this disordered porous layer on the TNT film could be completely removed without damage to the sublayer ordered TNTs. After ultrasonication for 30 s, the disordered uplayer had partly been removed. The disordered uperlayer could be removed completely by 70 s of ultrasonication. However, the TNT membrane would crash and detach from the Ti foil after ultrasonication for a longer time.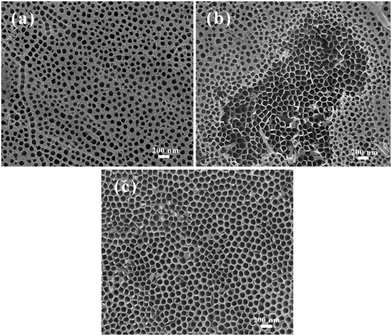 | ||
| Fig. 1 Surface SEM images of the prepared titania nanotube after different time of ultrasonication. (a) Fresh prepared without ultrasonication, (b) ultrasonication for 30 s, (c) ultrasonication for 70 s. | ||
After getting rid of the upper disordered layer, the TNT/Ti foil was immersed in deionized water overnight and then dried slowly in air at room temperature to get a free-standing TNT array membrane. Fig. 2a shows a free-standing TNT array detached from the Ti foil. The diameter of the round membrane is 18 mm and the thickness is 35 μm. Fig. 2b, c and d show the top, bottom and cross-section images of the TNT film, respectively. By analysis of 50 nanotubes, the average inner diameter and wall thickness are about 115 nm and 10.6 nm, respectively. The aspect-ratio of the nanotube is as high as 257. Each nanotube is adjacent to 6 other ones and there are interspaces between adjacent nanotubes. The corresponding bottom image is shown in Fig. 2c. The bottom of the nanotubes is closed and there are also interspaces between adjacent nanotubes. This shows that the interspaces penetrate across the entire membrane. The detachment of the nanotube array membrane should be related to the interspaces. Although the TNT film was washed several times with water, there should be F− left in the nanotubes and the interspaces. The F− residue could diffuse to slowly etch the thin “barrier layer” which formed between the TNT array membrane and the Ti foil during anodization, and finally leading to the detachment of the TNT membrane from the Ti foil.17 A phenomenon of the slow process is that when just a few hours of water immersion is applied, some of the membrane was still well attached to the Ti foil, and on drying, the film can not be detached completely. When no water immersion is introduced just leaving the TNT/Ti in the air, after drying, the TNTs are firmly attached on the Ti substrate. Furthermore, control of the evaporation rate is also very important for complete delamination, because fast evaporation induces strong residual stress in the Ti foil and causing cracking of the TNT membrane. When we tried other solvents such as ethanol and acetone instead of water, the detaching process was so quick that the film was easily curled and cracked. The detailed detachment mechanism needs further investigation.
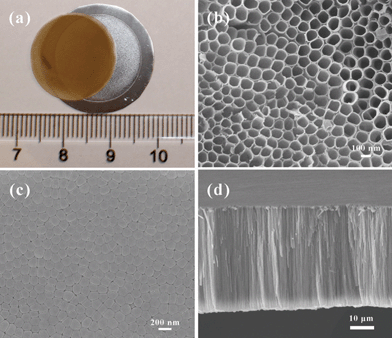 | ||
| Fig. 2 Digital and SEM images of the as-synthesized TNT membrane. (a) Digital image of a free-standing TNT membrane. (b), (c), and (d) are the top, bottom, and cross-section SEM images of the TNTs respectively. | ||
The length of the TNTs can be easily tuned by controlling the anodization time. When the reaction times were 1, 1.5, 2, 3, 12 h, the length of the nanotube were about 10.5, 16, 22, 35, 120 μm, respectively. The results are shown in Fig. 3. The length of the nanotube increased with the reaction time at an average speed of about 10 μm h−1. In other words, the aspect-ratio of the nanotubes can be facially controlled over a large range by changing the anodization time.
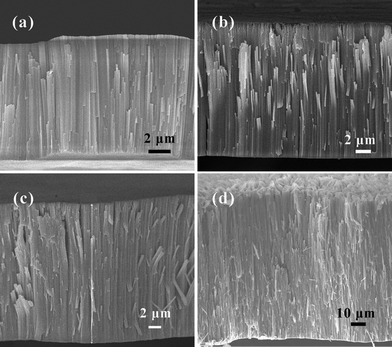 | ||
| Fig. 3 SEM images of the cross-section of the samples prepared with different anodization time. (a) 1 h, (b) 1.5 h, (c) 2 h, (d) 12 h. | ||
It is worth noting that the water immersion process is very simple, safe, materials saving and totally free of any chemicals. After detachment of the first layer by water, the Ti film could be directly used for a second anodization to fabricate anodized titania nanotube array (Fig. S1, ESI†). By this method, a free-standing TNT membrane as thin as 16 μm can be prepared. Thicker membranes are easier to detach from the Ti foil completely.
The as-synthesized TNT array was amorphous and could be crystallized into the anatase phase by calcination, as revealed by XRD patterns in Fig. S2†. Calcination for 30 min at 450 °C did not change the nanotube structure, while at 500 °C, the nanotube structure was destroyed (Fig. S3†). The crystallized free-standing TNT membrane and a chemical sintering low-temperature nanoparticle paste were used to fabricate low-temperature DSSCs. Three electrodes, 10 μm thick NP-TiO2, and two 10 μm thick NP-TiO2 overlain with 16 μm and 28 μm thick TNT (denoted as NP, NP-TNT-16 and NP-TNT-28, respectively) were prepared. The I–V measurements of the DSSCs were carried out under simulated AM 1.5 light. The measured I–V curves are shown in Fig. 4. The photovoltaic performances of the three electrodes were summarized in Table 1. The dye absorption results were also shown in Table 1. Without adding TNT arrays, the NP exhibited an open circuit voltage (Voc) of 0.69 V, a short circuit current density (Jsc) of 3.87 mA cm−2, a fill factor (FF) of 0.63 and conversion efficiency (η) of 1.7%. When a 16 μm TNT array membrane was introduced, the electrode NP-TNT-16, the conversion efficiency is enhanced to 3.68%, a more than 100% increase. The NP and NP-TNT-16 electrodes have very approximate Voc values; however the Jsc and FF values are all remarkably enhanced. It is well known that the amount of dye absorption could influence the light harvesting efficiency and consequent charge generation. As to the NP-TNT-16, the higher dye absorption induced by TNTs is expected to generate more charges which would enhance the Jsc value. Moreover, it is believed that the improvement in FF should be highly related to the highly ordered TNTs which reduces the series resistance by providing direct pathways for electrolyte diffusion and better contact between the electrolyte and the titania.26 Compared to the NP-TNT-16 sample, the NP-TNT-28 electrode showed a smaller Jsc value, although it had a higher dye loading (almost same Voc and FF values), probably because the NP-TNT-28 electrode is so thick that it enhances electron–hole recombination centers that consequently affect the Jsc value in a negative way. It should be noted that just using the chemical sintered nanoparticle paste to make a NP electrode with thickness comparable to the NP-TNT-16 electrode so that it takes more dye and absorbs more light is not applicable because the NP paste is binder free, leading to the electrode film cracking during the heating process.
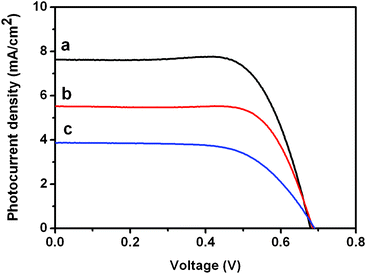 | ||
| Fig. 4 Photocurrent–voltage characteristics of the photoanodes. (a) NP-TNT-16, (b) NP-TNT-28, (c) NP. | ||
| Anode | V oc/V | J sc/mA cm−2 | FF | η (%) | Adsorbed dye/μmol cm−2 |
|---|---|---|---|---|---|
| NP | 0.690 | 3.87 | 0.637 | 1.70 | 0.226 |
| NP-TNT-16 | 0.680 | 7.63 | 0.708 | 3.68 | 0.479 |
| NP-TNT-28 | 0.685 | 5.52 | 0.722 | 2.73 | 0.663 |
Fig. 5 displays the IPCE curves and integrated photocurrents of these DSSCs. The IPCE shows the external quantum efficiency of the solar cell which is determined by light harvesting, electron injection, and electron collection efficiency. The IPCE of the NP-TNT-16 based cell is the highest compared to the other two electrodes, which is in good agreement with the highest measured Jsc. The three photoanodes NP, NP-TNT-16, NP-TNT-28 have IPCE peaks at 550 nm of 19.25%, 57.28% and 40.67%, respectively. The results also show that the TNTs improve the IPCE of the NP photoanode. However when longer, 28 μm, TNTs are used, the IPCE is reduced which directly indicates that too thick a film would produce more recombination centers which decrease the electron collection efficiency. The theoretical Jsc for these cells were calculated by convolution of the IPCE spectra with photo flux density distribution for 1 sun with the following equation.27–28
 | (1) |
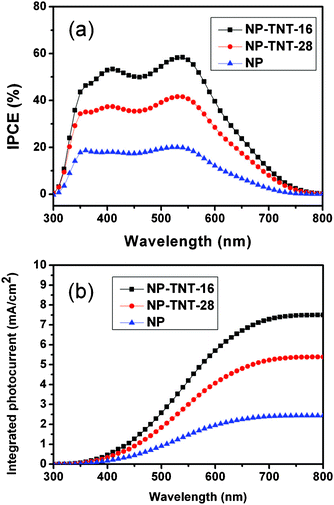 | ||
| Fig. 5 Measured IPCE curves of the three electrodes (a) and integrated photocurrent to wavelength curves (b). | ||
Where q is the electron charge and F(λ) is the incident photon flux density (AM 1.5, ASTM G173) at wavelength λ. Here, the incident light loss factor is ignored. The calculated results are shown in Fig. 5b. We divided the calculated Jsc into two parts, one is wavelength greater than 600 nm (Jsc ≥ 600 nm) and the other is wavelength lower than 600 nm (Jsc < 600 nm). From Fig. 5b, we can calculate that the Jsc ≥ 600 nm contribution is 0.484, 1.797, 1.322 mA cm−2 for the NP, NP-TNT-16, NP-TNT-28 photoanodes respectively, which accounts for 19.87%, 23.99%, 24.53% to the calculated Jsc. The differences between calculated and experimental Jsc are probably due to the omission of incident light loss factor r(λ).28 So, it could be concluded that the contribution of long wavelength light to the conversion efficiency is increased when TNT arrays are incorporated in the DSSCs. The improvement of the long wavelength light adsorption by the electrode implies a light scattering effect of the TNTs in the DSSCs as the scattering efficiency is higher in the long wavelength region.24 The Jsc ≥ 600 nm contribution to the total Jsc of electrode NP-TNT-28 is larger than that for NP-TNT-16, which implies that the scattering effects of 28 μm TNTs are better than those of 16 μm TNTs. However, the Jsc of NP-TNT-16 is larger than that of NP-TNT-28 which shows that charge generation of the 16 μm TNTs should account for the improvement in Jsc. This further confirms that the charge generation effect of the TNT membrane and the scattering of the 28 μm TNTs is caused by the film thickness that induces charge recombination.
Electrochemical impedance spectroscopy (EIS) is a powerful characterization technique to investigate electronic and ionic processes in DSSCs. In order to confirm the effect of TNT arrays on the conversion efficiency improvement, EIS measurement was conducted on the NP and NP-TNT-16 electrodes. The results were shown in Fig. 6. The electronic processes in the DSSCs are described well elsewhere as shown in the inset of Fig. 6a.29 The first semicircle was assigned to electron transport and back reaction at the TiO2/electrolyte interface, and the second semicircle was assigned to diffusion of I3− ions in the electrode. It can be seen that the equivalent circuit consisting of a series resistance (R1), a Warburg impedance arise from electron diffusion (W1) in the TiO2 films, a charge transfer resistance (R2) represents the interfacial charge recombination between the electrons in the semiconductor and electron acceptor (I3− ions) in the electrolyte, and a constant phase element (CPE) connected in parallel with the (W1R2) element. Besides, a Nernst impedance originating from the mass transport of the electrolyte should be added to the circuit to form the R1((W1R2)CPE)W2 network. By fitting the impedance spectra with the equivalent circuit, the detailed impedance parameters for charge recombination (R2) and electrolyte diffusion (W2) were evaluated. The R2 value for the cell with NP-TNT-16 is 175 Ω cm2, which is about 2 times larger than that of the NP cell (67.8 Ω cm2). The larger charge recombination resistance for the NP-TNT-16 cell suggests that it can effectively suppress the electrons from recombining on the semiconductor–electrolyte interface, resulting favorably in a higher charge collection efficiency and photocurrent density, which is in good agreement with the photocurrent–voltage characteristics and IPCE curves (shown in Fig. 4 and Fig. 5). However, the Voc of NP-TNT-16 shows no increase in comparison with that of NP. This phenomenon is also frequently observed in many previous titania nanotube based DSSC works.30–31 It is most likely related to the existence of a sub band gap in the anodic oxide titania nanotube,32 which downshift the titania Fermi level and lead to the reduction of the Voc. By virtue of effective suppression of charge recombination, the characteristic frequency related to charge transfer shifted toward a lower value, as shown in Fig. 6b, suggest that the cell with the NP-TNT-16 electrode exhibits a much longer electron lifetime, according to the equation:33
| τe = 1/2 πfmid | (2) |
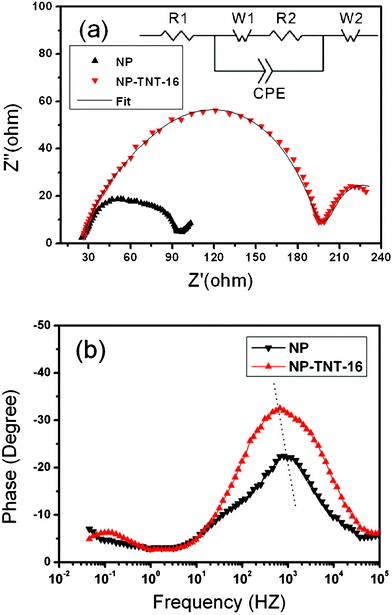 | ||
| Fig. 6 EIS of DSSCs with the NP and NP-TNT-16 electrodes. (a) Nyquist diagram, (b) Bode diagram. The inset in (a) shows an equivalent circuit of the device. | ||
Besides, the coefficient of electrolyte diffusion for the two cells was also investigated. By describing W2 as a Nernst diffusion impedance ZN, one can able to obtain:29
 | (3) |
 | (4) |
Where ω is the angular frequency, τd and Z0 are the diffusion time constant and Warburg parameter, respectively. R is the molar gas constant, T the temperature, F the Faraday constant, A the electrode area, D the diffusion coefficient of I3−, and d the diffusion length. C0 is the concentration of I3− which is 0.05 M in our case. A modified Nernst diffusion impedance with α deviating from 0.5 is used to fit the diffusion of I3−. By fitting Z0 and τd, we obtained the diffusion coefficient of the NP and NP-TNT-16 as 1.57 × 10⁻⁷ and 7.04 × 10⁻⁶, respectively. The diffusion coefficient of the NP-TNT-16 is larger than the NP electrode and comparable to the high-temperature sintered titania nanoparticles electrode reported in literature.34 The higher coefficient for electrolyte diffusion can reduce the internal resistance of the cell, leading to a higher FF which is consistent with the experimental results.
Conclusions
A water immersion process was developed to produce a free-standing titania nanotube array membrane. The process was harmless, material saving and free of chemicals. The free-standing membrane was used in low-temperature dye-sensitized solar cells. By introducing a 16 μm-thick TNT array into the NP low-temperature DSSC, the conversion efficiency is improved from 1.70% to 3.68%. The TNT membrane shows trifunctional behavior, namely: scattering light, generating charge and improving I3− diffusion, which combined contribute to the improvement of photovoltaic performance. It is reckoned that the bilayer nanoparticle/TNT structure in this study will shed new light on the development of high-performance low-temperature DSSCs.Acknowledgements
The project was supported by the National Natural Science Foundation of China (Grant No. 51072215 and 50972157) and Science and Technology Commission of Shanghai Municipality (Grant No. 10DZ0505000).References
- B. O’Regan and M. Grätzel, Nature, 1991, 353, 737 CrossRef.
- M. Zukalová, A. Zukal, L. Kavan, M. K. Nazeeruddin, P. Liska and M. Grätzel, Nano Lett., 2005, 5, 1789 CrossRef.
- M. Adachi, Y. Murata, J. Takao, J. Jiu, M. Sakamoto and F. Wang, J. Am. Chem. Soc., 2004, 126, 14943 CrossRef CAS.
- P. Roy, S. Berger and P. Schmuki, Angew. Chem., Int. Ed., 2011, 50, 2904 CrossRef CAS.
- B. Liu and E. S. Aydil, J. Am. Chem. Soc., 2009, 131, 3985 CrossRef CAS.
- X. L. Sheng, N. R. Liu, J. Zhai and L. P. An, Prog. Chem., 2009, 21, 1969 CAS.
- D. Chen, L. Cao, F. Huang, P. Imperia, Y.-B. Cheng and R. A. Caruso, J. Am. Chem. Soc., 2010, 132, 4438 CrossRef CAS.
- T.-S. Kang, A. P. Smith, B. E. Taylor and M. F. Durstock, Nano Lett., 2009, 9, 601 CrossRef CAS.
- K. Zhu, N. R. Neale, A. Miedaner and A. J. Frank, Nano Lett., 2006, 7, 69 CrossRef.
- C.-C. Chen, H.-W. Chung, C.-H. Chen, H.-P. Lu, C.-M. Lan, S.-F. Chen, L. Luo, C.-S. Hung and E. W.-G. Diau, J. Phys. Chem. C, 2008, 112, 19151 CAS.
- D. Kuang, J. Brillet, P. Chen, M. Takata, S. Uchida, H. Miura, K. Sumioka, S. M. Zakeeruddin and M. Gratzel, ACS Nano, 2008, 2, 1113 CrossRef CAS.
- O. K. Varghese, M. Paulose and C. A. Grimes, Nat. Nanotechnol., 2009, 4, 592 CrossRef CAS.
- G. K. Mor, K. Shankar, M. Paulose, O. K. Varghese and C. A. Grimes, Nano Lett., 2006, 6, 215 CrossRef CAS.
- J. H. Park, T. W. Lee and M. G. Kang, Chem. Commun., 2008, 2867 RSC.
- S. P. Albu, A. Ghicov, J. M. Macak, R. Hahn and P. Schmuki, Nano Lett., 2007, 7, 1286 CrossRef CAS.
- Q. Chen and D. Xu, J. Phys. Chem. C, 2009, 113, 6310 CAS.
- J. Wang and Z. Lin, Chem. Mater., 2008, 20, 1257 CrossRef CAS.
- M. Toivola, J. Halme, K. Miettunen, K. Aitola and P. D. Lund, Int. J. Energy Res., 2009, 33, 1145 CrossRef CAS.
- N. G. Park, K. M. Kim, M. G. Kang, K. S. Ryu, S. H. Chang and Y. J. Shin, Adv. Mater., 2005, 17, 2349 CrossRef CAS.
- H. Lindström, A. Holmberg, E. Magnusson, S.-E. Lindquist, L. Malmqvist and A. Hagfeldt, Nano Lett., 2001, 1, 97 CrossRef.
- T. Yamaguchi, N. Tobe, D. Matsumoto, T. Nagai and H. Arakawa, Sol. Energy Mater. Sol. Cells, 2010, 94, 812 CrossRef CAS.
- D. S. Zhang, T. Yoshida, T. Oekermann, K. Furuta and H. Minoura, Adv. Funct. Mater., 2006, 16, 1228 CrossRef CAS.
- S. Ito, S. M. Zakeeruddin, R. Humphry-Baker, P. Liska, R. Charvet, P. Comte, M. K. Nazeeruddin, P. Pechy, M. Takata, H. Miura, S. Uchida and M. Grätzel, Adv. Mater., 2006, 18, 1202 CrossRef CAS.
- Z.-S. Wang, H. Kawauchi, T. Kashima and H. Arakawa, Coord. Chem. Rev., 2004, 248, 1381 CrossRef CAS.
- H. J. Koo, Y. J. Kim, Y. H. Lee, W. I. Lee, K. Kim and N. G. Park, Adv. Mater., 2008, 20, 195 CrossRef CAS.
- N. Koide, A. Islam, Y. Chiba and L. Y. Han, J. Photochem. Photobiol., A, 2006, 182, 296 CrossRef CAS.
- C. J. Lin, W. Y. Yu and S. H. Chien, J. Mater. Chem., 2010, 20, 1073 RSC.
- Y. Tachibana, K. Hara, K. Sayama and H. Arakawa, Chem. Mater., 2002, 14, 2527 CrossRef CAS.
- Q. Wang, J. E. Moser and M. Grätzel, J. Phys. Chem. B, 2005, 109, 14945 CrossRef CAS.
- Q. Zheng, H. Kang, J. Yun, J. Lee, J. H. Park and S. Baik, ACS Nano, 2011, 5, 5088 CrossRef CAS.
- L.-L. Li, Y.-J. Chen, H.-P. Wu, N. S. Wang and E. W.-G. Diau, Energy Environ. Sci., 2011, 4, 3420 CAS.
- P. Roy, S. Berger and P. Schmuki, Angew. Chem., Int. Ed., 2011, 50, 2904 CrossRef CAS.
- S. R. Sun, L. Gao and Y. Q. Liu, Appl. Phys. Lett., 2010, 96, 083113 CrossRef.
- J. A. Anta, F. Casanueva and G. Oskam, J. Phys. Chem. B, 2006, 110, 5372 CrossRef CAS.
Footnote |
| † Electronic supplementary information (ESI) available: SEM images and XRD patterns of TNT arrays. See DOI: 10.1039/c2ra00731b/ |
| This journal is © The Royal Society of Chemistry 2012 |
