Adsorption and structural properties of ordered mesoporous carbons synthesized by soft-templating in the presence of boric acid and tetraethyl orthosilicate†
Nilantha
Wickramaratne
and
Mietek
Jaroniec
*
Department of Chemistry, Kent State University, Kent, Ohio 44242, USA. E-mail: jaroniec@kent.edu; Fax: (+1)-330-672-3816; Tel: (+1)-330-672-3790
First published on 6th January 2012
Abstract
Boron-containing mesoporous carbon materials were prepared using resorcinol and formaldehyde as carbon precursors, boric acid as a boron precursor and poly(ethylene oxide)-poly(propylene oxide)-poly(ethylene oxide) triblock copolymer (Pluronic F127) as a soft template. Another series of boron-containing samples was prepared by using the same chemicals in the presence of tetraethyl orthosilicate. Nitrogen adsorption, X-ray diffraction, NH3 temperature programmed desorption, X-ray photoelectron spectroscopy, and thermogravimetric analysis revealed that the resulting boron-carbon materials possessed acidic sites, high surface area ranging from 1047 to 1400 m2 g−1, large mesopores of about 10 nm, uniform pore size distribution, and high boron content (1.5–1.8%).
1. Introduction
Recently, mesoporous carbon materials with heteroatoms such as boron, nitrogen and phosphorous have been actively studied because of their potential applications ranging from catalysis1–4 and H2storage5,6 to energy storage.7–12 It was shown that the boron doping may improve the specific capacitance per unit surface area for the multi-walled carbon nanotubes13 and that boron-containing mesoporous carbons show a higher capacitance (∼1.6 times) than that observed for carbons without boron in aqueous electrolyte solutions.14 In terms of H2storage, it has been shown that the thermodynamic requirement for an adsorbent capable of storing hydrogen at ambient temperature is adsorption heat of ∼15 kJ mol−1.15 However, the heat of hydrogen adsorption on carbons alone is usually about 6 kJ mol−1;16 therefore, adsorption of hydrogen on carbons in any form is too weak for storing hydrogen at ambient temperature. Theoretical studies suggest that the doping of fullerenes and carbon nanotubes with boron can increase the heat of adsorption up to 19 kJ mol−1,17,18 which is in the ideal range for H2 adsorption at ambient temperature. So, boron-containing carbon can enhance H2 physisorption, and thereby H2storage.Recent studies have shown that carbon materials with incorporated inorganic species can be fabricated using templating synthesis methods. There are two main methods available, soft and hard templating, to incorporate inorganic species into the carbon matrix. A large number of reports deal with the hard templating synthesis of doped mesoporous carbons. This strategy is good for the proof of principle, but it is difficult to scale up because the template needs to be prepared and later removed, which adds extra steps to the synthesis. On the other hand, the soft templating method is more feasible. It has been reported that the soft templating route is an effective method to incorporate inorganic species and particles into the carbon matrix.19,20 These works report the soft-templating synthesis of mesoporous carbons by using phenol, resorcinol, or phloroglucinol/formaldehyde polymers as carbon precursors and inorganic salts as metal or metal oxide precursors. Also, B-containing carbon materials were synthesized using chemical vapor deposition (CVD) and the polymerization of phenol resin in the presence of boron precursors. Mondal and co-workers obtained B-containing carbon microspheres by the CVD method.21 They used BF3/MeOH as the boron source. Laser ablation inductively coupled plasma optical emission spectrometry (LA-ICP-OES) was used to measure the B content, which was very low (about 0.13 ± 0.03 at.%). Yin and co-workers synthesized B-containing carbon microspheres by using phenolic resin as a carbon source and boric acid as boron precursor;22 however, no adsorption data about the porosity and surface area of these materials is provided. Rufford and co-workers have shown that the surface area is an important factor of carbon materials designed for supercapacitors; they also pointed out that mesopores facilitate the transport of electrolyte ions throughout the carbon matrix to form double layer and thereby improve the capacitance.23 Therefore, the potential B-containing carbon materials for supercapacitors should have a high surface area and well developed mesoporosity. However, there are only a few reports published on the synthesis of boron-containing templated mesoporous carbons. Da-wei Wang and co-workers14 obtained boron-containing mesoporous carbons by using SBA-15 as a hard template, sucrose as a carbon precursor and boric acid as boron precursor. It was shown that the boron doping can be increased by increasing the initial mass ratio of boric acid to sucrose, but only 0.6% boron content was achieved. Yong Wang and co-workers synthesized boron and fluorine-enriched polymeric carbon nitride using an ionic liquid as a soft template,24 which has boron and fluorine species. This approach has some practical drawbacks due to high cost of ionic liquids. Recently Xiaochen and co-workers12 synthesized boron and phosphorus-doped mesoporous carbons using a soft-templating method. It was shown that the resulting materials have a maximum boron doping of about 0.69% with a maximum surface area of about 700 m2 g−1 and average pore width in the range between 4.9 and 6.5 nm. In terms of capacitance it is essential to have mesoporous carbon materials with a high surface area and large pore size to facilitate the transport of the electrolyte solution throughout the material. Therefore, there is still a need to prepare boron-containing carbons with higher boron content, larger specific surface and better mesoporosity.
Herein we demonstrate a simple method for the synthesis of boron-enriched ordered mesoporous carbon (OMC) materials using a commercially available poly(ethylene oxide)-poly(propylene oxide)-poly(ethylene oxide) triblock copolymer, Pluronic F127, as a soft template, boric acid as the boron precursor and resorcinol/formaldehyde as carbon precursors. The latter precursors polymerize in the hydrophilic mesodomains of Pluronic F127 giving a mesostructured polymeric composite, which after carbonization yields B-containing OMC. This strategy afforded OMC materials with well developed mesoporosity, high specific surface area, large pore volume, high boron percentage, and strong acidic sites.
2. Experimental
2.1 Chemicals
Poly(ethylene oxide)–poly(propylene oxide)–poly(ethylene oxide) triblock copolymer (EO106PO70EO106; Pluronic F127) was provided by BASF Corporation. Resorcinol (C6H4(OH)2; 98%), formaldehyde (HCHO), boric acid and tetraethyl orthosilicate (TEOS, 98%) were purchased from Acros Organics. HCl (35–38%) was acquired from Fischer and ethanol (95%) from Pharmco.2.2 Synthesis of boron-containing mesoporous carbons
Boron-containing mesoporous carbons were synthesized by using a slightly modified recipe of Gorka et al.,19 as shown in Scheme 1. Approximately 1.25 g of resorcinol and 1.25 g of the poly (ethylene oxide)-poly(propylene oxide)-poly(ethylene oxide) triblock copolymer (Pluronic F127) were dissolved in deionized water and ethanol. The weight ratio of water to ethanol was fixed at 5.5![[thin space (1/6-em)]](https://www.rsc.org/images/entities/char_2009.gif) :
:![[thin space (1/6-em)]](https://www.rsc.org/images/entities/char_2009.gif) 10. Boron-containing mesoporous carbons with different boron percentages were obtained by varying the amount of boric acid (0.1–0.5 g) added into the synthesis mixture, which was stirred until the boric acid was dissolved. Next, 1.1 mL of 37% HCl acid was added and the resulting mixture was stirred for another 30 min. Subsequently, 1.25 mL of formaldehyde was added to the synthesis mixture. When the solution becomes turbid, stirring was continued for additional 30 min. After stopping stirring, the mixture was separated into aqueous and solid phases. The polymer-containing bottom phase was spread on the Petri dish and left overnight in a fume hood. Next, the sample was aged at 100 °C for 24 h. Thermal treatment was performed in flowing nitrogen in the tube furnace using a heating rate of 2 °C min−1 up to 180 °C, kept for 5 h at 180 °C and heating resumed with 2 °C min−1 up to 400 °C. Further thermal treatment was performed as follows: in the synthesis of porous polymers the samples were kept at 400 °C for 2 h, whereas in the synthesis of carbons the samples were heated from 400 to 850 °C using a heating rate of 5 °C min−1 and kept at 850 °C for 2 h. The resulting samples were labelled as X-B-y-t, where X = P (polymer) and C (carbon); B refers to boric acid; y and t indicate the boric acid percentage and the final temperature of thermal treatment, respectively. As a control experiment, another sample was prepared by the same process without adding boric acid. The boron-free polymer was named as P-ref-400. After carbonization this sample was labelled as C-ref-850.
10. Boron-containing mesoporous carbons with different boron percentages were obtained by varying the amount of boric acid (0.1–0.5 g) added into the synthesis mixture, which was stirred until the boric acid was dissolved. Next, 1.1 mL of 37% HCl acid was added and the resulting mixture was stirred for another 30 min. Subsequently, 1.25 mL of formaldehyde was added to the synthesis mixture. When the solution becomes turbid, stirring was continued for additional 30 min. After stopping stirring, the mixture was separated into aqueous and solid phases. The polymer-containing bottom phase was spread on the Petri dish and left overnight in a fume hood. Next, the sample was aged at 100 °C for 24 h. Thermal treatment was performed in flowing nitrogen in the tube furnace using a heating rate of 2 °C min−1 up to 180 °C, kept for 5 h at 180 °C and heating resumed with 2 °C min−1 up to 400 °C. Further thermal treatment was performed as follows: in the synthesis of porous polymers the samples were kept at 400 °C for 2 h, whereas in the synthesis of carbons the samples were heated from 400 to 850 °C using a heating rate of 5 °C min−1 and kept at 850 °C for 2 h. The resulting samples were labelled as X-B-y-t, where X = P (polymer) and C (carbon); B refers to boric acid; y and t indicate the boric acid percentage and the final temperature of thermal treatment, respectively. As a control experiment, another sample was prepared by the same process without adding boric acid. The boron-free polymer was named as P-ref-400. After carbonization this sample was labelled as C-ref-850.
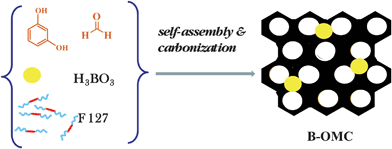 | ||
| Scheme 1 A soft-templating route used for the synthesis of boron-containing ordered mesoporous carbons (OMC) using resorcinol and formaldehyde as carbon precursors, triblock copolymer Pluronic F127 as a soft template and boric acid as a source of doping element. | ||
2.3 Synthesis of boron-containing mesoporous carbons in the presence of TEOS
Another series of carbons was prepared similarly to those described in the preceding section but in the presence of TEOS (see Scheme 2). In contrast to the previous recipe, the amount of solvent and Pluronic F127 was increased by 60% to accommodate a large amount of TEOS. The latter was used in order to enhance the microporosity of the resulting carbons and consequently enlarge their specific surface area. However, the weight ratio of water to ethanol was kept the same as in the previous recipe. Approximately 1.25 g of resorcinol and 2.00 g of Pluronic F127 were dissolved in deionized water and ethanol. The weight ratio of water to ethanol was fixed at 5.5![[thin space (1/6-em)]](https://www.rsc.org/images/entities/char_2009.gif) :
:![[thin space (1/6-em)]](https://www.rsc.org/images/entities/char_2009.gif) 10. The resulting mixture was stirred for 15–20 min. Next boric acid was added to the solution and stirring was continued until the boric acid was dissolved. In the next stage 1.1 mL of 37% HCl acid was added and stirring was continued for another 30 min. Then 1.25 mL of formaldehyde was added under stirring for 20 min. Subsequently, 2.8 g of TEOS was added to the mixture. After the solution become turbid, stirring was continued for additional 30 min. After stopping stirring the synthesis mixture was separated into aqueous and solid phases. The polymer-containing bottom phase was spread on a Petri dish and kept overnight in a fume hood. Next, this sample was aged at 100 °C for 24 h. Thermal treatment was the same as in the case of the samples prepared without TEOS. The resulting samples were labelled X-B-y-T-z-t, where X = P (polymer) and C (carbon); B and T refer to boric acid and TEOS, respectively; where y and z indicate the boric acid and TEOS percentages, whereas t denotes the final temperature of thermal treatment. In order to remove the silica, the resulting samples were immersed in 3% NaOH solution for 24 h at 60 °C, then filtered, washed with deionized water and dried. The samples obtained after dissolution of silica were denoted as C-B-y-T-z-t*.
10. The resulting mixture was stirred for 15–20 min. Next boric acid was added to the solution and stirring was continued until the boric acid was dissolved. In the next stage 1.1 mL of 37% HCl acid was added and stirring was continued for another 30 min. Then 1.25 mL of formaldehyde was added under stirring for 20 min. Subsequently, 2.8 g of TEOS was added to the mixture. After the solution become turbid, stirring was continued for additional 30 min. After stopping stirring the synthesis mixture was separated into aqueous and solid phases. The polymer-containing bottom phase was spread on a Petri dish and kept overnight in a fume hood. Next, this sample was aged at 100 °C for 24 h. Thermal treatment was the same as in the case of the samples prepared without TEOS. The resulting samples were labelled X-B-y-T-z-t, where X = P (polymer) and C (carbon); B and T refer to boric acid and TEOS, respectively; where y and z indicate the boric acid and TEOS percentages, whereas t denotes the final temperature of thermal treatment. In order to remove the silica, the resulting samples were immersed in 3% NaOH solution for 24 h at 60 °C, then filtered, washed with deionized water and dried. The samples obtained after dissolution of silica were denoted as C-B-y-T-z-t*.
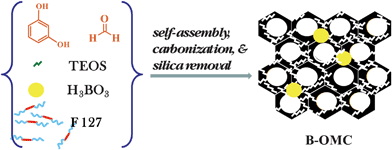 | ||
| Scheme 2 The same soft-templating route as in Scheme 1 but with added TEOS as a template for the formation of microporosity. | ||
2.4 Characterization
Nitrogen adsorption isotherms were measured at −196 °C on ASAP 2010 and 2020 volumetric adsorption analyzers manufactured by Micromeritics (Norcross, GA, USA) using nitrogen of 99.998% purity. Before adsorption measurements, each sample was degassed under a vacuum for at least 2 h at 200 °C. The specific surface area of the samples was calculated using the Brunauer–Emmett–Teller (BET) method within the relative pressure range of 0.05–0.20. Pore size distributions were calculated using the BJH algorithm for cylindrical pores according to the KJS method calibrated for pores up to 19 nm.25,26The X-ray diffraction (XRD) measurements were recorded for the calcined and carbonized samples using a PANanalytical, Inc. X'Pert Pro (MPD) Multi Purpose Diffractometer with Cu-Kα radiation (1.5406 Å), an operating voltage of 40 kV, 0.020° step size, 4 s step time, and 10.0° < 2θ < 80.0° range at room temperature. Low angle powder XRD measurements were conducted in the range of 0.4° < 2θ < 5.0°, 0.01° step size and 20 s step time.
The thermogravimetric (TG) measurements were performed on a TA Instruments TGA 2950 thermogravimetric analyzer using a high-resolution mode. The curves were recorded in flowing air with a heating rate of 10 °C min−1 from 30 to 800 °C.
The X-ray photoelectron spectroscopy (XPS) measurements were performed using the Phi 5600 ESCA system (Physical Electronics, Inc., Chanhassen, MN). First, a 20–60 min overview scan (0.4 eV step) and high-resolution scans (0.1 eV step) were performed in the binding energy range of 0–1,100 eV.
The NH3 temperature programmed desorption (TPD) experiments were performed using a Micromeritics Auto Chem II Chemisorption Analyzer (Norcross, GA, USA) equipped with a thermal conductivity detector (TCD). Approximately 0.20 g of each sample was loaded in a quartz tube micro-reactor supported by quartz wool and degassed at 500 °C with a heating rate of 5 °C min−1 in flowing He (50 cm3 min−1). Next, the samples were cooled to 180 °C and exposed to flowing 5% NH3–He (50 cm3 min-1) for 1 h and finally purged in flowing He for 1 h. In the TPD experiments, the samples were heated to 500 °C using 10 °C min−1 heating rate and kept at this temperature for 30 min. The amounts of desorbed NH3 was obtained by integration of the desorption profiles and referenced to the TCD signals calibrated for known volumes of analysis gases.
TEM images were obtained using FEI Tecnai F20ST/STEM instrument operated at 200 keV. The preparation of samples for TEM analysis involved sonication of the sample in ethanol for 2 to 5 min and deposition on a 400 mesh lacy carbon coated copper grid
3. Results and discussion
3.1 Boron-containing mesoporous carbons prepared without TEOS addition
First, the B-containing OMC samples are discussed. Nitrogen adsorption isotherms measured on these samples are presented in Fig. 1; panel A of this figure shows isotherms for mesoporous polymers (P-B-x-t). All isotherms in this panel are type IV with an H1-type hysteresis loop and steep capillary condensation steps occurring at relative pressures of 0.7–0.8. Nitrogen adsorption isotherms for the corresponding carbon samples are shown in panel B of Fig. 1. In this case, all adsorption isotherms except those measured on C-B-50-850 are type IV with an H1 hysteresis loop and a steep increase in adsorption at low pressures due to the presence of micropores. The adsorption isotherm on C-B-50-850 is much lower with an H2 hysteresis loop representing delayed desorption due to possible pore constrictions. The remaining isotherms (see both panels of Fig. 1) exhibit steep capillary condensation steps that reflect narrow pore size distributions (PSDs) as shown in insets. In addition to uniform mesoporosity, which is evidenced by a narrow PSD peak (see insets), both polymeric and carbon samples show some microporosity, which is evidenced by a small peak on the PSD curves around 2 nm.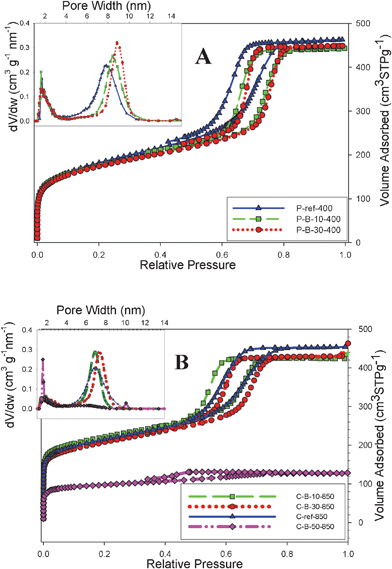 | ||
| Fig. 1 Nitrogen adsorption isotherms and the corresponding pore size distributions (dV/dw where V and w denote the pore volume and pore width, respectively, for B-containing mesoporous (A) polymers and (B) carbons synthesized by soft templating method. | ||
Adsorption parameters for both polymeric and carbon samples obtained by the analysis of nitrogen adsorption isotherms shown in Fig. 1(A and B) are listed in Table 1. As can be seen from this table, except for the C-B-50-850 sample, the specific surface area of the samples obtained without TEOS addition are in the range between 600 and 800 m2 g−1, the single-point pore volume is about 0.7 cm3 g−1, the micropore volume is between 0.15 and 0.20 cm3 g−1, and the pore widths are between 7 and 10 nm. Thus, the aforementioned polymeric and carbon samples have high surface area, large pore volume and well-developed mesoporosity with an appreciable amount of micropores. Note that after carbonization at 850 °C, the total adsorption of the B-containing carbon samples is slightly increased due to increase in the microporosity and the capillary condensation step shifts towards smaller pores due to structure shrinkage at high temperatures. Therefore, the carbonized samples have a slightly higher surface area and microporosity and slightly smaller pore widths. However, a substantial increase in the amount of boric acid added to the synthesis mixture caused deterioration of the mesoporous structure as it is evidenced for the C-B-50-850 carbon sample. The shape of nitrogen adsorption isotherms was not affected for up to 30% of boric acid added, indicating that in this range the structure alterations were insignificant. The C-B-50-850 sample exhibited a lower surface area than the carbon samples obtained at lower boric acid percentage; thus, the optimal amount of boric acid, which can be added to the synthesis mixture without significant structure deterioration, is between 30–40%.
| Sample | S BET(m2 g−1) | V t (cm3 g−1) | V mi(cm3 g−1) | V me(cm3 g−1) | w (nm) | Residue (%) |
|---|---|---|---|---|---|---|
| a S BET: BET specific surface area; Vt: single-point pore volume; Vmi: volume of micropores obtained by integration of PSD up to 3 nm; Vme:volume of mesopores obtained by subtracting Vmi from Vt; w: mesopore width at the maximum of PSD; residue % at 800 °C of the TG profile recorded in flowing air. | ||||||
| P-ref-400 | 651 | 0.74 | 0.15 | 0.59 | 7.8 | — |
| P-B-10-400 | 627 | 0.68 | 0.15 | 0.54 | 8.4 | 11.6 |
| P-B-30-400 | 620 | 0.69 | 0.14 | 0.55 | 8.8 | 21.6 |
| C-ref-850 | 751 | 0.73 | 0.21 | 0.52 | 6.9 | - |
| C-B-10-850 | 776 | 0.63 | 0.20 | 0.43 | 6.8 | 6.6 |
| C-B-30-850 | 728 | 0.73 | 0.17 | 0.56 | 7.3 | 12.3 |
| C-B-50-850 | 340 | 0.18 | 0.12 | 0.06 | — | 26.3 |
| C-B-10-T-50-850 | 511 | 0.64 | 0.07 | 0.59 | 9.7 | 43.7 |
| C-B-10-T-50-850* | 1396 | 1.39 | 0.42 | 0.97 | 9.8 | 8.4 |
| C-B-30-T-50-850 | 483 | 0.63 | 0.04 | 0.59 | 9.6 | 45.8 |
| C-B-30-T-50-850* | 1135 | 1.38 | 0.25 | 1.11 | 9.9 | 8.7 |
| C-B-50-T-50-850 | 330 | 0.45 | 0.03 | 0.42 | 9.7 | 52.7 |
| C-B-50-T-50-850* | 1047 | 1.13 | 0.30 | 0.81 | 9.7 | 15.7 |
The amount of incorporated boron in the carbon matrix was estimated by thermogravimetric analysis in flowing air. The weight change (TG) and differential (DTG) profiles for the boron-containing carbon samples are shown in Fig. 2. The residues at 800 °C are listed in Table 1; these residues primarily consist of boron oxide and their values increase with the increasing amount of boric acid added to the synthesis mixture. After converting these values to B%, the 10 and 30% addition of boric acid to the synthesis mixture resulted in the carbon samples with about 2.2 and 3.8% of boron, respectively.
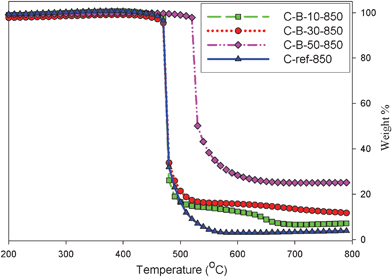 | ||
| Fig. 2 TG profiles for B-containing mesoporous carbons. | ||
The X-ray diffraction (XRD) patterns for the carbon samples obtained without TEOS addition are shown in Fig. 3. Panel A in this figure shows that the low angle XRD patterns for the carbon samples obtained with 10 and 30% of boric acid feature one distinct peak with a shoulder, indicating the presence of uniform and even ordered mesopores. This mesostructural ordering is clearly confirmed by the TEM images shown in Fig. 4. However, the XRD pattern for C-B-50-850 is very broad, which suggests that the addition of 50% boric acid to the synthesis mixture disturbed the self-assembly process, which led to disordered mesoporosity in this sample. The wide angle XRD patterns of B-containing carbon samples are shown in panel B of Fig. 3. Two broad and weak peaks at 2θ of around 25 and 44 degrees are observed, which are characteristic of many amorphous carbons. The first very broad peak, (002), is often associated with the turbostratic carbon structure having randomly oriented graphene layers, while the graphitized carbons show a high-intensity sharp (002) signal corresponding to the 0.34-nm-interlayer spacing along with clearly visible other (100), (101), and (004) reflections characteristic for 2D and 3D graphitic structures.27 The aforementioned broad diffraction peaks suggest that no pronounced graphitization occurred during carbonization of B-containing phenolic resins at 850 °C because these resins are known to be graphitization resistant.
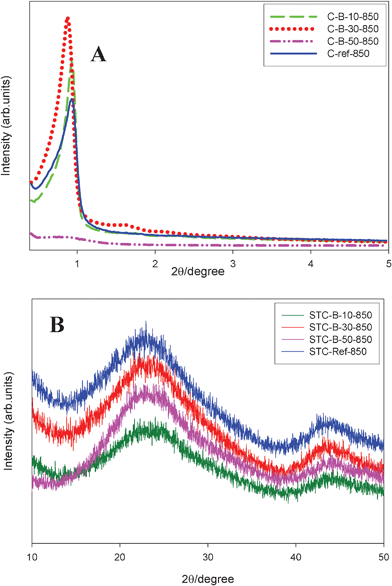 | ||
| Fig. 3 (A) Low angle and (B) wide angle XRD patterns for B-containing mesoporous carbons. | ||
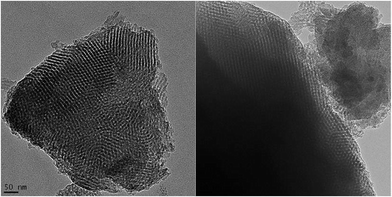 | ||
| Fig. 4 TEM images for the C-B-30-850 sample; the scale bar 50 nm refers to both images. Estimation of the pore widths gives 7.4–7.6 nm, which is close to the value provided in Table 1 for this sample. | ||
The composition of the C-B-30-850 sample was also analyzed by XPS. An overview spectrum is shown in Fig. 5. Four measurements were taken from different spots on the sample (Fig. S1, ESI†) and the elemental (C, O and B) composition of this sample is provided in Table S1 (ESI†). As can be seen from this data, the chemical composition is almost the same throughout the sample, indicating chemical homogeneity of these carbons. The B1s peak centered at 192.6 eV corresponds to B2O3. The boron compound added to the synthesis mixture was boric acid, which after dehydration during carbonization process yielded B2O3. Also, the XPS analysis shows that the atomic percentage of B in C-B-30-850 materials is 1.5–1.8%. No peaks observed around 186 and 190 eV indicate the absence of B4C and BN groups in this carbon sample. This indicates that boron was mainly present in the carbon sample in the form B2O3 and no substantial doping occurred into the carbon framework. Sinha et al.28 showed that the B4C structure was formed only when the boron oxide–carbon composite was heated to around 1400 °C. In this study, the boron–carbon composite was carbonized at 850 °C. The O1s peak is centered at about 532.4 eV indicating the presence of acetate groups (NIST XPS database). The C1s peak is centered at about 284.5 eV, which could be assigned to the graphitic sites in the carbon framework.
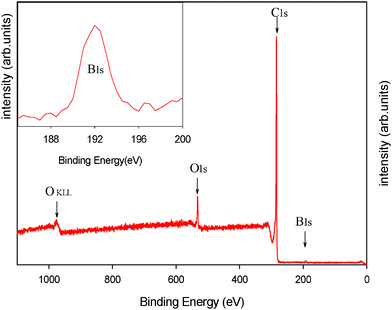 | ||
| Fig. 5 XPS spectra for the C-B-30-850 sample. | ||
Acidic properties of boron-containing carbons were examined by NH3-TPD. The NH3-TPD spectra are shown in Fig. 6. The amount of acidic sites obtained from NH3-TPD data was higher for boron-containing carbons than for the reference carbon prepared without boric acid addition. The amounts of NH3 chemisorbed on the C-B-30-850 and C-ref-850 are 223.8 and 117.1 μmol g−1, respectively. The strength of the acidic sites, estimated on the basis of maximum desorption temperature, was similar for both samples; this maximum was found to be at about 490 °C. The boron-containing sample was almost twice as acidic than the reference carbon sample. The TPD data indicates that the acidity of the carbon samples studied can be increased by introducing boric acid during the self-assembly synthesis. Therefore, the addition of boric acid to the synthesis mixture can be used to incorporate boron species, to increase the acidity of the resulting carbons and to slightly enhance microporosity in the samples.
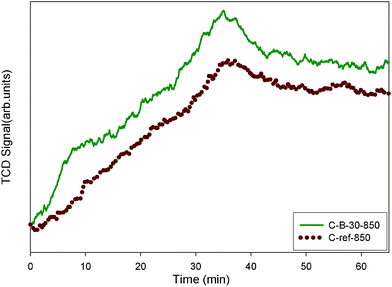 | ||
| Fig. 6 NH3-TPD profiles for C-B-30-850 and C-ref-850. | ||
3.2 Boron-containing mesoporous carbons prepared with TEOS addition
Another series of boron-containing mesoporous carbons was prepared with TEOS addition in order to enlarge the specific surface area of these carbons. The fixed amount of TEOS (50% of TEOS in comparison to the polymer weight) was used. Nitrogen adsorption isotherms and the corresponding pore size distributions for boron-containing silica-carbon composite mesostructures are shown in Fig. 7. Adsorption parameters evaluated on the basis of these isotherms are listed in Table 1. All isotherms are type IV with a steep increase in adsorption at low pressures due to the presence of micropores and H1-type hysteresis loops having steep capillary condensation steps located in the 0.7–0.8 range of relative pressures. As can be seen from inset in Fig. 7 the PSD curves are narrow and show mesopores with diameters of about 10 nm. Note that these composite carbons show lower adsorption than the corresponding samples prepared without TEOS addition (see Table 1 and adsorption isotherms in Fig. 1B and 7). The observed reduction in the amount adsorbed on the boron-containing silica–carbon composites is mainly due to the smaller amount of carbon in the composite samples. A comparison of residues (see Table 1) for the boron-containing silica-carbon composites indicates that about 35% of the sample accounts for the silica; this estimation was made on the basis of the TG profiles before and after silica dissolution (see Fig. S2, ESI†).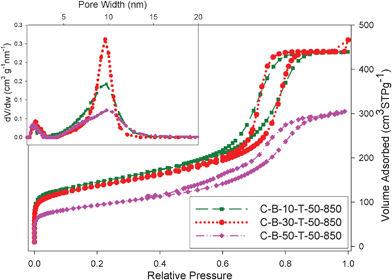 | ||
| Fig. 7 Nitrogen adsorption isotherms and the corresponding pore size distributions for the B-containing carbon–silica composites. | ||
TEOS was used in the synthesis of the B-containing OMC samples because it does not perturb the formation of ordered mesostructures. It is known that the TEOS-assisted self-assembly of carbon precursors in the presence of block copolymers gives uniform and ordered silica-carbon mesostructures, which after the dissolution of silica gain substantial microporosity in addition to ordered mesopores. Consequently, nitrogen adsorption measured on the boron-containing carbon samples obtained after dissolution of the TEOS-generated silica (see Fig. 8) is much higher than that on the corresponding carbon samples prepared without TEOS assistance. As can be seen from Table 1, which contains adsorption parameters for the composite samples before and after the dissolution of silica, the specific surface area, the single-point pore volume, and the micropore volume of the silica-dissolved carbon samples increased significantly in comparison to the corresponding parameters of the carbon samples prepared without TEOS addition. Namely, the pore volume of the former samples almost doubled due to significant increase in the micropore volume and some enlargement in the mesopore size. Also, the specific surface area of the silica-dissolved carbon samples increased about 30%. All silica-dissolved carbon samples prepared with 10 and 30% of boric acid show steep capillary condensation steps, reflecting narrow distribution of mesopores. Interestingly, the C-B-50-T-50-850* sample, which was obtained in the presence of 50% boric acid and 50% TEOS in comparison to the polymer weight, has much better adsorption properties than the corresponding sample obtained without TEOS assistance (see adsorption isotherms in Fig. 1B and 8). This result suggests that TEOS facilitates the self-assembly of carbon precursors and allows for a higher loading of boric acid without significant deterioration of the mesostructure. Another interesting feature of the silica-dissolved carbon composites is the larger pore width, which is due to the enlargement of mesopores during the TEOS-assisted self-assembly process.29 The observed enlargement of the surface area, microporosity and mesopore widths accompanied with incorporation of boron species is beneficial for the enhancement of the capacitance due to better surface accessibility and faster transport of the electrolyte solution through the electrode materials.30
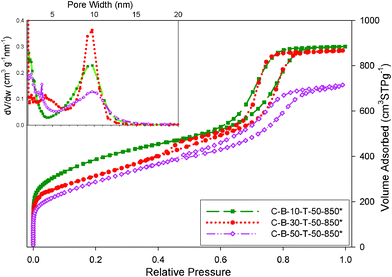 | ||
| Fig. 8 Nitrogen adsorption isotherms and the corresponding pore size distributions for the B-containing carbons obtained form carbon–silica composites by dissolution of silica. | ||
The TG profiles shown in Fig. S2, ESI† and XPS data indicate that the B content can be increased with increased loading of boric acid in the synthesis mixture. Also, it is desirable to retain a small percentage of silica (below 6%) in carbon mesostructures because it may be beneficial for the energy storage properties of these materials.31
Note that the B-containing carbon samples obtained after dissolution of silica show a distinct XRD peak in the range of low angles (Fig. 9) indicating uniform mesoporosity. The intensity of this peak is much higher than that observed for the carbon samples prepared without TEOS assistance (Fig. S3, ESI†). This is not surprising if one takes into account the fact that TEOS enhances the formation of ordered carbon mesostructures.
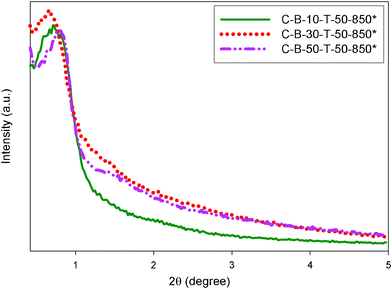 | ||
| Fig. 9 Low angle XRD patterns for the B-containing carbons obtained after dissolution of silica in B-containing carbon–silica composites. | ||
4. Conclusions
This study shows that the TEOS-assisted synthesis of OMCs in the presence of boric acid allowed for the larger loading of boron species and for the enlargement of the specific surface area and microporosity of the boron-containing carbon mesostructures. The resulting carbon samples featured accessible mesopores of about 10 nm, surface area exceeding 1000 m2 g−1 and the pore volume exceeding 1 cm3 g−1. The overall improvement of adsorption and structural properties of these carbons in addition to the incorporated boron species make these materials attractive for energy-related applications such as capacitors and batteries.Acknowledgements
This work was supported by National Science Foundation under CHE-0848352 grant. The authors thank Dr J. Gorka (currently at Oak Ridge National Laboratory) for helpful discussions and the BASF Co. for providing the triblock copolymer. The authors thank Dr. Min Gao of the Liquid Crystal Institute at Kent State University for assistance in obtaining TEM images.References
- L. Yang, S. Jiang, Y. Zhao, L. Zhu, S. Chen, X. Wang, Q. Wu, J. Ma, Y. Ma and Z. Hu, Angew. Chem., Int. Ed., 2011, 50, 7132 CrossRef CAS.
- W. Yang, T. Fellinger and M. Antonietti, J. Am. Chem. Soc., 2011, 133, 206 CrossRef CAS.
- S. Heng Liu and J. Wu, Int. J. Hydrogen Energy, 2011, 36, 87 CrossRef.
- R. Liu, D. Wu, X. Feng and K. Mullen, Angew. Chem., Int. Ed., 2010, 49, 2565 CrossRef CAS.
- Y. Jeong and T. C. M. Chung, Carbon, 2010, 48, 2526 CrossRef CAS.
- H. Lee, Solid State Commun., 2010, 150, 1959 CrossRef CAS.
- Y. Shao, X. Wang, M. Engelhard, C. Wang, S. Dai, J. Liu, Z. Yang and Y. Lin, J. Power Sources, 2010, 195, 4375 CrossRef CAS.
- X. Yang, D. Wu, X. Chen and R. Fu, J. Phys. Chem. C, 2010, 114, 8581 CAS.
- T. Kwon, H. Nishihara, H. Itoi, Q. Yang and T. Kyotani, Langmuir, 2009, 25, 11961 CrossRef CAS.
- C. Deng, J. Chen, X. Chen, M. Wang, Z. Nie and S. Yao, Electrochim. Acta, 2009, 54, 3298 CrossRef CAS.
- E. Rodríguez, I. Cameán, R. García and A. García, Electrochim. Acta, 2011, 56, 5090 CrossRef.
- X. Zhao, A. Wang, J. Yan, G. Sun, L. Sun and and T. Zhang, Chem. Mater., 2010, 22, 5463 CrossRef CAS.
- S. Shiraishi, M. Kibe, T. Yokoyama, H. Kurihara, N. Patel, A. Oya, Y. Kaburagi and Y. Hishiyama, Appl. Phys. A: Mater. Sci. Process., 2006, 82, 585 CrossRef CAS.
- D. Wang, F. Li, Z. Chen, G. Q. Lu and H. Cheng, Chem. Mater., 2008, 20, 7195 CrossRef CAS.
- S. K. Bhatia and A. L. Myers, Langmuir, 2006, 22, 1688 CrossRef CAS.
- P. Benard and R. Chahine, Langmuir, 2001, 17, 1950 CrossRef CAS.
- Z. Zhou, X. Gao, J. Yan and D. Song, Carbon, 2006, 44, 939 CrossRef CAS.
- Y. Kim, Y. Zhao, A. Williamson, M. J. Heben and S. B. Zhang, Phys. Rev. Lett., 2006, 96, 16102 CrossRef.
- J. Gorka and M. Jaroniec, J. Phys. Chem. C, 2008, 112, 11657 CAS.
- M. Jaroniec, J. Gorka, J. Choma and A. Zawislak, Carbon, 2009, 47, 3034 CrossRef CAS.
- K. C. Mondal, A. M. Strydom, Z. Tetana, S. D. Mhlanga, M. J. Witcomb, J. Havel, R. M. Erasmus and N. J. Coville, Mater. Chem. Phys., 2009, 114, 973 CrossRef CAS.
- G. Yin, Y. Gao, P. Shi, X. Cheng and A. Aramata, Mater. Chem. Phys., 2003, 80, 94 CrossRef CAS.
- T. E. Rufford, D. H. Jurcakova, Z. Zhu and G. Q. Lu, J. Phys. Chem. C, 2009, 113, 19335 CAS.
- Y. Wang, J. Zhang, X. Wang, M. Antonietti and H. Li, Angew. Chem. Int. Ed., 2010, 49, 3356 CAS.
- S. Brunauer, P. H. Emmett and E. Teller, J. Am. Chem. Soc., 1938, 60, 309 CrossRef CAS.
- M. Kruk and M. Jaroniec, Chem. Mater., 2001, 13, 3169 CrossRef CAS.
- S. B. Yoon, G. S. Chai, S. K. Kang, J. S. Yu, K. P. Gierszal and M. Jaroniec, J. Am. Chem. Soc., 2005, 127, 4188 CrossRef CAS.
- A. Sinha, T. Mahata and B. P. Sharma, J. Nucl. Mater., 2002,(301), 165 CrossRef CAS.
- M. Jaroniec, J. Gorka, J. Choma and A. Zawislak, Carbon, 2009, 47, 3034 CrossRef CAS.
- J. Huang, B. G. Sumpter and V. Meunier, Angew. Chem. Int. Ed., 2008, 47, 520 CrossRef CAS.
- J. K. Shon, H. Kim, S. S. Kong, S. H. Hwang, T. H. Han, J. M. Kim, C. Pak, S. Doo and H. Chang, J. Mater. Chem., 2009, 19, 6727 RSC.
Footnote |
| † Electronic Supplementary Information (ESI) available. See DOI: 10.1039/c2ra00920j/ |
| This journal is © The Royal Society of Chemistry 2012 |
