Structural properties of amorphous diamond-like carbon: percolation, cluster, and pair correlation analysis
Piotr
Kowalczyk
*a,
Piotr A.
Gauden
b and
Artur P.
Terzyk
b
aNanochemistry Research Institute, Department of Chemistry, Curtin University of Technology, P.O. Box U1987, Perth, 6845 Western Australia, Australia. E-mail: Piotr.Kowalczyk@curtin.edu.au; Tel: +61 8 9266 7800
bDepartment of Chemistry, Physicochemistry of Carbon Materials Research Group, N. Copernicus University, Gagarin St. 7, 87-100, Torun, Poland
First published on 28th March 2012
Abstract
A detailed atomistic model of amorphous diamond-like carbon was developed combining experimental neutron scattering data (K. W. R. Gilkes, P. H. Gaskell and J. Robertson, Phys. Rev. B, 1995, 51, 12303) with the hybrid reverse Monte Carlo method. From the experimentally consistent nanoscale model of the disordered tetrahedral carbon we computed various properties, including: binding energy distribution, neighbor distribution function, bond angle distribution, cluster size distributions for different C–C bond lengths, and percolation threshold. Analysis of microscopic configurations revealed that the network structure of the studied amorphous diamond-like carbon lacks any graphitic fragments (i.e., regular hexagons with a 120° C–C–C bond angle). We found that for the assumed C–C bond length ≤ 1.42 Å (i.e., sp2 hybridization), the carbon network is poorly connected with a 70% contribution from isolated carbon atoms. The percolation threshold corresponds to a C–C bond length ≤ 1.52 Å, which is close to 1.54 Å (i.e., C–C bond length in perfect diamond). This finding is consistent with experimental high levels of tetrahedral bonding (i.e., sp3 hybridization) reported for high density tetrahedral amorphous carbons (i.e., sp3 fraction of 80–85%). Thus, we concluded that the HRMC method complemented with cluster size analysis and determination of percolation threshold is a promising methodology in studies of ill-defined carbonaceous materials.
1. Introduction
The physical properties of amorphous carbons (e.g. thermal, mechanical, and electrical) are strongly dependent on the spatial distribution of carbon atoms.1,3 Thus, the microscopic insight into the degree of local order: in particular, the coordination to nearest neighbors, hybridization (sp2![[thin space (1/6-em)]](https://www.rsc.org/images/entities/char_2009.gif) :
:![[thin space (1/6-em)]](https://www.rsc.org/images/entities/char_2009.gif) sp3 ratio), and percolation threshold, is crucial to understand how the molecular configuration within a single amorphous phase affects these properties. Diffraction methods (X-ray, electron and neutron scattering) are the most powerful techniques that can be used to probe statistical correlations between pairs of atoms in disordered amorphous carbons.1–2,4–6 However, extraction of microscopic details directly from diffraction measurements is impossible, because diffraction patterns provide average information about the local structure of disordered material in terms of the one dimensional function, i.e., structure factor and radial distribution function.4–6
sp3 ratio), and percolation threshold, is crucial to understand how the molecular configuration within a single amorphous phase affects these properties. Diffraction methods (X-ray, electron and neutron scattering) are the most powerful techniques that can be used to probe statistical correlations between pairs of atoms in disordered amorphous carbons.1–2,4–6 However, extraction of microscopic details directly from diffraction measurements is impossible, because diffraction patterns provide average information about the local structure of disordered material in terms of the one dimensional function, i.e., structure factor and radial distribution function.4–6
The absence of crystalline order in amorphous carbonaceous materials leads to ambiguity in experimental characterization, and thus atomistic simulations have an important role to pay in the determination of the relation between the atomistic structure and various macroscopic properties of these materials. Novel simulation algorithms (e.g. reverse Monte Carlo, hybrid reverse Monte Carlo, and quench Car–Parrinello molecular dynamics) have been used to gain more insight into the degree of local order in disordered carbonaceous materials.3,4,7–17 As has been shown, the conventional reverse Monte Carlo (RMC) algorithm produces highly unrealistic networks of tetrahedral amorphous carbon exemplified by a large population of high-energetic small carbon rings.11,14 Although some additional constraints have been adopted in RMC code,4 the satisfactory reproduction of experimental neuron scattering data has not be achieved so far. Liquid quench by using the Car–Parrinello ab inito molecular dynamics (CPMD) method has been successfully used for the generation of physically realistic carbon microstructures of amorphous diamond-like carbons.7–10 However, this method suffers due to its computationally intensive nature that limits the size of the simulation system and rules out the estimation of uncertainties due to statistical fluctuations, which requires many separate simulations. Clearly, one can use less sophisticated empirical potential in liquid quench that significantly reduces the computational cost of simulation.3,7–9 This however does not guarantee that the complex mixed hybridization in tetrahedral amorphous carbon can be reproduced without any other experimental constraint. In fact, it has been shown that simple empirical potentials (e.g. Tersoff, Brenner, reactive empirical bond order, and orthogonal tight-binding) are unable to correctly reproduce the microscopic structure of tetrahedral amorphous carbons (see Fig. 1 and 2 in ref. 3).
Hybrid reverse Monte Carlo (HRMC) with many-body environment-dependent interatomic potential (EDIP) is an interesting alternative in the modeling of carbonaceous materials, including amorphous diamond-like carbons. Like the conventional RMC method,18 the HRMC algorithm used experimental radial distribution function in the process of reconstruction of the three dimensional structure of ill-defined carbonaceous material.17–19 However, the additional energy constraint naturally penalized all unphysical C–C bonding, such as highly strained carbon rings as previously mentioned.19–22 That is why this method has been successfully used in the reconstruction of low density carbon systems dominated by sp2 atoms such as glassy carbons,22 as well as high density carbon materials dominated by sp3 atoms, such as tetrahedral amorphous carbons.11,14 In this work, we have used the HRMC method to investigate the various properties of tetrahedral amorphous carbon, including well-established characteristics: binding energy distribution, neighbor distribution function, and bond angle distribution. However, by contrast to previous studies,4,11,14 we focus on the cluster analysis and percolation threshold of carbon microstructures generated from HRMC methods. In the theoretical background we present a brief discussion of the methodology used, including definitions of computed properties. Finally, we discuss the computational results with special attention to the relation between the experimentally measured sp3 fraction and the structure of the carbon network.
2. Theoretical background
2.1 HRMC algorithm
The HRMC method is a hybrid of the Metropolis Monte Carlo (MMC) and the reverse Monte Carlo method (RMC).11,14,19–22 The purpose of the HRMC algorithm is to produce atomic configurations that are both consistent with experimental diffraction data and are physically realistic. The basic HRMC algorithm is simple.19 First, the initial configuration of carbon atoms consistent with experimental density is randomly placed in a simulation box surrounded by periodic boundary conditions. Next, for the selected β = 1/kBT, a carbon atom is randomly selected and moved to a new position by simple displacement. The trial configuration is than generated with the following acceptance probability,19 | (1) |
The first term in eqn (1) is the acceptance probability used in the conventional RMC algorithm,18 where χ is given by,
 | (2) |
 | (3) |
 | (4) |
The second term in eqn (1) is the acceptance probability used in conventional MMC simulations.19 Here, βΔE is the total energy difference between new and old configurations, and β = 1/kBT controls the contribution from the energy term in eqn (1). This energy based constraint enables generation of physically realistic carbon structures by penalizing the formation of artificial highly-energetic carbon structures, such as highly strained three and four member carbon rings. Both the nature of the carbon structures produced and the converge of the HRMC algorithm depend upon the quality of the potential used. In the current work, we employed the environmentally dependent interaction potential (EDIP) for calculation of the carbon–carbon interaction energy.3 This potential has been shown to provide a good physical description of disordered carbon networks and nanostructures.7,9,12–13
2.2 Simulation details
In the current work we performed fifty separate HRMC runs. In all performed HRMC simulations, we started from the random initial configuration of 1196 carbon atoms in a cubic simulation box of size 20.00406 Å. The number density of carbon atoms of 0.1494089 atoms Å−3 (i.e., 2.98 g cm−3) matched the macroscopic value of the carbon density of studied amorphous carbon.5 Note that this value of carbon density is typical for dense tetrahedral amorphous carbons.1–3 We assumed the error of σexp = 0.05 in eqn (2) for each experimental point on gexp(r). In each individual run, we used different cooling schemes to check the consistency of our methodology. The temperature was continuously decreased during all performed HRMC quench simulations (see option t smooth in ref. 19 for any other details). As others,19 we used three stages during the HRMC quench, however, we applied different temperatures at each stage to ensure that the computed properties do not depend on the particular quench scheme. A typical HRMC quench program consists of four temperatures, for example: 5000, 800, 500, and 300 K. In stage 1, all carbon atoms were heated up to 5000 K. Next, the temperature was continuously dropped to 800 K. In stage 2, the temperature of the carbon atoms was dropped from 800 K to 500 K. And finally, at stage 3, the temperature of the carbon atoms was further reduced to 300 K. For each stage, the number of quench steps was taken from ref. 19. To save computational time, the many-body neighbour lists were used in energy calculations (see option nnlist_option in ref. 19 for any other details). As mentioned above, the EDIP potential was used for the calculation of the carbon–carbon interaction energy. The potential parameters for carbon were taken from Marks;13 they are given in Table 1.| Two-body | ε = 20.0854 eV | B = 0.9538 Å | β = 0.049 |
| σ = 1.2571 Å | a = 1.8923 Å | a′ = 0.1698 Å | |
| Three-body | Z 0 = 3.615 | λ 0 = 19.86 eV | λ′ = 0.3 |
| λ = 1.3542 Å | q = 3.5 | ||
| Coordination | f low = 1.547 Å | f high = 2.27 Å | α = 1.544 |
| p low = 1.481 Å | p high = 2.0 Å | ||
| Z dih = 0.3 eV | Z rep = 0.06 eV | c 0 = 3.2 Å |
We found that the final structure of the studied amorphous diamond-like carbon does not depend on the particular cooling scheme. It means that the reconstructed atomistic configurations of studied carbon material are physical. Statistically speaking, they represent the most probable atomic structures of the studied disordered diamond-like amorphous carbon. Taking this into account, we averaged the final results over the fifty atomistic configurations generated from these HRMC simulations. All error bars were calculated as the standard error of the mean.
2.3 Binding energy and angle distribution
Binding energy and bond angle distributions collected from HRMC model configurations are described by the mathematical function that takes into account the asymmetry factor,26 | (5) |
2.4 Structure factor, neighbor distribution function, and cluster size distribution
In our HRMC simulations we fitted the experimental radial distribution function to the theoretical one. To check the quality of our structural model of studied amorphous diamond-like carbon, we computed the structure factor from the theoretical radial distribution function,23 | (6) |
Theoretical radial distribution, gth(r), was computed as an average over fifty final atomic configurations generated from the HRMC method.
The local structure of investigated amorphous diamond-like carbon is described by the simple neighbor distribution function, which is defined by the number of carbon atoms around a tagged carbon atom at a specified carbon–carbon distance, rc,23,27
 | (7) |
Cluster size distributions were computed as an average over the final fifty atomistic configurations of the investigated amorphous diamond-like carbon generated from the HRMC method. To identify the cluster size, we used simple carbon–carbon distance criterion implemented in the periodic simulation box.29 Percolation transition, i.e., the presence of an infinite cluster spanning the entire simulation box, was identified from computed cluster size distributions.
3. Results and discussion
The experimental structure factor gives the most probable positions of carbon atoms in the studied sample of amorphous diamond-like carbon. These most probable positions correspond to the average scattering from different domains of the tetrahedral amorphous carbon. Thus, in each individual domain of carbon sample the positions of carbon atoms can slightly vary from the most probable ones. In this sense, the positions of carbon atoms in reconstructed three dimensional replicas are the most probable ones.Fig. 1 shows the comparison between radial distribution functions measured from the neutron scattering experiment and extracted from HRMC simulations. Within the computed error bars, the gexp(r) is in very good agreement with gth(r). In comparison to a previous RMC study,4 we noticed a significant reduction of the discrepancy between experiment and theory. The first, second, and third peak on gexp(r) are successfully reconstructed from the HRMC method, which indicate the correct value of the experimental density and the robustness of the methodology used. Let us now compute sth(k) from gth(r) and compare with sexp(k) measured directly from the neuron scattering experiment4 (see Fig. 2). The agreement between both functions is very good in both the low-k and high-k region, which is fully consistent with the Opletal et al. study.11 Because sth(k) was not subject to the fitting, this result indicates that the used HRMC method successfully recovered the microscopic details of the studied amorphous diamond-like carbon whilst simultaneously producing low energy structures.
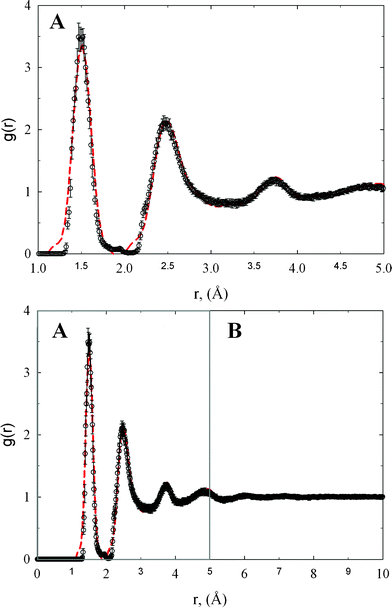 | ||
| Fig. 1 The comparison of experimental radial distribution function (dashed lines) with theoretical one computed from HRMC model configurations (circles). Panel A highlights the comparison between experimental and theoretical radial distribution function for r ≤ 5 Å. | ||
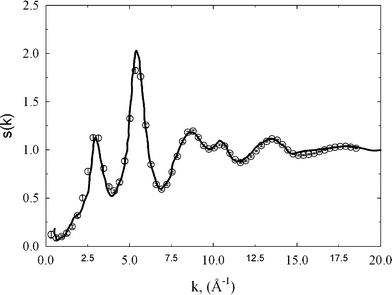 | ||
| Fig. 2 The comparison of experimental structure factor (circles) with theoretical one computed from HRMC model configurations (solid line). | ||
Indeed, binding energy distribution is characterized by a single low energy peak (see Fig. 3). Interestingly, the computed peak is asymmetric with the maximum and standard deviation of −6.75 and 0.38 eV atom−1, respectively. It is worth pointing out that similar asymmetric distribution of binding energy in amorphous carbon has been found in quench molecular dynamic simulations.17 Computed average values of binding energy of −6.99, −6.71, and −7.02 eV atom−1, are in good agreement with our calculations. The binding energy distribution for studied amorphous diamond-like carbon is broadened and shifted to higher values of energy as compared to perfect graphite or diamond crystal. Following Brenner,30 the binding energy between two carbon atoms in graphite crystal is −7.3768 eV atom−1. For diamond crystal this value is slightly higher, i.e., −7.3464 eV atom−1. The observed significant fraction of carbon atoms with a higher energetic state can be explained by the dispersion of bond lengths and angles in the studied carbon. Thus, the amorphous carbon network seems to represent a highly strained environment, where the average positions of carbon atoms are disturbed as compared to perfect graphite and diamond crystal. This seems physically reasonable because the conditions used for production of tetrahedral amorphous carbon (metastable state) are highly nonequilibrium.1,2
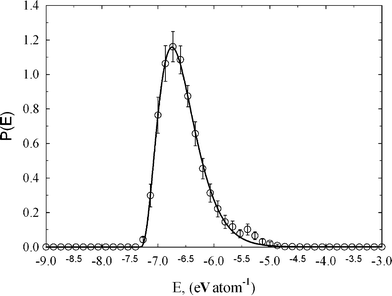 | ||
| Fig. 3 Binding energy distribution for studied amorphous diamond-like carbon computed from HRMC model configurations. Peak maximum and standard deviation is −6.75 and 0.38 eV atom−1, respectively. The asymmetry factor of 0.99 indicates non-Gaussian distribution of binding energy in the studied disordered carbon sample. | ||
We calculated the average coordination number and probability distribution for the first and second solvation shell, using the position of the first and second minimum on gth(r), i.e., 2.0 and 3.09 Å, respectively. The average coordination number, NV, for the first and second solvation shell is ∼3.5 and ∼15, respectively, as is shown in Fig. 4. Both peaks are Gaussian. However, the peak for the first solvation shell centered at ∼3.5 possess lower dispersion in comparison to the second solvation shell. Walters et al.4 reported ∼3.79 and ∼9.17 for the same sample of amorphous diamond-like carbons. Both values are in reasonable agreement with the current calculations. Overestimation and underestimation of the average coordination number for the first and second solvation shell extracted from RMC can be attributed to the poor reconstruction of gth(r) and different definitions of upper integration bound in eqn (7). Note that for diamond and graphite crystal NV = 4 and 3, respectively. The computed value of ∼3.5 is somewhere between these values. Thus, the coordination number for the first solvation shell indicates that the internal structure of the studied amorphous diamond-like carbon looks like a mixture of graphite and diamond-like clusters. It seems however obvious that such statement cannot be withdrawn from gexp(r) or gth(r). This is because there are infinite numbers of three dimensional carbon microstructures that generate similar one dimensional radial distribution functions. To get more insight into the network structure of the studied materials, we need to reconstruct and analyze the three dimensional model of the studied carbon sample, in detail.
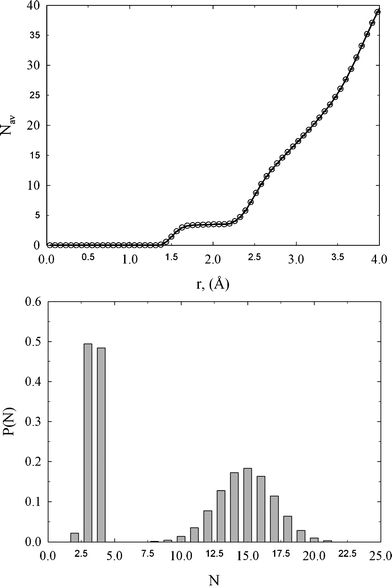 | ||
| Fig. 4 Upper panel: neighbor distribution function computed from gth(r). Lower panel: probability distributions of the number of neighbors for the first and second solvation shell computed from HRMC model configurations. | ||
The microscopic snapshots presented in Fig. 5 clearly showed that for an assumed C–C bond length ≤ 1.4 Å the carbon network is very poorly connected. The lack of any graphitic fragments in the carbon network is revealed upon visual inspection of microscopic configurations. Rather, the isolated monomers, dimers, and trimers are expected for this C–C bond length. These chain-like small carbon clusters consist of sp2 atoms that are poorly connected. As we extended the C–C bond length up to 1.5 Å, the network of carbon atoms emerge. We notice however, that the percolation cluster that spans the entire simulation box did not appear. Thus, the percolation threshold for the studied network of amorphous diamond-like carbon corresponds to a C–C bond length > 1.5 Å. It is worth pointing out that Marks et al.8 reported similar behavior of sp2 atoms in tetrahedral amorphous carbon using liquid quench molecular dynamics. As in this study, Marks et al.8 pointed out that in the structure of amorphous diamond-like carbon the sp2 atoms form small clusters of various sizes. However, to the best of our knowledge, detailed analysis of the clusters and percolation threshold has not been presented so far.
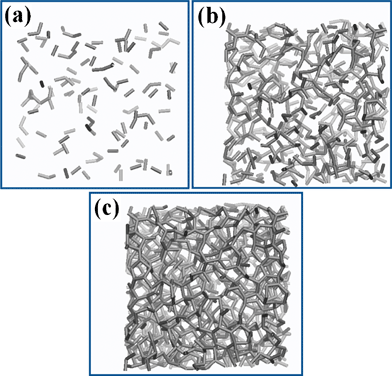 | ||
| Fig. 5 Molecular snapshots of the studied amorphous diamond-like carbon displayed for different cutoff distances of dynamic bonds:31,32 (a) −1.4 Å, (b) −1.5 Å, and (c) −1.6 Å. Note the poor connectivity of the carbon network shown in panel (a), indicating the lack of the sp2 graphitic fragments. | ||
Fig. 6 depicts bond angle distribution computed from HRMC model configurations. This distribution is correctly described by a single symmetrical peak with a maximum and standard deviation of 109.2 and 8.2°, respectively. Note that in a bulk diamond, the carbon atoms are arranged tetrahedrally with a C–C–C bond angle of 109.5°. Moreover, we clearly see that the fraction of regular hexagons with a 120° C–C–C bond angle is quite small. The significant contribution from the tetrahedral arrangement of carbon atoms indicates a great resistance to compression, good strength and durability, and hardness of the studied amorphous diamond-like carbon. A low fraction of regular hexagons with a 120° C–C–C bond angle is consistent with the poor connectivity between carbon atoms for a C–C bond length ≤ 1.4 Å, as is shown in Fig. 5.
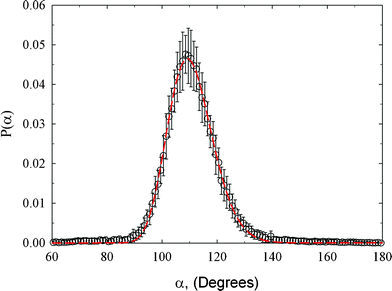 | ||
| Fig. 6 Bond angle distribution for the studied amorphous diamond-like carbon computed from HRMC model configurations. Peak maximum and standard deviation is 109.2 and 8.2°, respectively. | ||
Finally, a focus on the cluster size distribution and percolation threshold is presented in Fig. 7. As would be expected from microscopic snapshots, the cluster size distribution strongly depends on the assumed C–C bond length. Nevertheless, we notice that the fraction of isolated carbon atoms (monomers) reaches 70% for an assumed C–C bond length ≤ 1.42 Å, reflecting the lack of graphitic fragments (see Fig. 5). Note that the larger the number of isolated sp2 atoms with a typical C–C bond length ≤ 1.42 Å, the larger the electronic band gap. While this argument is qualitative, the sudden drop in electrical conductivity has been identified as the point at which the sp2 clusters link up and form a connected network.8 Further analysis of cluster size distributions revealed that for larger C–C bond length ≤ 1.5 Å the fraction of larger carbon clusters increases; however, the carbon network is still below the percolation threshold. The connectivity of carbon atoms in the studied amorphous diamond-like carbon drastically increases for a C–C bond length ≤ 1.52 Å, as is displayed in Fig. 7. Here we notice the appearance of a macroscopic cluster that spans the entire simulation box (i.e., percolation cluster), indicating a diamond-like structure of the studied carbon network (for sp3 hybridization in bulk diamond, C–C bond length is 1.54 Å).
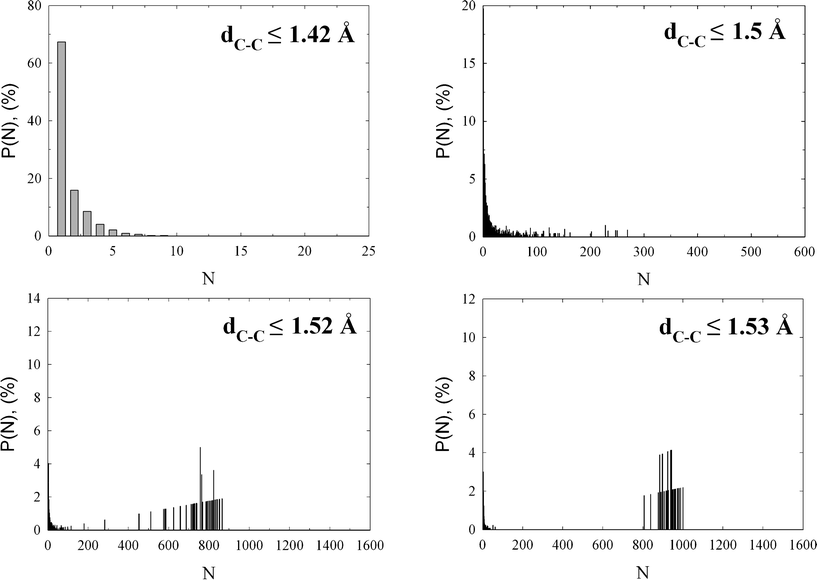 | ||
| Fig. 7 Selected cluster size distributions computed as an average over fifty independent HRMC final configurations. The assumed C–C bond length is displayed on the plots. Note the high monomer fraction for C–C bond length ≤ 1.42 Å, and the appearance of percolation cluster for C–C bond length ≤ 1.52 Å. | ||
Regardless of the density of tetrahedral amorphous carbon, the sp3 fraction extracted from any theoretical method, including the most sophisticated approaches such as Car–Parrinello molecular dynamics (CPMD), is underestimated as compared to the experimental method (see Fig. 1 in ref. 3). However, we need to bear in mind that the experimental sp3 fraction is indirectly measured from various spectroscopic methods (for example: electron-energy-loss spectroscopy or Raman spectroscopy).1,2 In contrast, in any theoretical calculations the definitions of sp3 and sp2 bonds depends on the assumed criteria. Moreover, it has been shown that the sp3 fraction can also depend on the simulation protocol.8 Thus, direct comparison between the experimental and theoretical sp3 fraction is an ill-defined problem. In the current work, we suggest the use of the cluster size distribution and percolation threshold to characterize the complex structure of the carbon network in non-crystalline diamond-like carbons. The experimental results showed that in the case of tetrahedral amorphous carbon the sp3 fraction can be as high as 80–85%.1–3 Since the percolation threshold of the studied amorphous carbon corresponds to C–C bond length ≤ 1.52 Å, we concluded that the high sp3 fraction measured experimentally is consistent with our analysis. It seems particularly interesting to correlate the percolation threshold of the carbon network with the macroscopic properties of various amorphous carbons, such as: hardness, thermal and electrical conductivity, sp3 fraction, bulk modulus, etc. Can percolation threshold (i.e., one number that can characterize the carbon network) reflect the variation in various macroscopic properties of amorphous carbons? Clearly, percolation threshold of the carbon network is attractive in its simplicity. Nevertheless, to answer this question, more fundamental research is needed.
Acknowledgements
P. K. gratefully acknowledges Prof. Ian Snook (RMIT University, Australia) and Dr George Opletal (RMIT University, Australia) for fruitful discussions on the basic HRMC algorithm. P.K. acknowledges partial support by the Office of Research & Development, Curtin University of Technology, Grant CRF10084. Piotr Gauden and Artur Terzyk acknowledge the use of the computer cluster at the Poznan Supercomputing and Networking Centre as well as the Information and Communication Technology Centre of Nicolaus Copernicus University (Torun, Poland). Piotr Kowalczyk gratefully acknowledges the use of the Epic supercomputer (iVEC, Western Australia).References
- J. Robertson, Mater. Sci. Eng., R, 2002, 37, 129–281 CrossRef.
- J. Robertson, Curr. Opin. Solid State Mater. Sci., 1996, 1, 557–561 CrossRef CAS.
- N. A. Marks, J. Phys.: Condens. Matter, 2002, 14, 2901–2927 CrossRef CAS.
- J. K. Waltersy, K. W. R. Gilkesz, J. D. Wicks and R. J. Newportk, J. Phys.: Condens. Matter, 1997, 9, L457–L463 CrossRef.
- K. W. R. Gilkes, P. H. Gaskell and J. Robertson, Phys. Rev. B: Condens. Matter, 2002, 51, 12303–12312 CrossRef.
- D. Beeman, J. Silverman, R. Lynds and M. R. Anderson, Phys. Rev. B, 1984, 30, 870–875 CrossRef CAS.
- N. A. Marks, D. R. McKenzie, B. A. Pailthorpe, M. Bernasconi and M. Parrinello, Phys. Rev. Lett., 1996, 76, 768–771 CrossRef CAS.
- N. A. Marks, D. R. McKenzie, B. A. Pailthorpe, M. Bernasconi and M. Parrinello, Phys. Rev. B: Condens. Matter, 1996, 54, 9703–9714 CrossRef CAS.
- N. A. Marks, N. C. Cooper, D. R. McKenzie, D. G. McCulloch, P. Bath and S. P. Russo, Phys. Rev. B: Condens. Matter, 2002, 65, 075411 CrossRef.
- D. G. McCulloch, D. R. McKenzie and C. M. Goringe, Phys. Rev. B: Condens. Matter, 2000, 61, 2349–2355 CrossRef CAS.
- G. Opletal, T. C. Petersen, D. G. McCulloch, I. K. Snook and I. I. Yarovsky, J. Phys.: Condens. Matter, 2005, 17, 1–12 CrossRef.
- N. A. Marks, Phys. Rev. B: Condens. Matter, 1997, 56, 2441–2446 CrossRef CAS.
- N. A. Marks, Phys. Rev. B: Condens. Matter, 2000, 63, 035401–035408 CrossRef.
- G. Opletal, T. Petersen, B. O'Malley, I. Snook, D. G. McCulloch, N. A. Marks and I. Yarovsky, Mol. Simul., 2002, 28, 927–938 CrossRef CAS.
- G. Galli, R. M. Martin, R. Car and M. Parrinello, Phys. Rev. Lett., 1989, 62, 555–558 CrossRef CAS.
- G. Galli, R. M. Martin, R. Car and M. Parrinello, Phys. Rev. B: Condens. Matter, 1990, 42, 7470–7482 CrossRef CAS.
- C. S. Yoon and J. Megusar, Interface Sci., 1995, 3, 85–100 CrossRef CAS.
- R. L. McGreevy and L. Pusztai, Mol. Simul., 1988, 1, 359–367 CrossRef.
- G. Opletal, T. C. Petersen, B. O'Malley, I. K. Snook, D. G. McCulloch and I. Yarovsky, Comput. Phys. Commun., 2008, 178, 777–787 CrossRef CAS.
- S. K. Jain, R. J.-M. Pellenq, J. P. Pikunic and K. E. Gubbins, Langmuir, 2006, 22, 9942–9948 CrossRef CAS.
- J. C. Palmer, J. K. Brennan, M. M. Hurley, A. Balboa and K. E. Gubbins, Carbon, 2009, 47, 2904–13 CrossRef CAS.
- T. Petersen, I. Yarovsky, I. Snook, D. G. McCulloch and G. Opletal, Carbon, 2003, 41, 2403–2411 CrossRef CAS.
- D. E. Warren, X-ray diffraction, Addison Wesley, New York, 1968 Search PubMed.
- D. Frenkel and B. Smit, Understanding molecular simulation from algorithms to applications, Academic Press, London, 1996 Search PubMed.
- M. P. Allen and D. J. Tildesley, Computer simulation of liquids, Clarendon, Oxford, 1987 Search PubMed.
- Zs. Papai and T. L. Pap, J. Chromatogr., A, 2002, 953, 31–38 CrossRef CAS.
- P. Kowalczyk, P. A. Gauden and A. Ciach, J. Phys. Chem. B, 2009, 113, 12988–12998 CrossRef CAS.
- P. Kowalczyk, P. A. Gauden and A. Ciach, J. Phys. Chem. B, 2011, 115, 6985–6994 CrossRef CAS.
- P. Kowalczyk, A. Ciach, P. A. Gauden and A. P. Terzyk, J. Colloid Interface Sci., 2011, 363, 579–584 CrossRef CAS.
- D. W. Brenner, Phys. Rev. B: Condens. Matter, 1990, 42, 9458–9471 CrossRef CAS.
- W. Humphrey, A. Dalke and K. Schulten, J. Mol. Graphics, 1996, 14, 33–38 CrossRef CAS.
- http://www.ks.uiuc.edu/Research/vmd/ .
| This journal is © The Royal Society of Chemistry 2012 |
