DOI:
10.1039/C2RA01004F
(Paper)
RSC Adv., 2012,
2, 4430-4443
The role of ortho, meta, para isomerism in measured solid state and derived sub-cooled liquid vapour pressures of substituted benzoic acids
Received
2nd November 2011
, Accepted 24th February 2012
First published on 3rd April 2012
Abstract
Knudsen Effusion Mass Spectrometry (KEMS) has been used to measure solid state equilibrium vapour pressures of several multifunctional aromatic compounds; phthalic, isophthalic, terephthalic, para-anisic, ortho-amino benzoic, meta-amino benzoic, para-amino benzoic, vanillic, syringic, 1,2,4-tricarboxylic benzoic, 3,5-dihydroxy-4-methyl benzoic and 4-methyl phthalic acids and nitrocatechol. Sub-cooled liquid vapour pressures were derived using Differential Scanning Calorimetry (DSC) measured thermochemical properties for the compounds measured here, as well as for other substituted benzoic acids using literature values. Unusual trends in the sub-cooled liquid vapour pressure, not represented by currently available vapour pressure estimation methods, are explained using a newly constructed Structure–Activity Relationship (SAR) with a combination of resonance and steric effects. This was then tested against further measurements of ortho-dimethyl amino benzoic and meta-dimethyl amino benzoic acids.
Introduction
Knowledge of pure component vapour pressures of organic compounds is essential for many areas of chemical and process engineering. Considerable effort has been made in measuring vapour pressure and boiling point data for vast numbers of compounds (e.g. Dortmund Databank (DDB); http://www.ddbst.com), and these data sets have been used to fit various estimation methods for boiling points18,28,37and vapour pressures.23,27,29 The available data however, is primarily for volatile hydrocarbons and mono-functional compounds. This bias can lead to significant errors for low volatility, multifunctional organics.2,7 Accurate prediction of low volatility organic vapour pressures is of major importance in atmospheric science due to its impact on the formation, growth and chemical evolution of aerosols. Oxygenate aromatic compounds (acids and phenols) have been measured in atmospheric aerosols15,19,41 and are thought to be useful tracers for anthropogenic emissions. They are produced from a variety of volatile anthropogenic precursors (benzene, toluene, xylene) and processed using multiple atmospheric reaction mechanisms that subsequently produce a wide range of possible products. Most estimation methods do not include terms for ortho, meta, para isomerism (see Fig. 1). Two methods that do, those of Nannoolal et al. and Moller et al.,23,29 have fixed second order group contributions for differentiating between the ortho, meta and para isomers which adjusts the enthalpy of vapourisation, ΔHvap, as a function of temperature (which describes the exponential increase of vapour pressure with increasing temperatures). At 298 K this leads to at most a factor of 2 difference between the vapour pressure of the isomers.
In this work Knudsen Effusion Mass Spectrometry (KEMS) combined with Differential Scanning Calorimetry (DSC) has been use to measure the solid state vapour pressure and determine the sub-cooled liquid vapour pressures of some aromatic dicarboxylic acids and other substituted benzoic acids exhibiting ortho-meta-para isomerism. Measurements have been made of multifunctional oxygenated aromatics as possible oxidation products of aromatic anthropogenic VOC pollutants15 or hydrolysis of acid anhydrides. Specifically, (ortho-) phthalic, (meta-) isophthalic, (para-) terephthalic, para-anisic, ortho-dimethyl amino benzoic, meta-dimethyl amino benzoic, ortho-amino benzoic, meta-amino benzoic, para-amino benzoic, vanillic, syringic, 1,2,4-tricarboxylic benzoic, 3,5-dihydroxy-4-methyl benzoic and 4-methyl phthalic acids and nitrocatechol have been studied in this work (see Table 1 for structures). Sub-cooled liquid vapour pressures have also been determined from literature values for a large number of substituted benzoic acid derivatives. We have compared our measurements with available literature data of related substituted benzoic acids. Throughout this paper the term ‘vapour pressure’ always refers to the pure component equilibrium vapour pressure of the compound in question, rather than its partial vapour pressure.
Theory
Sub-cooled correction
As with our previous papers, the sub-cooled vapour pressure is derived from the value measured above the solid state using the following equation:33| |  | (1) |
where p is the vapour pressure with the subscript s referring to the solid and l to the sub-cooled liquid phase, ΔHfus is the enthalpy of fusion (J mol−1), Δcp,sl denotes the best estimate of the underlying change in heat capacity between the liquid and solid state at the melting point (J mol−1 K−1), T is the temperature (K) and Tm is the melting point (K), which is commonly used instead of the triple point, Tt; Tm is typically within 1 K of Tt for small organic acids. The sub-cooled liquid vapour pressure also allows easier comparison with theoretical vapour pressure estimation methods, which predict the sub-cooled state.4
Vapour pressure estimates
Many predictive methods exist for pure component vapour pressures.2 Here we compare our experimental results with the methods used by Booth4,5 which use an estimated normal boiling point combined with a temperature dependence (vapour pressure curve) to estimate the vapour pressure at the desired temperature (298 K). The three vapour pressure methods used are; 1) the Nannoolal et al. vapour pressure curve29 with Tb by Nannoolal et al.28, 2) the Moller et al. vapour pressure curve23 with Tb from Nannoolal et al.28 3) the Myrdal and Yalkowsky method27 with Tb by Stein and Brown.37 For a more through explanation the reader is referred to Barley and McFiggans.2
Experimental
Samples of phthalic (>99.5%), isophthalic (>99%), terephthalic (>98%), para-anisic (>99%), vanillic (>97%), syringic (>95%), 1,2,4-tricarboxylic benzoic (>98%), 3,5-dihydroxy-4-methyl benzoic (>97%) and 4-methyl phthalic (>99%) acids and nitrocatechol (>99%) were purchased from Sigma-Aldrich and used with no further preparation. Additional measurements were subsequently made of ortho-dimethyl amino benzoic (>99%) and meta-dimethyl amino benzoic (>98%) acid.
The KEMS system is identical to that used in previous studies3–5 and an overview of the measurement procedure is repeated here: To calibrate, a sample of known vapour pressure is placed in the temperature controlled Knudsen cell (in this case malonic acid, using vapour pressure values of ln P (Pa) = 29.54 − 11058.97/T (K)).3 The cell has a chamfered effusing orifice with a size ≤1/10 the mean free path of the gas molecules in the cell. This ensures the orifice does not significantly disturb the thermodynamic equilibrium of the samples in the cell.16 The resulting molecular beam is ionised by 70 eV electron impact, then sampled by the mass spectrometer. After correcting for the ionization cross section of the calibration compound, this produces a signal proportional to the vapour pressure.
After this calibration a sample of unknown vapour pressure can be measured. During sample change, the first chamber with the Knudsen cell is isolated via the gate valve and vented to air allowing the ioniser filament and secondary electron multiplier to be left on. The unknown vapour pressures can be determined from the intensity of the mass spectrometer signal of the compound in question. If the Knudsen number, the ratio of the mean free path of molecules to the size of the effusion orifice, is high enough, then effusing gas does not significantly disturb the equilibrium in the cell.3,16 Thus making the steady state vapour pressure, as measured by the KEMS, as close as possible to the equilibrium vapour pressure.
Once the vapour pressure, P, has been determined at a number of different temperatures further thermodynamic data is obtained using the Clausius–Clapeyron equation;16
| |  | (2) |
where
T is the temperature,
R is the ideal gas constant and Δ
Hsub and Δ
Ssub are the enthalpies and entropies of
sublimation respectively.
P was obtained over a range of 20 K in this work, starting at 298 K. The reported solid state
P298 vapour pressures are calculated from the linear fit of ln
P vs. 1/
T used in the Clausius–Clapeyron equation.
Differential scanning calorimetry
As with previous studies,4,5 melting points (Tm) and enthalpies of fusion (ΔHfus) were measured using a TA instruments Q200 Differential Scanning Calorimeter (DSC). The procedure is repeated here: heat flow and temperature were calibrated using an indium reference, and heat capacity using sapphire reference. A heating rate of 10 °C min−1 was used. 5–10 mg of sample was measured using a microbalance, then pressed into a hermetically sealed aluminium DSC pan. A purge gas of N2 was used with a flow rate of 30 ml min−1. The reference was an empty sealed pan of the same type. Data processing was performed using the `Universal Analysis' software supplied with the instrument. Δcp,sl was estimated using Δcp,sl = ΔSfus.14,21
Results
Solid state vapour pressures were determined using KEMS and sub-cooled liquid vapour pressures from the DSC results. Comparisons are then made with appropriate literature data.
Solid and sub-cooled liquid vapour pressures
Sub-cooled liquid vapour pressures were determined using eqn (1), the solid state vapour pressure values in Table 1 & 2 and the thermochemical data in Table 3 & 5, see Fig. 2. From Booth et al.,3 the errors on the P298 solid are ±15%, while ref. 4 discusses the errors in P298 liquid that arise from differing values of P298 solid, Tm, ΔHfus and ΔSfus. Based on extremes of literature values for Tm, ΔHfus and Δcp,sl for several compounds, the final maximum error was estimated at ±75%. Here we are able to compare our P298 liquid (4.76 × 10⁻³ Pa) for para-anisic acid with one derived from literature values (3.53 × 10⁻³ Pa). The literature value is within 26%, which suggests the errors estimated in ref. 4 are somewhat on the high side. We have therefore adopted a lower value of ±50% for the sub-cooled liquid vapour pressure error, and considering the accuracy of DSC derived thermochemical parameters, this is still probably an over estimate.
Table 1 Structure, solid state vapour pressure P298 (Pa), enthalpy ΔHsub (kJ mol−1) and entropy ΔSsub (J mol−1 K−1) of sublimation for the compounds measured in this work
| Structure |
Name |
P
298 solid (Pa) |
ΔHsub (kJ mol−1) |
ΔSsub (J mol−1 K−1) |
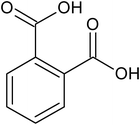
|
ortho-phthalic acid |
1.77 ± 0.27 × 10⁻⁵ |
78.9 |
173.7 |
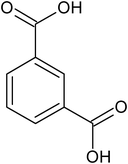
|
meta-isophthalic acid |
1.27 ± 0.19 × 10⁻⁴ |
69.8 |
159.7 |

|
para-terephthalic acid |
3.12 ± 0.47 × 10⁻⁴ |
78.8 |
197.3 |

|
para-anisic acid |
4.86 ± 0.73 × 10⁻⁴ |
99.1 |
269.2 |
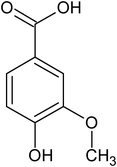
|
vanillic acid |
6.50 ± 0.98 × 10⁻⁵ |
96.7 |
244.3 |
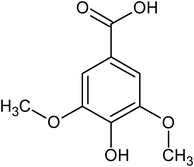
|
syringic acid |
3.37 ± 0.50 × 10⁻⁵ |
58.0 |
109.1 |
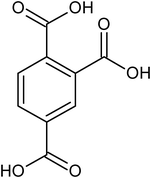
|
1,2,4-benzene tricarboxylic acid |
<1 × 10⁻⁶ |
— |
— |
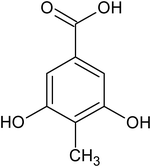
|
3,5-dihydroxy-4-methyl benzoic acid |
<1 × 10⁻⁶ |
— |
— |
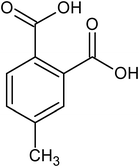
|
4-methyl phthalic acid |
<1 × 10⁻⁶ |
— |
— |
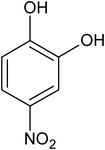
|
nitrocatechol |
4.13 ± 0.62 × 10⁻⁵ |
68.1 |
144.6 |
|
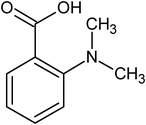
ortho-dimethyl amino benzoic acid |
5.41 ± 0.81 × 10⁻³ |
141.9 |
432.7 |
|
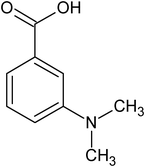
meta-dimethyl amino benzoic acid |
7.30 ± 1.10 × 10⁻⁵ |
109.7 |
289.0 |
Table 2 Literature solid state vapour pressures P298 (Pa) of other substituted benzoic acids
| Substituent group |
ortho
|
meta
|
para
|
Reference |
| F |
6.05 × 10⁻² |
9.44 × 10⁻² |
|
24
|
| OH |
1.77 × 10⁻² |
1.36 × 10⁻⁴ |
2.29 × 10⁻⁵ |
31
|
| CH3 |
5.40 × 10⁻² |
3.12 × 10⁻² |
7.80 × 10⁻³ |
12
|
| CH2CH3 |
6.41 × 10⁻² |
4.08 × 10⁻² |
1.31 × 10⁻² |
8
|
| CH2CH2CH3 |
4.53 × 10⁻² |
2.08 × 10⁻² |
|
13
|
| CH2 CH2CH2CH3 |
2.62 × 10⁻² |
4.10 × 10⁻³ |
1.84 × 10⁻³ |
10
|
| Cl |
5.32 × 10⁻³ |
6.29 × 10⁻³ |
9.93 × 10⁻⁴ |
36
|
| NH2 |
5.41 × 10⁻³ |
1.21 × 10⁻⁴ |
2.55 × 10⁻⁴ |
20
|
| Br |
1.88 × 10⁻³ |
2.48 × 10⁻³ |
2.76 × 10⁻⁴ |
36
|
| OCH3 |
4.18 × 10⁻³ |
3.94 × 10⁻³ |
3.99 × 10⁻⁴ |
Colomina et al., (1978)9 |
| NO2 |
1.60 × 10⁻⁴ |
4.74 × 10⁻⁴ |
3.61 × 10⁻⁵ |
35
|
| I |
4.41 × 10⁻⁴ |
3.41 × 10⁻⁴ |
6.45 × 10⁻⁵ |
24
|
| OCOCH3 |
|
|
9.50 × 10⁻⁵ |
Monte et al., (2010)26 |
| N(CH3)2 |
|
|
1.10 × 10⁻⁵ |
Monte et al., (2010)26 |
| NHCH3 |
|
|
2.00 × 10⁻⁵ |
Monte et al., (2010)26 |
| CN |
|
|
1.30 × 10⁻⁴ |
Monte et al., (2010)26 |
| H (Benzoic) |
1.11 × 10⁻¹ |
1.11 × 10⁻¹ |
1.11 × 10⁻¹ |
11
|
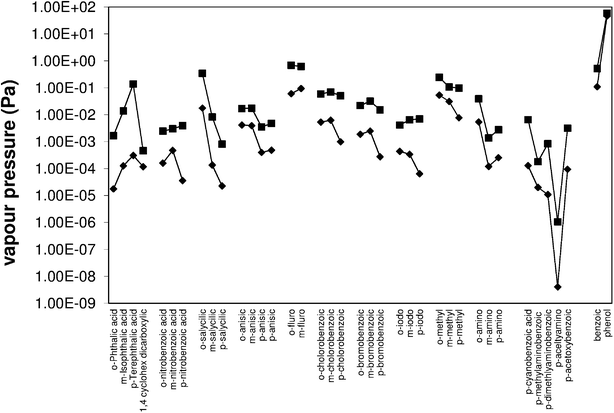 |
| | Fig. 2 Solid state (![[double bond, length as m-dash]](https://www.rsc.org/images/entities/char_e001.gif) ) and sub-cooled liquid (■) vapour pressures of substituted benzoic acids from this work and the literature. ) and sub-cooled liquid (■) vapour pressures of substituted benzoic acids from this work and the literature. | |
Table 3 Sub-cooled liquid vapour pressure P298 (Pa), melting point Tm (K), enthalpy ΔHfus (kJ mol−1) and entropy ΔSfus (J mol−1 K−1) of fusion
| Name |
P
298 liquid (Pa) |
T
m (K) |
ΔHfus (kJ mol−1) |
ΔSfus (J mol−1 K−1) |
|
These values were obtained from ref. 17 as the Tm was higher than the range measurable in our DSC. The ratio of sub-cooled liquid to solid state vapour pressure is included in brackets to aid comparison.
|
|
ortho-phthalic acid |
1.68 ± 0.84 × 10⁻³ (95) |
479.9 |
38.1 |
79.5 |
|
meta-isophthalic acid |
1.40 ± 0.70 × 10⁻² (110) |
618.4 |
33.1 |
53.5 |
|
para-terephthalic acida |
1.38 ± 0.70 × 10⁻¹ (443) |
702.2 |
41.5 |
59.1 |
|
para-anisic acid |
4.76 ± 2.40 × 10⁻³ (10) |
456.9 |
20.3 |
44.4 |
| vanillic acid |
1.42 ± 0.71 × 10⁻³ (22) |
484.7 |
25.6 |
52.7 |
| syringic acid |
9.80 ± 4.90 × 10⁻⁴ (29) |
482.5 |
28.1 |
58.1 |
| 1,2,4 benzene tricarboxylic acid |
<5 × 10⁻⁵ |
499.6 |
30.8 |
61.7 |
| 3,5 dihydroxy 4 methyl benzoic acid |
<3 × 10⁻⁴ |
544.1 |
42.5 |
78.1 |
| 4 methyl phthalic acid |
<7 × 10⁻⁶ |
425.9 |
20.3 |
61.7 |
| nitrocatechol |
9.99 ± 4.99 × 10⁻⁴ (24) |
450.2 |
28.9 |
64.2 |
|
ortho-dimethyl amino benzoic acid |
1.07 ± 0.53 × 10⁻² (2) |
341.9 |
14.1 |
41.3 |
|
meta-dimethyl amino benzoic acid |
6.42 ± 3.21 × 10⁻⁴ (9) |
423.3 |
21.8 |
51.5 |
Table 4 Sub-cooled liquid vapour pressure P298 (Pa) calculated from literature values in Table 2 and 5. The ratio of sub-cooled liquid to solid state vapour pressure is included in brackets for comparison
| Substituent group |
ortho
|
meta
|
para
|
T
m & ΔHfus reference |
| F |
6.90 × 10⁻¹ (11) |
6.24 × 10⁻¹ (7) |
|
|
| OH |
3.45 × 10⁻¹ (19) |
8.28 × 10⁻³ (61) |
8.11 × 10⁻⁴ (35) |
31
|
| CH3 |
2.45 × 10⁻¹ (5) |
1.07 × 10⁻¹ (3) |
9.75 × 10⁻² (13) |
1
|
| CH2H5 |
|
|
3.65 × 10⁻² (3) |
25
|
| Cl |
5.94 × 10⁻² (11) |
6.99 × 10⁻² (11) |
5.08 × 10⁻² (51) |
36
|
| NH2 |
3.93 × 10⁻² (7) |
1.37 × 10⁻³ (11) |
2.77 × 10⁻³ (11) |
1
|
| Br |
2.20 × 10⁻² (12) |
3.20 × 10⁻² (13) |
1.53 × 10⁻² (55) |
36
|
| OCH3 |
1.70 × 10⁻² (4) |
1.75 × 10⁻² (4) |
3.59 × 10⁻³ (10) |
32
|
| NO2 |
2.47 × 10⁻³ (15) |
3.02 × 10⁻³ (6) |
3.95 × 10⁻³ (110) |
1
|
| I |
4.13 × 10⁻³ (9) |
8.91 × 10⁻³ (19) |
7.02 × 10⁻³ (109) |
39
|
| OCOCH3 |
|
|
3.18 × 10⁻³ (33) |
Monte et al., (2009) |
| N(CH3)2 |
|
|
8.45 × 10⁻⁴ (77) |
Monte et al., (2009) |
| NHCH3 |
|
|
1.81 × 10⁻⁴ (9) |
Monte et al., (2009) |
| H (Benzoic) |
5.21 × 10⁻¹ (5) |
5.21 × 10⁻¹ (5) |
5.21 × 10⁻¹ (5) |
1
|
Table 5 The literature values for melting point Tm (K), enthalpy ΔHfus (kJ mol−1) and entropy ΔSfus (J mol−1 K−1) of fusion used in calculating sub-cooled liquid vapour pressures
| Substituent group |
ortho
|
meta
|
para
|
Reference |
|
Data are not available, values estimated from literature trends from other halo-benzoic acids.
|
| |
T
m (K) |
ΔHfus (kJ mol−1) |
ΔSfus (J mol−1 K−1) |
T
m (K) |
ΔHfus (kJ mol−1) |
ΔSfus (J mol−1 K−1) |
T
m (K) |
ΔHfus (kJ mol−1) |
ΔSfus (J mol−1 K−1) |
|
| F |
410.0a |
26.0a |
63.4a |
395.0 |
22.0a |
55.7a |
|
|
|
|
| OH |
431.2 |
28.8 |
66.8 |
473.5 |
34.9 |
73.7 |
488.7 |
29.3 |
60.0 |
31
|
| CH3 |
376.9 |
20.2 |
53.5 |
381.9 |
15.7 |
41.2 |
452.8 |
22.7 |
50.2 |
1
|
| Cl |
414.0 |
25.3 |
61.0 |
427.9 |
23.7 |
55.3 |
512.5 |
30.9 |
60.3 |
25
|
| NH2 |
417.8 |
20.4 |
48.8 |
452.9 |
21.8 |
48.2 |
461.4 |
20.9 |
45.3 |
36
|
| Br |
421.6 |
24.8 |
58.9 |
430.1 |
24.9 |
57.9 |
526.3 |
30.9 |
58.7 |
1
|
| OCH3 |
374.6 |
19.1 |
51.0 |
378.7 |
19.6 |
51.8 |
455.4 |
19.6 |
43.0 |
36
|
| NO2 |
419.0 |
28.0 |
66.8 |
414.3 |
19.3 |
46.7 |
512.4 |
36.9 |
72.0 |
32
|
| I |
435.0 |
21.4 |
49.1 |
460.3 |
28.7 |
62.4 |
543.7 |
35.2 |
64.8 |
1
|
| C2H5 |
|
|
|
|
|
|
385.2 |
12.79 |
33.2 |
39
|
| OCOCH3 |
|
|
|
|
|
|
464.8 |
30.5 |
65.6 |
Monte et al., (2009) |
| N(CH3)2 |
|
|
|
|
|
|
512.5 |
34.1 |
66.5 |
Monte et al., (2009) |
| NHCH3 |
|
|
|
|
|
|
435.9 |
21.0 |
48.2 |
Monte et al., (2009) |
| H (Benzoic) |
395.5 |
18.0 |
45.5 |
|
|
|
|
|
|
1
|
There are several different methods used for low volatility vapour pressure measurements for aerosol science such as HTDMA, thermal desorption, single particle measurements and effusion measurements. While there is disagreement between the different techniques, measurements made using similar methods (e.g. all single particle, or bulk samples only) tend to agree with each other. So comparing measurements using bulk effusion techniques is valid for determining trends in related compounds. Colomina9 has previously measured the vapour pressure of the methoxybenzoic (anisic) acids using Knudsen mass loss over the temperature range 335–355 K. For intercomparison purposes we have measured para anisic acids. Our P298 solid of 4.86 × 10⁻⁴ Pa compares well with 3.99 × 10⁻⁴ Pa from ref. 9. In previous papers our KEMS measurements compare well with Knudsen mass loss data for diacids (comparing ref. 3 with 34) and Levoglucosan (comparing ref. 5 with 30). In general KEMS results are comparable to those from other bulk vapour pressure measurements allowing trends in the different substituted benzoic acids to be readily compared.
Benzoic diacids.
The benzene dicarboxylic acids (Fig. 3, Table 1) show a trend of increasing solid state pressure going from ortho to meta to para (1.77 × 10⁻⁵, 1.27 × 10⁻⁴ and 3.12 × 10⁻⁴ Pa, respectively). This is an unusual trend when compared to the other substituted benzoic acids. For example, methyl, ethyl, butyl, hydroxyl, and iodo substituted benzoic acids (Table 2) all show a decreasing vapour pressure moving from ortho to meta to para. There are also several examples of compounds (nitro, fluoro, chloro and bromo) where meta substitutions gives the highest solid state vapour pressure, suggesting that there are no simple trends explaining all the substituted benzoic acid P298 values.
The phthalic acids have quite large sub-cooled corrections due to their high Tm, (para) terephthalic acid with a Tm of 702 K has a sub-cooled liquid vapour pressure ∼450 times greater than the solid state. The solid state and sub-cooled liquid vapour pressure diverge at the melting point, so in general a higher melting point leads to a higher correction between the two states. This means the trend of increasing vapour pressure going from ortho to meta to para is exacerbated by the matching trend of increasing Tm.
Substituted benzoic acids.
All the substitutions shown have the para isomer giving the highest Tm and all but nitro substitutions have Tm increasing from ortho to meta to para. The sub-cooled liquid vapour pressures generally follow the trends of the solid state vapour pressure with only a few exceptions. The larger sub-cooled liquid correction for para substitutions means that some additions (bromo and chloro) have very similar vapour pressures for ortho and para. For example solid para-chlorobenzoic acid is 5 times less volatile than ortho, but the sub-cooled liquid vapour pressures are within 14% of each other. Other substitutions such as iodo and nitro show an increasing vapour pressure from ortho to meta to para, as is observed with the phthalic acids.
Comparison to aliphatic diacids.
The vapour pressure of the analogous cyclic aliphatic diacid, 1,3-cyclohexane dicarboxylic (Fig. 4), is almost identical to isophthalic, 1.27 × 10⁻⁴vs. 1.18 × 10⁻⁴ Pa.5 This is to be expected due to their similar functionality and molecular shape. The straight chain suberic acid, due to a relatively stable crystal structure, has a vapour pressure two orders of magnitude lower (1.20 × 10⁻⁶ Pa). Isophthalic acid has a sub-cooled liquid vapour pressure two orders of magnitude greater than 1,3-cyclohexane dicarboxylic acid (4.65 × 10⁻⁴ Pa) and three orders of magnitude higher than suberic acid (6.41 × 10⁻⁵ Pa).5
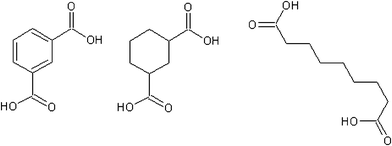 |
| | Fig. 4 Isophthalic, 1,3-cyclohexane dicarboxylic and suberic acid. | |
Polyfunctional substituted benzoic acids.
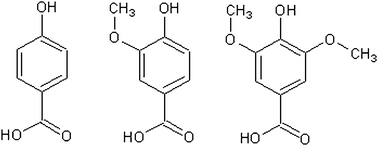
Vanillic and syringic acid can be considered as additional substitutions on 4-hydroxbenzoic acid (Fig. 5). Relative to 4-hydroxy benzoic acid, the vapour pressures of the methyl ether substitutes are higher; vanillic is approximately 3 times more volatile and syringic 1.5 times. Chattopadhyay and Zieman6 and Booth et al.4 have both observed raised vapour pressures for some compounds with both carboxylic and hydroxyl groups, thought to be as a result of intramolecular bonding from adjacent groups. This is unlikely to be the case here however, as ether groups are known not to form hydrogen bonds. Looking at it in terms of adding a para hydroxyl group to a meta anisic acid molecule, the vapour pressure is substantially lowered moving from meta anisic acid to vanillic acid, 3.94 × 10⁻⁴ Pa to 6.49 × 10⁻⁵ Pa due to the addition of the extra group. Possible reasons include a less stable crystal structure caused by the additional groups, or some form of resonance effect changing the dipole forces. 1,2,4-benzene tricarboxylic, 3,5-dihydroxy-4-methyl benzoic, and 4-methyl phthalic acid had vapour pressures below our detectable limits, even at 323 K. Based on previous measurements we therefore estimate their solid state vapour pressure to be less than 1 × 10⁻⁶ Pa.
For 1,2,4-benzene tricarboxylic, 3,5-dihydroxy-4-methyl benzoic, and 4-methyl phthalic acid we have estimated a maximum sub-cooled liquid vapour pressure using the DSC values and our maximum estimate for the solid state vapour pressure. As expected they are the lowest values we have, except for 3,5-dihydroxy-4-methyl benzoic acid which, due to a high Tm, could have a sub-cooled vapour pressure comparable to some of the compounds we are able to measure. As with the solid state vapour pressure, the additional ether groups of the vanillic and syringic acids raise, rather than lower, the vapour pressure in the sub-cooled liquid state when compared to para hydroxybenzoic acid. From 8.11 × 10⁻⁴ Pa to 1.42 × 10⁻³ Pa and 9.80 × 10⁻⁴ Pa for 1 extra and 2 extra ether groups, respectively. As stated earlier, the fact that ether groups do not hydrogen bond suggests that other factors are causing the rise in vapour pressure.
Nitrocatechol.
The additional para nitro group in 4-nitrocatechol lowers the vapour pressure by 4 orders of magnitude compared to the unsubstituted catechol (2.87 × 10⁻¹ Pa).40 This is comparable to the decrease in para nitro benzoic acid where the additional nitro group lowers the vapour pressure of benzoic acid by 4 orders of magnitude.
Enthalpy of vapourisation
The enthalpy of vapourisation, ΔHvap, describes how the sub-cooled liquid vapour pressure increases exponentially with temperature (cf.eqn (2)) and is given by ΔHvap = ΔHsub − ΔHfus. Table 6 shows all the ΔHvap from both the measurements and the literature values. The phthalic acids have a very low spread in ΔHvap values, less than 4 kJ mol−1 between the isomers, so the large difference in the sub-cooled vapour pressures between the isomers (2 orders of magnitude) should exist over a large temperature range, not just at 298 K. The largest difference is between the dimethyl-amino benzoic acids, 37 kJ mol−1. Like the sub-cooled liquid vapour pressures, there are no easily distinguishable patterns.
Table 6 Enthalpies of vapourisation for the both the measured and literature values
| Substituent group |
ortho ΔHvap (kJ mol−1) |
meta ΔHvap (kJ mol−1) |
para ΔHvap (kJ mol−1) |
References |
| COOH |
40.7 ± 8.5 |
36.7 ± 7.7 |
37.3 ± 7.8 |
This work |
| F |
68.4 |
71.6 |
|
Estimated from 1 and 22 |
| OH |
67.8 |
70.3 |
84.0 |
31
|
| CH3 |
75.7 |
81.3 |
76.1 |
1
|
| Cl |
79.8 |
77.5 |
72.4 |
25
|
| NH2 |
80.2 |
101.1 |
93.4 |
36
|
| Br |
82.0 |
79.3 |
76.5 |
1
|
| OCH3 |
85.6 |
87.9 |
90.2 |
36
|
| NO2 |
90.7 |
90.7 |
82.3 |
32
|
| I |
91.4 |
85.1 |
77.7 |
1
|
| OCOCH3 |
|
|
83.4 |
39
|
| N(CH3)2 |
120.2 ± 25.2 |
95.0 ± 19.9 |
83.3 |
This work (meta and para) Monte et al., (2009) |
| NHCH3 |
|
|
100.6 |
Monte et al., (2009) |
Whilst ΔHsub is constant over small ranges of temperature (e.g. the 20 K range used here) it does vary with temperature. This can become significant when comparing results with higher temperatures and extrapolating vapour pressures down to room temperature. This is one of the primary reasons for taking up the challenge of measuring low volatility vapour pressures around room temperature. Here however, the errors associated with measuring ΔHsub and hence ΔHvap will dwarf any change in correcting ΔH values to 298 K.
Uncertainties in the enthalpy of vapourisation arise from errors in the vapour pressure (and temperature) measurement to obtain the enthalpy of sublimation, and errors in the enthalpy of fusion. Based on experience from our previous work,3–5 we conservatively estimate the error on ΔHsub to be ±15% and ΔHfus to be ±15%, to give a total error for ΔHvap of ±21%. Comparing our results for para-anisic acid with ref. 9 we measure a value of 99.1 kJ mol−1 for ΔHsub compared with 109.8 kJ mol−1, a difference of 10%.
Estimation methods
The experimental data clearly shows significant differences between the isomers for the compounds measured here and those in the literature. Not accounting for, or underestimating the impact of, the ortho, meta and para effects will lead to serious errors in the estimated vapour pressures. The estimation methods assessed in this study first require the calculation of a normal boiling point (Table 7), which is then combined with a vapour pressure curve to extrapolate down to the temperature of interest. The Stein and Brown boiling points37 have no terms to account for the different aromatic isomers. The Nannoolal et al. normal boiling points28 have a second-order group correction for ortho, meta and para, which typically leads to a difference between the isomers of approximately 3 K. The Myrdal and Yalkowsky vapour pressure method27 does not include any terms for ortho, meta, or para. When combined with the Stein and Brown boiling points,37 it cannot show any sensitivity to isomerism. The Moller et al.23 and Nannoolal et al.29 methods both have a similar secondary group correction to the Nannoolal et al. boiling point method.28
Table 7 Estimated boiling points Tb (K) using the Nannoolal et al.28 and Stein and Brown37 methods
| Name |
Nannoolal Tb (K) |
Stein and Brown Tb (K) |
|
ortho-phthalic |
642.3 |
642.5 |
|
meta-isophthalic |
645.8 |
624.5 |
|
para-terephthalic |
648.7 |
624.5 |
| 1,3-cyclohexane diacid |
609.5 |
611.6 |
|
para-anisic |
581.9 |
556.5 |
| nitrocatechol |
563.4 |
581.3 |
| vanillic |
602.9 |
599.5 |
| syringic |
642.7 |
624.3 |
|
ortho-dimethyl amino benzoic |
572.3 |
570.8 |
|
meta-dimethyl amino benzoic |
575.8 |
570.8 |
The Moller et al. method23 (Table 8) is particularly poor for replicating the vapour pressure of the phthalic acids, with a P298 liquid 4 orders of magnitude too low for ortho, rising to 6 orders of magnitude too low for para-terephthalic acid. Slightly better results are found when comparing with the Nannoolal et al. method.29 The Moller and Nannoolal methods compare better with measurements of anisic acid, typically within experimental error for the Moller method and a factor of 3 for the Nannoolal method. The latter gives good results for vanillic acid, within error of the experimental value, but performs poorly with syringic acid, underestimating by a factor of 30. Poor results with multiple functional groups are exacerbated by poorly constrained group interaction parameters, which has been seen for carboxylic & hydroxyl4 and ether & hydroxyl groups.4 These methods also either underestimate the influence of ortho, meta and para substituents, which can change the vapour pressure by an order of magnitude or more, or they ignore them all together. This increases the final error on the vapour pressure with respect to the experimental value. As the compounds here tend to decompose before their normal boiling point (as with most low-volatility organics), it is not possible to directly compare the errors in Tb estimates.
Table 8 Estimated sub-cooled liquid vapour pressures P298 (Pa) using the Moller/Nannoolal, Nannoolal/Nannoolal and Myrdal and Yalkowsky/Stein and Brown methods. The ratio of estimated to measured sub-cooled liquid vapour pressure in brackets
| Name |
Moller23/Nannoolal28P298 liquid (Pa) |
Nannoolal29/Nannoolal28P298 liquid (Pa) |
Myrdal and Yalkowsky27/Stein and Brown37P298 liquid (Pa) |
KEMS P298 liquid (Pa) |
|
ortho-phthalic |
4.95 × 10⁻⁷ (2.9 × 10⁻⁴) |
6.17 × 10⁻⁵ (3.7 × 10⁻²) |
4.76 × 10⁻³ (2.8) |
1.68 × 10⁻³ |
|
meta-isophthalic |
3.26 × 10⁻⁷ (2.3 × 10⁻⁵) |
3.99 × 10⁻⁵ (2.9 × 10⁻³) |
4.76 × 10⁻³ (3.4 × 10⁻¹) |
1.40 × 10⁻² |
|
para-terephthal |
2.37 × 10⁻⁷ (1.7 × 10⁻⁶) |
3.18 × 10⁻⁵ (2.3 × 10⁻⁴) |
4.76 × 10⁻³ (3.4 × 10⁻²) |
1.38 × 10⁻¹ |
| 1,3 cyclohexane diacid |
1.73 × 10⁻⁴ (3.7 × 10⁻¹) |
7.53 × 10⁻⁴ (1.6) |
1.07 × 10⁻² (23) |
4.65 × 10⁻⁴ |
|
para-anisic |
3.56 × 10⁻³ (7.5 × 10⁻¹) |
1.49 × 10⁻² (3.1) |
3.11 × 10⁻¹ (65) |
4.76 × 10⁻³ |
| nitrocatechol |
3.85 × 10⁻² (39) |
7.54 × 10⁻² (75) |
5.71 × 10⁻² (57) |
9.99 × 10⁻⁴ |
| vanillic |
3.78 × 10⁻⁴ (2.7 × 10⁻¹) |
1.10 × 10⁻³ (7.8 × 10⁻¹) |
1.98 × 10⁻² (14) |
1.42 × 10⁻³ |
| syringic |
1.22 × 10⁻⁵ (1.2 × 10⁻²) |
3.03 × 10⁻⁵ (3.1 × 10⁻²) |
5.07 × 10⁻³ (5.2) |
9.80 × 10⁻⁴ |
|
ortho-dimethyl amino benzoic |
7.08 × 10⁻³ (6.6 × 10⁻¹) |
2.95 × 10⁻² (2.8) |
1.51 × 10⁻¹ (14) |
1.07 × 10⁻² |
|
meta-dimethyl amino benzoic |
5.37 × 10⁻³ (8.4) |
2.10 × 10⁻² (33) |
1.51 × 10⁻¹ (240) |
6.42 × 10⁻⁴ |
Enthalpies of vapourisation
Overall trends in the predicted vapour pressures are affected by the enthalpies of vapourisation (Table 9). The Moller method23 predicts consistently higher ΔHvap values, compared to the Nannoolal29 that predicts higher values than the Myrdal and Yalkowsky method,27 the inverse of the trends in vapour pressures. Some compounds, particularly the phthalic acids, have experimental vapour pressures much lower than predicted values, in this case due to the very high ΔHfus values for the various phthalic acids. This is reflected in the poor estimates for the vapour pressure for the phthalics using the Nannoolal and Moller methods that give estimates that are at best 2 orders of magnitude different from the measurements, and at worst 6. The Myrdal and Yalkowsky method does get fairly close to the measured value for ortho-phthalic acid, which suggests cancelling errors with the incorrect ΔHvap and a Tb value of 624.3 K from the Stein and Brown method.37Para-anisic acid has both vapour pressures and ΔHvap close to the values measured with the KEMS so we would expect the boiling point to be very close to the value of 581.9 K predicted by the Nannoolal Tb estimate. Both nitrocatechol and syringic acid have very low ΔHvap values which come from a combination of lower ΔHsub and higher ΔHfus than most of the compounds we measured. Only ortho-dimethylamino benzoic acid had a higher experimental ΔHvap (120 kJ mol−1) than was predicted with all 3 methods.
Table 9 Estimated enthalpies of vapourisation using the Moller/Nannoolal, Nannoolal/Nannoolal and Myrdal and Yalkowsky/Stein and Brown methods
| Name |
Moller23/Nannoolal28 ΔHvap (kJ mol−1) |
Nannoolal29/Nannoolal28 ΔHvap (kJ mol−1) |
Myrdal and Yalkowsky27/Stein and Brown37 ΔHvap (kJ mol−1) |
KEMS ΔHvap (kJ mol−1) |
|
ortho-phthalic |
158 |
118 |
92 |
41 |
|
meta-isophthalic |
160 |
120 |
92 |
37 |
|
para-terephthal |
162 |
121 |
92 |
37 |
| 1,3-cyclohexane diacid |
122 |
107 |
89 |
54 |
|
para-anisic |
106 |
93 |
77 |
90 |
| nitrocatechol |
93 |
85 |
83 |
39 |
| vanillic |
119 |
105 |
87 |
71 |
| syringic |
145 |
122 |
92 |
29 |
|
ortho-dimethyl amino benzoic |
103 |
90 |
80 |
120 |
|
meta-dimethyl amino benzoic |
104 |
91 |
80 |
95 |
Discussions
Structure–activity relation
Clearly, the three estimation methods in the literature fail to accurately capture the magnitude of the ortho-meta-para effect on sub-cooled liquid vapour pressures. We have attempted to try and understand the role of ortho-meta-para isomerism by constructing a new structure–activity relationship (SAR) to describe the sub-cooled liquid vapour pressure in terms of other properties of the molecules or the substituent groups. Initially it was suspected that inductive effects between the extra group and the benzene ring would dominate the vapour pressure. As a proxy for this (with a wide range of data available) the bond dissociation energy of the substituent added to a benzene ring was used to try and discover a relationship which seemed reasonable based on the successes that SARs, constructed using linear free energy relationships, have enjoyed in the past. Fig. 6 shows a plot of log10 sub-cooled liquid vapour pressure (Pa) vs. bond dissociation energy (kJ mol−1 for the ortho compounds listed in Table 3 & 4. Fig. 7 does the same for the meta and para substitutions, excluding the dimethylamino benzoic acids, which were measured subsequently to test the SAR. The correlation for a natural log fit for all groups except carboxylic acid and electron donating groups (ERG) is good, with R2 values of 0.939, 0.9282 and 0.9018 for ortho, meta and para respectively, corresponding to average absolute percentage deviations of 124, 122 and 125% from the experimental values respectively. The relationship is given by;| |  | (3) |
where ΔHbond is the bond dissociation energy of the substituent group with respect to benzene and a and b are fitting parameters. Unfortunately, the simple relationship fails to deal with two problems; electron donating groups, such as amino substitutions, which becomes more significant as the groups move from ortho to meta to para, and large functional groups, such as COOH, which have a greater effect in the ortho position. When these groups (amine, hydroxy, ether) and carboxylic acid are added the R2 decreases to 0.5682, 0.3109 and −0.0258 respectively. In order to account for the electron donating groups another term was added, based on the resonance effect for the molecule in question. The resonance term used comes from the Hammett and Taft constants for the substituted groups;| | | σresonance = σhammett − σinductive | (4) |
where σinductive = 0.45σ* (Taft constant). Values for the Hammett constants and inductive effect are found in Table 10. In previous work we have shown that the steric effect can be an important term a free energy relationship (McGillen et al., 2011).22 Therefore, an additional steric term was added to account for the size of the substituent group. This is especially important for the ortho position and the large COOH groups of the phthalic and dimethyl amino benzoic acids. Together, this modifies eqn (3) to give;| |  | (5) |
where x and y adjust the sensitivity to the steric and resonance effects for each isomer and a and b are fitting parameters. The steric effect is the molecular volume of the substituent group calculated using the molinspirationI (www.molinspiration.com) cheminformations program.
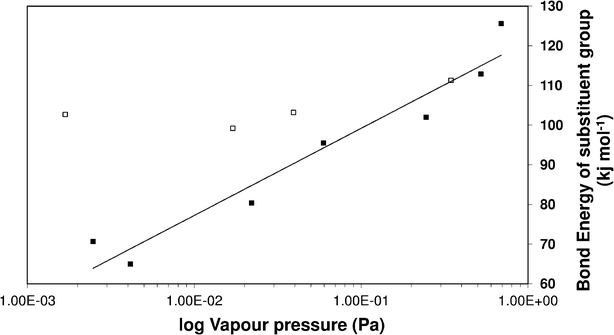 |
| | Fig. 6 Vapour pressure of ortho substituted benzoic acids vs. bond enthalpy of the substituent group on a benzene ring. ■ excludes electron donating groups (ERG) and large functional groups, □ ERG and large groups. | |
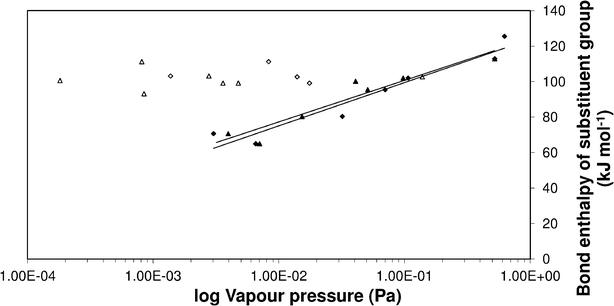 |
| | Fig. 7 Vapour pressure of meta and para substituted benzoic acids vs. bond enthalpy of the substituent group. (•) Meta and (▴) para excluding (ERG) and large functional groups, (○) meta and (△) para ERG and large groups. | |
Table 10 Hammett constants, inductive effect and steric effect. Values taken from ref. 38
| Substituent group |
σ
inductive
|
ortho σ
hammett
|
ortho σ
resonance
|
meta σ
hammett
|
meta σ
resonance
|
para σ
hammett
|
para σ
resonance
|
Steric effect |
|
Hammett constant was estimated for these values.
|
| COOH |
0.47 |
|
|
0.35 |
−0.12 |
0.44 |
−0.03 |
27.001 |
| F |
0.50 |
0.24 |
−0.26 |
0.34 |
−0.16 |
|
|
4.931 |
| OH |
0.28 |
−0.05a |
−0.33 |
0.13 |
−0.15 |
−0.38 |
−0.66 |
8.017 |
| CH3 |
−0.05 |
−0.17 |
−0.12 |
−0.07 |
−0.02 |
−0.17 |
−0.12 |
16.561 |
| Cl |
0.47 |
0.20 |
−0.27 |
0.37 |
−0.10 |
0.22 |
−0.25 |
13.535 |
| NH2 |
0.10 |
−0.41a |
−0.51 |
−0.16 |
−0.26 |
−0.66 |
−0.76 |
11.288 |
| Br |
0.45 |
0.21 |
−0.24 |
0.39 |
−0.06 |
0.23 |
−0.22 |
17.885 |
| OCH3 |
0.23 |
−0.39 |
−0.62 |
0.11 |
−0.12 |
−0.28 |
−0.51 |
25.545 |
| NO2 |
0.63 |
0.80 |
0.17 |
0.71 |
0.08 |
0.78 |
0.15 |
19.911 |
| I |
0.38 |
|
|
0.35 |
−0.03 |
0.28 |
−0.10 |
27.001 |
| CH2H5 |
−0.05 |
|
|
|
|
−0.15 |
−0.10 |
33.362 |
| OCOCH3 |
0.37 |
|
|
|
|
0.31 |
−0.06 |
44.529 |
| N(CH3)2 |
0.10 |
−0.73a |
−0.83 |
−0.21 |
−0.31 |
−0.83 |
−0.93 |
37.139 |
| NHCH3 |
0.12 |
|
|
|
|
−0.70 |
−0.82 |
28.963 |
| H (Benzoic) |
0.00 |
|
|
|
|
0.00 |
0.00 |
0 |
Fitting eqn (5) to the sub-cooled liquid vapour pressures gives an R2 of 0.797 (see Fig. 8) and modifies eqn (5) to give;
| |  | (6) |
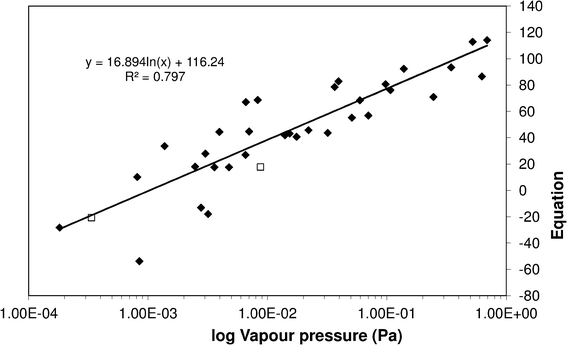 |
| | Fig. 8 Sub-cooled liquid vapour pressure of substituted benzoic acids vs.eqn (5). (![[double bond, length as m-dash]](https://www.rsc.org/images/entities/char_e001.gif) ) Literature and measurement data used to fit eqn (5), (□) measurements made to test SAR predictions. ) Literature and measurement data used to fit eqn (5), (□) measurements made to test SAR predictions. | |
The values for x and y are given in Table 11. From the values in Table 11 we can see the relative importance of the steric and resonance effects on vapour pressure for the difference isomers. As one might expect, the highest impact for the steric effect is in the ortho position when the two groups are adjacent and its importance decreases as they move further apart. The resonance effect is most important for the meta (y = 210) position and to a slightly lesser extent the para (y = 150). This gave an average absolute percentage deviation over the whole range of experimental and literature values here of 94% compared with 470% for Moller23/Nannoolal28, 1200% for Nannoolal29/Nannoolal28 and 5000% for Myrdal and Yalkowsky27/Stein and Brown.37
Table 11 Relative importance of steric and resonance effects for ortho-meta-para isomers using eqn (5)
| |
ortho
|
meta
|
para
|
|
x (steric weighting) |
−1.8 |
−1.3 |
−0.2 |
|
y (resonance weighting) |
10 |
210 |
150 |
To validate the SAR experimental data, determinations of the sub-cooled liquid vapour pressures were made. The best test would be a molecule with a big group that is strongly electron donating and has been measured after fitting the SAR. The molecules chosen were ortho and meta dimethylamino benzoic acids. The predicted the vapour pressures are 3.0 × 10⁻³ Pa and 3.1 × 10⁻⁴ Pa respectively. The ortho dimethylamino benzoic acid measured value of 1.07 × 10⁻² Pa, is a factor of 3.5 times higher than our estimate. The meta dimethylamino benzoic acid vapour pressure prediction is about half of the measured vapour value of 6.4 × 10⁻⁴ Pa. While they are not within error of the experimental values, the deviations are similar to the average absolute percentage errors associated with the data used to fit the SAR.
Clearly there is still room for improvement in constructing the SAR, but the results compare very well with the sort of errors associated with estimating low volatility vapour pressures, especially considering these two large electron donating groups represent the most challenging cases for the SAR. Relating the vapour pressure to physical effects such as steric and resonance also allows us to guess at what groups of compounds will be poorly covered by other estimation methods. While this SAR is limited in scope, the idea can be extended to substituted benzoic acids not covered here; bond enthalpies for a large number of groups are known in the literature, steric effects can be easily calculated and in principle Hammett constants can be calculated from density functional theory.38 The ideas here can also be extended to cover other low-volatility polyfunctional aromatic compounds where estimation methods are unable to capture the effects of ortho-, meta-, para-isomerism.
Impact on partitioning calculations
As with previous papers4,5 we have used the partitioning calculation method described by Barley and McFiggans,2 Barley et al., (2009)42 to determine the impact of vapour pressure estimates on Secondary Organic Aerosol (SOA) formation. The base case used the sub-cooled liquid vapour pressure derived from the KEMS or sub-cooled liquid vapour pressure derived from literature data with the abundance of all 33 components set to a value which gave 10.6 μg m−3 of Organic Aerosol (OA) as in the previous study.2Fig. 9 shows a box-whisker plot of the effect on OA yield of substituting a single estimated vapour pressure value for each compound, in turn. The boxes show the lower quartile, median and upper quartile; the whiskers are the lowest and highest values within 1.5 times the interquartile range; the crosses are the highest or lowest values outside of 1.5 times the interquartile range.
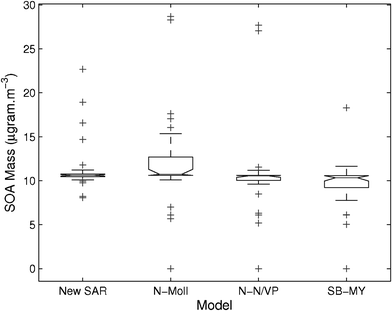 |
| | Fig. 9 Box-whisker plots of the predicted amount of OA formed by the partitioning model using estimated vapour pressures for a single compound out of the 33 compounds in this work. The boxes show the lower quartile, median and upper quartile, the whiskers are the lowest and highest values within 1.5 times the interquartile range. The base case uses experimental vapour pressure values with the concentration of all components set to the value that gives 10.6 μg m−3. Estimation methods are: 1) the SAR in this paper ;2) Moller23 with Nannoolal28Tb; 3) Nannoolal29 with Nannoolal28Tb; 4) Myrdal and Yalkowsky27 with Stein and Brown37Tb. | |
The spread with every method is much lower than we have seen in previous studies (e.g.ref. 4) with the worst method (Moller23/Nannoolal28) giving an interquartile range within 2.5 μg m−3 of the base case. The Moller/Nannoolal tends to overpredict OA mass and the Myrdal and Yalkowsky27/Stein and Brown37 tends to underpredict. The SAR and the Nannoolal29/Nannoolal28 methods work best, with each of them having the entire interquartile range within 1 μg m−3 of the base case. Each of the methods have a few cases where using the experimental values causes deviations in the predicted mass of more than 10 μg m−3.
Conclusions
Vapour pressures for a wide range of substituted benzoic acid data has been compared with model predictions and data from the literature. In both the solid and the sub-cooled liquid state there is a large dependence of the vapour pressure on ortho-meta-para isomerism. This dependence does not follow any immediately obvious pattern or trend. When estimating the vapour pressures of these compounds, errors will arise from either simplifying the influence on vapour pressure or ortho-meta-para isomerism or ignoring it altogether. In addition to this problem, the estimation methods perform poorly for the phthalic acids, as has been noted with aliphatic diacids in previous papers. We have also constructed a SAR to explain the trends in vapour pressure in terms of resonance and steric effects, which suggests that steric effects will be important in the ortho position and resonance effects dominate for meta and, to a lesser extent, para positions. Partitioning calculations show that the impact of errors associated with the estimation methods on SOA formation tend to be significantly less than we have seen with substituted diacids,4 although this may be as a result of cancelling errors e.g. overestimating a para vapour pressure for a given substituent and underestimating the ortho.
Acknowledgements
The authors thank NERC for financial support on grants NE/E018181/1 & NE/H002588/1 and the EU-funded European Integrated project on Aerosol Cloud Climate and Air Quality interactions (EUCAARI) under contract number 036833-2.
References
- D. H. Andrews, G. Lynn and J. Johnston, The heat capacities and heat of crystallization of some isomeric aromatic compounds, J. Am. Chem. Soc., 1926, 48, 1274–1287 CrossRef CAS.
- M. H. Barley and G. McFiggans, The critical assessment of vapour pressure estimation methods for use in modelling the formation of atmospheric organic aerosol, Atmos. Chem. Phys., 2010, 10, 749–767 CrossRef CAS.
- A. M. Booth, T. Markus, G. McFiggans, C. J. Percival, M. R. Mcgillen and D. O. Topping, Design and construction of a simple Knudsen Effusion Mass Spectrometer (KEMS) system for vapour pressure measurements of low volatility organics, Atmos. Meas. Tech., 2009, 2, 355–361 CrossRef CAS.
- A. M. Booth, M. H. Barley, D. O. Topping, G. McFiggans, A. Garforth and C. J. Percival, Solid state and sub-cooled liquid vapour pressures of substituted dicarboxylic acids using Knudsen Effusion Mass Spectrometry (KEMS) and Differential Scanning Calorimetry, Atmos. Chem. Phys., 2010, 10, 4879–4892 CrossRef CAS.
- A. M. Booth, W. J. Montague, M. H. Barley, D. O. Topping, G. McFiggans, A. Garforth and C. J. Percival, Solid state and sub-cooled liquid vapour pressures of cyclic aliphatic dicarboxylic acids, Atmos. Chem. Phys., 2011, 11, 655–665 CrossRef CAS.
- S. Chattopadhyay and P. J. Zieman, Vapor pressures of substituted and unsubstituted monocarboxylic and dicarboxylic acids measured using an improved thermal desorption particle beam mass spectrometry method, Aerosol Sci. Technol., 2005, 39, 1085–1100 CAS.
- S. Compernolle, K. Ceulemans and J.-F. Müller, Technical note: Vapor pressure estimation methods applied to secondary organic aerosol constituents from α-pinene oxidation: an intercomparison study, Atmos. Chem. Phys. Discuss., 2010, 10, 8487–8513 CrossRef.
- M. Colomina, P. Jimenez, R. Perez-Ossorio and C. Turrion, Thermochemical properties of alkylbenzoic acids VI. Enthalpies of combustion and formation of the o-, m-, and p-ethylbenzoic acids, J. Chem. Thermodyn., 1976, 8, 439–444 CrossRef CAS.
- M. Colomina, P. Jimenez, M. V. Roux and C. Turrion, Thermochemical properties of benzoic acid derivatives VII. Enthalpies of combustion and formation of the o-, m-, and p-methoxybenzoic acids, J. Chem. Thermodyn., 1978, 10, 661–665 CrossRef CAS.
- M. Colomina, P. Jiménez, R. Pérez-Ossorio and C. Turrión, Thermochemical properties of benzoic acid derivatives VIII. Enthalpies of combustion and formation of o-, m-, and p- t-butylbenzoic acids, J. Chem. Thermodyn., 1979, 11, 1179–1184 CrossRef CAS.
- M. Colomina, P. Jimenez and C. Turrion, Vapour pressures and enthalpies of sublimation of naphthalene and benzoic acid, J. Chem. Thermodyn., 1982, 14, 779–784 CrossRef CAS.
- M. Colomina, P. Jimenez, M. V. Roux and C. Turrion, An. Quim., Ser. A, 1986, 82, 126–130 CAS.
- M. Colomina, P. Jimenez, R. Perez-Ossorio, M. V. Roux and C. Turrion, Thermochemical properties of benzoic acid derivatives XIV. Enthalpies of combustion, vapour pressures, enthalpies of sublimation, and enthalpies of formation of o-, m-, and p-isopropylbenzoic acids, J. Chem. Thermodyn., 1987, 19, 155–162 CrossRef CAS.
- D. J. W. Grant, M. Mendizadeh, A. H.-L. Chow and J. E. Fairbrother, Non-linear van Hoff Solubility Temperature Plots and their Pharmaceutical Interpretation, Int. J. Pharm., 1984, 18, 25–38 CrossRef CAS.
- B. L. Hemming and J. H. Seinfeld, On the hygroscopic behaviour of atmospheric organic aerosols, Ind. Eng. Chem. Res., 2001, 40, 4162–4171 CrossRef CAS.
-
(a) K. Hilpert, Potential of mass spectrometry for the analysis of inorganic high temperature vapors, Fresenius J. Anal. Chem., 2001, 370, 471–478 CrossRef CAS;
(b) K. Hilpert, High-temperature mass spectrometry in materials research, Rapid Commun. Mass Sp., 1991, 5, 175–187 CrossRef CAS.
- H. Huang, Z. Zeng, W. Xue and W. Zhu, Solubility of terephthalic acid in the reaction system oligomeric bishydroxybutyl terephthalates - 1,4-butanediol, Polym. Eng. Sci., 2009, 49, 819–823 CAS.
- K. G. Joback and R. C. Reid, Estimation of pure-component properties from group contributions, Chem. Eng. Commun., 1987, 57, 233–243 CrossRef CAS.
- K. Kawamura and I. R. Kaplan, Motor exhaust emissions as a primary source for dicarboxylic acids in Los Angeles ambient air, Environ. Sci. Technol., 1987, 21, 105–110 CrossRef CAS.
- C. G. de Kruif, J. Voogd and J. C. A. Offringa, Enthalpies of sublimation and vapour pressures of 14 amino acids and peptides, J. Chem. Thermodyn., 1979, 11, 651–656 CrossRef CAS.
- J. W. Mauger, A. N. Paruta and R. J. Gerraughty, Solubilities of Sulfadiazine, Sulfomidine, and Sulfadimethoxine in Several Normal Alcohols, J. Pharm. Sci., 1972, 61, 94–97 CrossRef CAS.
- M. R. McGillen, A. T. Archibald, T. Carey, K. E. Leather, D. E. Shallcross, J. C. Wenger and C. J. Percival, Structure–activity relationship (SAR) for the prediction of gas-phase ozonolysis rate coefficients: an extension towards heteroatomic unsaturated species, Phys. Chem. Chem. Phys., 2011, 13, 2842–2849 RSC.
- B. Moller, J. Rarey and D. Ramjugernath, Estimation of the vapour pressure of non-electrolyte organic compounds via group contributions and group interactions, J. Mol. Liq., 2008, 143, 52–63 CrossRef CAS.
- M. J. S. Monte and D. M. Hillesheim, Thermodynamic study on the sublimation of the three iodobenzoic acids and of 2-fluoro- and 3-fluorobenzoic acids, J. Chem. Thermodyn., 2000, 32, 1727–1735 CrossRef CAS.
- M. J. S. Monte, A. R. R. P. Almeida and M. A. V. Ribeiro da Silva, Thermodynamic study of the sublimation of eight 4-n-alkylbenzoic acids, J. Chem. Thermodyn., 2004, 36, 385–392 CrossRef CAS.
- M. J. S. Monte, L. M. N. B. F. Santos, J. M. S. Fonseca and C. A. D. Sousa, Vapour pressures, enthalpies and entropies of sublimation of para substituted benzoic acids, J. Therm. Anal. Calorim., 2010, 100, 465–474 CrossRef CAS.
- P. B. Myrdal and S. H. Yalkowsky, Estimating pure component vapour pressures of complex organic molecules, Ind. Eng. Chem. Res., 1997, 36, 2494–2499 CrossRef CAS.
- Y. Nannoolal, J. Rarey, D. Ramjugernath and W. Cordes, Estimation of pure component properties Part 1. Estimation of the normal boiling point of non-electrolyte organic compounds via group contributions and group interactions, Fluid Phase Equilib., 2004, 226, 45–63 CrossRef CAS.
- Y. Nannoolal, J. Rarey and D. Ramjugernath, Part 3. Estimation of the vapor pressure of non-electrolyte organic compounds via group contributions and group interactions, Fluid Phase Equilib., 2008, 269, 117–133 CrossRef CAS.
- V. Oja and E. M. Suuberg, Vapor Pressures and Enthalpies of Sublimation of D-Glucose, D-Xylose, Cellobiose, and Levoglucosan, J. Chem. Eng. Data, 1999, 44, 26–29 CrossRef CAS.
- G. L. Perlovich, T. V. Volkova and A. Bauer-Brandl, Towards an understanding of the molecular mechanism of solvation of drug molecules: A thermodynamic approach by crystal lattice energy, sublimation, and solubility exemplified by hydroxybenzoic acids, J. Pharm. Sci., 2006, 95, 1448–1458 CrossRef CAS.
- G. L. Perlovich, T. V. Volkova, A. N. Manin and A. Bauer-Brandl, Extent and Mechanism of Solvation and Partitioning of Isomers of Substituted Benzoic Acids: A Thermodynamic Study in the Solid State and in Solution, J. Pharm. Sci., 2008, 97, 3883–3896 CrossRef CAS.
-
J. M. Prausnitz, R. N. Lichtenhaler, E. G. de. Azevedo, Molecular Thermodynamics of Fluid-phase Equilibria, Prentice-Hall Inc, New Jersey, 419, 1986 Search PubMed.
- M. A. V. Riberio da Silva, M. Monte and J. Ribeiro, Vapour pressures and the enthalpies and entropies of sublimation of five dicarboxylic acids, J. Chem. Thermodyn., 1999, 31, 1093–1107 CrossRef.
- M. A. V. Ribeiro da Silva, M. A. R. Matos, M. J. S. Monte, D. M. Hillesheim, M. C. P. O. Marques and N. F. T. G. Vieira, Enthalpies of combustion, vapour pressures, and enthalpies of sublimation of three methoxy-nitrobenzoic acids. Vapour pressures and enthalpies of sublimation of the three nitrobenzoic acids, J. Chem. Thermodyn., 1999, 31, 1429–1441 CrossRef CAS.
- M. A. V.Ribeiro da Silva, J. M. S. Fonseca, R. P. B. M. Carvalho and M. J. S. Monte, Thermodynamic study of the sublimation of six halobenzoic acids, J. Chem. Thermodyn., 2005, 37, 271–279 CrossRef.
- S. E. Stein and R. L. Brown, Estimation of normal boiling points from group contributions, J. Chem. Inf. Model., 1994, 34, 581–587 CrossRef CAS.
- Y. Takahata and D. P. Chong, Estimation of Hammett Sigma Constants of Substituted Benzenes Through Accurate Density-Functional Calculation of Core-Electron Binding Energy Shifts, Int. J. Quantum Chem., 2005, 103, 509–515 CrossRef CAS.
- Z. Tan and R. Sabbah, Thermodynamic study of the three isomers of iodobenzoic acid, Thermochim. Acta, 1994, 231, 109–120 CrossRef CAS.
- S. P. Verevkin and S. A. Kozlova, Di-hydroxybenzenes: Catechol, resorcinol, and hydroquinone: Enthalpies of phase transitions revisited, Thermochim. Acta, 2008, 471, 33–42 CrossRef CAS.
- M. M. Yassine and E. Dabek-Zlotorzynska, Determination of benzene polycarboxylic acids in atmospheric aerosols and vehicular emissions by liquid chromatography-mass spectrometry, Anal. Methods, 2010, 2, 129–134 RSC.
- M. Barley, D. O. Topping, M. E. Jenkin and G. McFiggans, Sensitivities of the absorptive partitioning model of secondary organic aerosol formation to the inclusion of water, Atmos. Chem. Phys., 2009, 9, 2919–2932, DOI:10.5194/acp-9-2919-2009.
|
| This journal is © The Royal Society of Chemistry 2012 |
Click here to see how this site uses Cookies. View our privacy policy here. 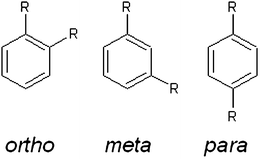


![[double bond, length as m-dash]](https://www.rsc.org/images/entities/char_e001.gif) ) and sub-cooled liquid (■) vapour pressures of substituted benzoic acids from this work and the literature.
) and sub-cooled liquid (■) vapour pressures of substituted benzoic acids from this work and the literature.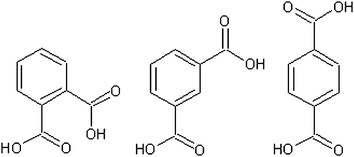



![[double bond, length as m-dash]](https://www.rsc.org/images/entities/char_e001.gif) ) Literature and measurement data used to fit eqn (5), (□) measurements made to test SAR predictions.
) Literature and measurement data used to fit eqn (5), (□) measurements made to test SAR predictions.
