Polyethylenimine covalently grafted on mesostructured porous silica for CO2 capture†
Hodna
Kassab
ab,
Mahmoud
Maksoud
a,
Sonia
Aguado
b,
Marc
Pera-Titus
*b,
Belén
Albela
a and
Laurent
Bonneviot
*a
aLaboratoire de Chimie, Ecole Normale Supérieure de Lyon UMR-CNRS 5182, Université de Lyon, 46 Allée d'Italie, 69364, Lyon Cedex, France. E-mail: laurent.bonneviot@ens-lyon.fr; Tel: +33 472 72 83 91; Fax: +33 472 72 88 60
bInstitut des Recherches sur la Catalyse et l'Environnement de Lyon, UMR 5256 CNRS, Université de Lyon, Av. A. Einstein, 69626, Villeurbanne Cedex, France. E-mail: marc.pera-titus@ircelyon.univ-lyon1.fr; Tel: +33 472 44 53 68; Fax: +33 472 44 53 99
First published on 6th February 2012
Abstract
Polyethylenimine (PEI) has been grafted on a 2D hexagonal mesostructured porous silica of MCM-41 type (LUS silica) using 3-glycidoxypropyltrimethoxysilane (GTMS) as a grafting agent to develop sorbents for CO2 capture. The advantage of this tether is to create ethanolamine units upon reaction of the epoxy group with the amine functions of PEI. Two synthetic routes have been explored: (1) reaction of GTMS and PEI and then grafting on a calcined MCM-41 silica (M-1), and (2) grafting of GTMS on the silica and then reaction with PEI (M-2). In both cases, the grafted solids are well structured according to the XRD patterns. The amounts of glycidoxypropylsilane (GS) and PEI are 14 and 9 wt%, and 21 and 16 wt%, respectively, for samples M-1 and M-2. The CO2 adsorption capacity of both materials has been tested at 303 K and 101 kPa and compared to a bare LUS silica sample impregnated with 25 wt% PEI (M-3-25). Samples M-1 and M-2 containing ethanolamine groups show higher CO2 adsorption capacities, with loading of about 150 and 134 mgCO2![[thin space (1/6-em)]](https://www.rsc.org/images/entities/char_2009.gif) /
/![[thin space (1/6-em)]](https://www.rsc.org/images/entities/char_2009.gif) gPEI (36 and 43 mgCO2
gPEI (36 and 43 mgCO2![[thin space (1/6-em)]](https://www.rsc.org/images/entities/char_2009.gif) /
/![[thin space (1/6-em)]](https://www.rsc.org/images/entities/char_2009.gif) g-sorbent), respectively, while the CO2 adsorption capacity was about 55 mgCO2
g-sorbent), respectively, while the CO2 adsorption capacity was about 55 mgCO2![[thin space (1/6-em)]](https://www.rsc.org/images/entities/char_2009.gif) /
/![[thin space (1/6-em)]](https://www.rsc.org/images/entities/char_2009.gif) gPEI (14 mgCO2
gPEI (14 mgCO2![[thin space (1/6-em)]](https://www.rsc.org/images/entities/char_2009.gif) /
/![[thin space (1/6-em)]](https://www.rsc.org/images/entities/char_2009.gif) g-sorbent) for the impregnated solid M-3-25.
g-sorbent) for the impregnated solid M-3-25.
Introduction
The rapid rise of temperature on Earth observed since the beginning of the industrial age has yielded a noticeable increase of the sea level, enlargement of deserts, modifications of infectious disease vectors and climatic perturbations. Global warming is arguably attributed to the increase of the CO2 concentration in the troposphere (from 280 ppm in pre-industrial times to ∼400 ppm in 2005) due to anthropogenic CO2 emissions, mostly driven by fossil fuel combustion.1CO2 recycling or remediation is now recognized as a societal priority. Technically, it involves three steps: capture from the emission source, transportation and long-term sequestration or reuse when possible.2 Apart from research efforts focusing on various solid adsorbents such as zeolites, pillared clays, activated alumina and carbons, hydrotalcites and metal–organic frameworks,3,4 loading amines on porous materials also appears a promising strategy for sorbent design. Ordered mesostructured silicas (OMS) are interesting candidates for this aim on the basis of their large surface areas (∼1000 m2 g−1) and rich surface chemistry ascribed to surface silanol groups.
The simplest method for incorporating amines on mesoporous silica is by direct wet impregnation from a solution of an amine polymer (e.g., polyethyleneimine or PEI and tetraethylene-pentamine or TEPA) and further solvent evaporation. The amine polymer is stabilized by formation of hydrogen bonds with surface silanol groups, which facilitates its distribution throughout the pore volume. This approach, generating the so-called ‘molecular baskets’,5–11 is however limited due to the fact that a significant amount of amine groups can be sterically hindered within the pore volume and form agglomerates between particles, both aspects affecting negatively CO2 diffusion within the amine-impregnated porous matrix.
A second method for incorporating amine groups is by direct co-condensation during the synthesis.12,13 In this one-pot synthesis approach, an aminosilane, the surfactant (cationic or anionic) and the silica precursor are mixed together and aged to allow hydrolysis and condensation of the silica precursor. This method offers the important advantages of mitigating pore blocking and providing homogeneous amine distributions,14–17 translating into higher CO2 loadings (see for instance the comparative studies reported by Yokoi et al.18 and Wang et al.19). Nevertheless, the degree of mesoscopic order of the solids decreases with the aminosilane concentration in the reaction mixture, leading ultimately to totally disordered solids. This method also requires the use of extraction techniques for surfactant removal to preserve the organic moieties.
Finally, amines can also be covalently grafted on a silica support avoiding surface polymerization. Unlike impregnated silicas, covalently tethered amine adsorbents avoid amine leaching, offering high regenerability through repeated adsorption/desorption cycles. A first possibility to graft amines on silica is via a two-step process involving a functionalisation step with alkylhalide groups followed by a SN2 reaction with an amine precursor.20Amine groups can also be directly grafted in one-pot synthesis via condensation of primary, secondary or tertiary aminoalkyltrialkoxysilanes with surface silanol groups.17,21–26 The final amine loading is limited both by the surface area, the number of accessible silanol groups on the support, the alkyl chain and the synthesis conditions. The incorporation of amine groups on mesoporous silicas usually involves a reduction of the pore size (and consequently the surface area). Nonetheless, the pore size can be increased through post-synthetic incorporation of pore-expanding agents (e.g., dimethyldecylamine, DMDA), tuning the pore size in MCM-41 materials in the range 3.5-20 nm.27 The presence of partially occluded non-ionic surfactant (e.g., polypropylene oxide) in amine-impregnated silicas has been reported to promote the CO2 adsorption capacity by dispersing the guest species, as well as by stabilizing CO2 intermediates via specific interactions between CO2, amine and hydroxyl groups belonging to the surfactant.8
This study is devoted to the formulation of synthetic strategies for controlling the location of PEI on a 2D hexagonal mesoporous silica with MCM-41 structure (LUS silica). A tether (3-glycidoxypropyltrimethoxysilane, GTMS) has been used for the first time to favour irreversible PEI anchoring and inhibit its migration along the porous surface, as an attempt to promote gas diffusion. This synthetic approach also presents the advantage of forming ethanolamine units by ring opening of epoxy groups in GTMS after reaction with the primary amine groups of PEI (see Fig. 1), mimicking the conventional solvent used for chemical absorption in the Girbotol process.
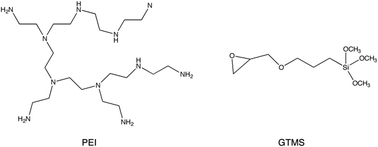 | ||
| Fig. 1 Molecular structure of PEI and GMTS. | ||
Experimental
Materials
Polyethyleneimine (PEI, Aldrich, MW = 800 Da, 19 amine groups/molecules), 3-glycidoxypropyltrimethoxysilane (GTMS; 98% Abcr), hexadecyltrimethylammonium-p-toluene-sulfonate, (CTATos; > 99% Merck), Ludox HS-40 (40% SiO2; Aldrich), sodium hydroxide (Acros), toluene (99%, Acros), cyclohexane (99%, SDS–Carlo–Erba), acetone (99%, Aldrich), ethanol (96%, Elvetec), methanol (99.9%, SDS–Carlo–Erba), and HCl 1 M were used as received. The sodium silicate solution was prepared as follows: Ludox (187 mL) was added to sodium hydroxide (32 g) in deionised water (800 mL) and stirred at 313 K until obtaining a clear solution.Analytical techniques
XRD: low angle X-ray powder diffraction experiments were carried out on a Bruker (Siemens) D5005 diffractometer using Cu-Kα (λ = 1.5418 Å) monochromatic radiation. FT-IR: Fourier-transformed infrared spectra were recorded from KBr pellets using a Mattson 3000 FT-IR spectrometer. ICP-AES: inductively coupled plasma atomic emission elementary analyses were carried out on a Perkin Elmer M1100 equipment with preliminary silica dissolution using HF acid. NMR: Solid 1H and 13C-NMR analyses were performed on a Bruker DSX400 apparatus using TMS as reference. TGA measurements were collected from Al2O3 crucibles on a DTA-TG Netzsch STA 409 PC/PG instrument under 30 cm3(STP) min−1 airflow in the temperature range 290–1273 K using a heating ramp of 10 K min−1. TGA-MS analyses were performed on PtRh 10% crucibles using a Setaram, Setsys Evolution 12 TGA-TDA instrument coupled to a Pfeiffer Omnistar 2006 mass spectrometer (1–200 uma) under 30-cm3(STP) min−1 air flow in the temperature range 290–973 K using a heating ramp of 10 K min−1. N2 sorption/desorption isotherms at 77.4 K were measured using a Micromeritics ASAP 2010M volumetric apparatus on solids outgassed overnight under vacuum (10−4 mbar) at 353–523 K (the BET specific surface was determined in the pressure range 0.05 < P/P0 < 0.20, while the mean pore size was measured using the Kruk equation by implementing the pore volume and d100 interplanar spacing30). CO2 sorption isotherms were measured at 303–333 K using a BELSORP-Hp apparatus on solids outgassed under vacuum (∼10−4 mbar) at 323 K for 12 h.Results and discussion
XRD patterns
All the solid samples present a regular mesostructure irrespective of the PEI grafting method. Three peaks can be observed in all cases (Fig. 2 & Fig. S1, ESI†), which can be assigned to <100>, <110> and <200> reflections based on a hexagonal unit cell, indicating the presence of a 2D hexagonal channel array. The unit cella0 value calculated from the d100 spacing (a0 = 2d100/√3) is only slightly modified upon organic functionalisation (a0 = 4.5–4.7 nm, Table 1) compared to the parent silicaLUS-C (a0 = 4.6 nm). The thickness of the silica walls is about 1.6 nm.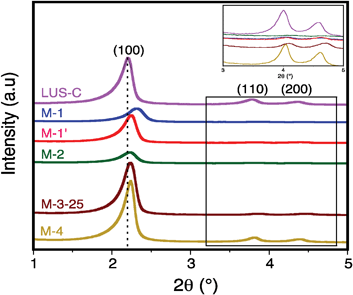 | ||
| Fig. 2 XRD patterns of samples LUS-C, M-1, M-2, M-3-25 and M-4. | ||
| Material | a 0 ± 0.1 (nm)a | d 100 HWHH ± 0.01 (2θ/°)ab | d p ± 0.01 (nm)c | S BET ± 5% (m2 g−1) | V p ± 5% (cm3 g−1)d | Accessible volume (%)e | Inaccessible volume (%)e |
|---|---|---|---|---|---|---|---|
| a determined from XRD measurements from (100) peaks. b half with at half height for the d100 (in 2θ). c mean pore size computed using the Kruk equation (in parentheses, values measured using BJH). d cumulated pore volume at P/P0 = 0.98–0.99 e %Accessible volume computed as Vp/0.76 × 100 (0.76 cm3 g−1 is the pore volume of LUS-C at P/P0 ∼0.7), and %Inaccessible volume computed from the difference 100−%Accessible vol.−%vol. PEI + GS using a density of 1 g cm−3 for loaded PEI and GS (weight loadings indicated in Table 2). | |||||||
| LUS-C | 4.6 | 0.34 | 3.9 (3.6) | 904 | 0.81 | 100 | 0 |
| M-1 | 4.3 | 0.42 | 1.5 | 80 | 0.054 | 7 | 63 |
| M-1′ | 4.5 | 0.35 | 1.4 | 53 | 0.046 | 6 | 41 |
| M-2 | 4.5 | 0.32 | 1.3 | 42 | 0.04 | 5 | 46 |
| M-3-25 | 4.5 | 0.37 | 2.7 | 426 | 0.22 | 29 | 39 |
| M-3-50 | 4.7 | 0.34 | 0.8 | 6.6 | 0.011 | 2 | 34 |
| M-3-75 | 4.5 | 0.29 | — | — | — | 0 | 8 |
| M-4 | 4.5 | 0.30 | 3.4 (2.7) | 600 | 0.50 | 66 | 18 |
Material M-1 exhibits a lower a0 value, i.e. 4.3 nm, consistent with a shrinkage of the structure. This observation, already reported for PEI-impregnated mesoporous silicas 7, is likely due to the modification of the surface tension upon direct interaction of PEI oligomers with silanol groups through hydrogen bonding. In addition, the half width at half peak height (HWHH) for the d100 reflection (Table 1) is larger for sample M-1 (0.42°) than for the other materials (HWHH = 0.30–0.35°). This difference may arise from a higher heterogeneous dispersion of PEI–GTMS units inside the silica channels for this sample. A narrower peak for M-1′ is consistent with a better dispersion of PEI–GTMS as a result of the pre-mixing step at 295 K before grafting (see above). Another striking observation concerns the intensity of the <100> peak, which depends on how the pores are filled by PEI. The intensity is expected to decrease when PEI completely fills the channels, decreasing the XRD contrast. However, a partial filling by a polymer layer should maintain a relatively high contrast. The evolution of the <100> peak intensity should therefore be correlated to the effective organic loading. This point will be addressed later.
The amount of glycidoxypropylsilyl (GS) and PEI groups on the solids measured from chemical and TGA analyses (Fig. 3 & Table 2), indicate that sample M-1 presents the lowest PEI and tether loadings (14 and 9 wt%, respectively) compared to samples M-1′ (25 and 15 wt%) and M-2 (21 and 16 wt%). These results suggest that both PEI and tether diffusion in the channel network is more difficult to perform in a one-pot reaction than the sequential route, resulting in a higher loading when the reactants are left in contact for 2 h before heating for sequential grafting. In addition, using the sequential route, similar PEI and GS loadings (21 and 16 wt%, respectively) are achieved in material M-2 (Table 2). Finally, the impregnated sample M-3-25 shows a PEI loading similar to that obtained for sample M-2, i.e. the 24 wt% (Table 2). M-3-25 sample will be considered hereinafter as a reference to establish a proper comparison with PEI-grafted sorbents.
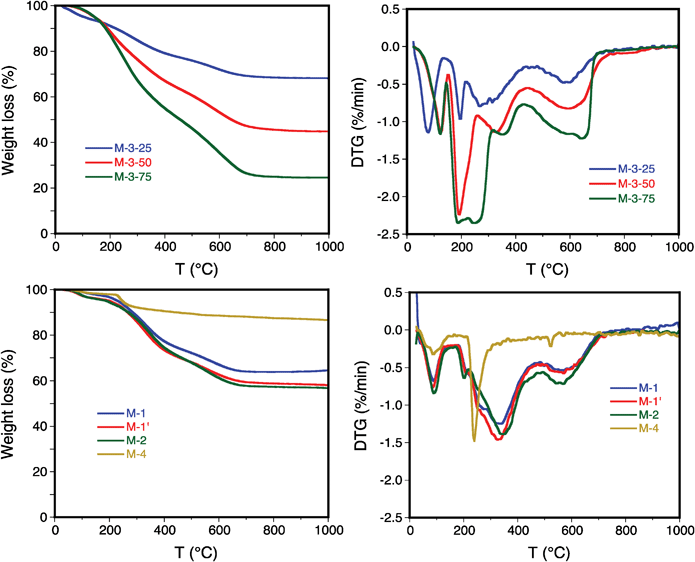 | ||
| Fig. 3 TGA (left) and DTG (right) patterns on samples M-1, M-1′, M-2, M-3-25, M-3-50, M-3-75 and M-4. | ||
| Material | PEI a wt% ± 1 | GSa wt% ± 1 | CO2 adsorption capacity (101 kPa)b | Henry's constant (× 102)bc | ||
|---|---|---|---|---|---|---|
(mgCO2![[thin space (1/6-em)]](https://www.rsc.org/images/entities/char_2009.gif) / /![[thin space (1/6-em)]](https://www.rsc.org/images/entities/char_2009.gif) g-sorbent) g-sorbent) |
(mgCO2![[thin space (1/6-em)]](https://www.rsc.org/images/entities/char_2009.gif) / /![[thin space (1/6-em)]](https://www.rsc.org/images/entities/char_2009.gif) g-PEI) g-PEI) |
(mol g−1kPa−1) | (mol gPEI−1kPa−1) | |||
| a PEI: polyethylenimine, GS: 3-glycidoxypropylsilane. b measured at 303 K. c values computed from the derivate of the adsorption isotherm at P→0 using spline fitting functions. | ||||||
| LUS-C | — | — | 23 | — | 0.601 | — |
| M-1 | 14 | 9 | 36 | 150 | 2.70 | 11.2 |
| M-1′ | 25 | 15 | 35 | 80 | 2.69 | 6.14 |
| M-2 | 21 | 16 | 43 | 134 | 4.22 | 13.2 |
| M-3-25 | 24 | — | 14 | 55 | 2.66 | 10.5 |
| M-3-50 | 49 | — | 43 | 86 | 8.13 | 14.3 |
| M-3-75 | 70 | — | 77 | 102 | 1262 | 1672 |
| M-4 | — | 12 | 15 | — | 0.458 | — |
FT-IR spectra
To further characterize the nature of the organic moieties in PEI-functionalised silicas, some FT-IR characterization tests were carried out on both PEI-impregnated and PEI-grafted samples. Upon PEI impregnation in LUS-C, new IR bands appear at about 1066, 1132, 1309, 1365, 1465, 1560, 2823 et 2939 cm−1), the intensity increasing linearly with the polymer loading (M-3-X, X = 25, 50, 75, Fig. S2, ESI†). These bands are also present in the spectra obtained on PEI-grafted samples and can be attributed to the IR fingerprint of the raw PEI polymer (Fig. 4). The two bands appearing at about 2900 cm−1 and in the range 1400–1600 cm−1 can be unambiguously attributed, respectively, to stretching vibrations of C–H and C–N bonds, i.e. ν(C–H) and ν(C–N).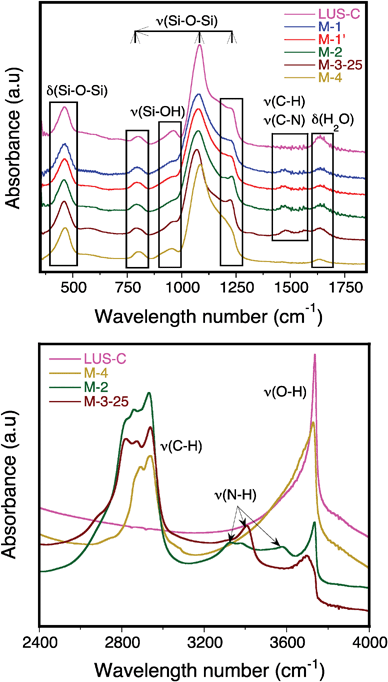 | ||
| Fig. 4 FT-IR spectra in the range 350–1850 cm−1 (on top) and DRIFT spectra in the range 2400–4000 cm−1 (on bottom) on samples LUS-C, M-1, M-1′, M-2, M-3-25 and M-4. | ||
In the case of the GS tethered sample M-4, only one band at about 2900 cm−1 can be clearly distinguished from the silica IR spectra ascribed to the stretching vibration of C–H bonds (Fig. S3, ESI†). This bands overlaps with that belonging to PEI after grafting for samples M-1, M-1′ and M-2. FT-IR does not appear therefore to be a specific technique to characterize GS groups, since no specific IR bands ascribed to epoxyde groups can be clearly visualized (this group is better characterized by 13C-RMN, see below). Note however that the band appearing at about 960 cm−1 decreases after grafting for samples M-4, M-1 and M-1′, this observation being coherent with a reduction of the number of surface silanol groups. Moreover, this band does not completely vanish after PEI grafting for sample M-2, reflecting that GS groups are not detached in the sequential grafting route.
The complex band appearing between 1000 and 1300 cm−1, corresponding to the asymmetric stretching vibration νa(Si–O) of SiO4 tetrahedra, is slightly modified for samples M-1, M-1′ and M-2 compared to the parent LUS-C silica. The bands are red shifted and the shape changes, which might be ascribed to the presence strong hydrogen bonds between PEI and the silica surface. The band centred at 1650 cm−1 can be attributed to the bending vibration of adsorbed water, δ(H2O), decreasing upon GS grafting, i.e.M-4, since the surface becomes less hydrophilic due to a decrease of the number of silanol functions. However, upon PEI incorporation (M-2), this band recovers a marked intensity, since PEI favours water adsorption on the solid despite a reduction of the number of silanol groups.
13C-NMR
Fig. 5 shows the 13C-RMN spectra obtained on samples M-4 and M-2. The spectrum corresponding to sample M-4 confirms the attachment of GS groups on the silica walls, reproducing the whole collection of chemical displacements for the different C atoms obtained on GMTS (not shown). Note also that the peak centred at about 50 ppm, which should be more intense due to the presence of three methoxy groups, actually shows a lower intensity than for the other peaks, confirming the GMS attachment on the silica support. Fig. 5 shows the assignation of the different possible chemical displacements for the different C atoms in the grafted GS groups.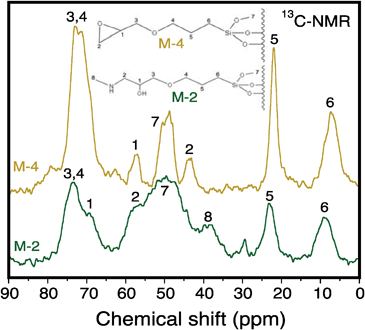 | ||
| Fig. 5 13C-NMR spectra on samples M-4 and M-2. | ||
In the case of material M-2, one can remark the variation in the form and intensity of the peaks appearing at 56 and 73 ppm compared to those observed on sample M-4, both peaks appearing simultaneously in the GS and PEI13C-NMR spectra. The original peak appearing at 44 ppm in sample M-4 shows a practically negligible intensity after PEI grafting, while two new additional peaks appear at about 39 and 70 ppm, being ascribed, respectively, to CH2–NH2 and CH–OH units. These latter two peaks provide unambiguous evidence of the reaction between the grafted GS and PEI according to an oxacyclopropane ring opening mechanism described in Scheme S1, ESI.†
N2 adsorption/desorption isotherms at 77.4 K
Fig. 6 plots the N2 adsorption/desorption isotherms at 77.4 K on samples LUS-C, M-1, M-2, M-3-25, M-3-50 and M-4, while Table 1 collects the most significant textural properties of these solids. The genuine LUS-C support exhibits a Type IV isotherm pattern typical of mesoporous silicas with no hysteresis loop and possesses a large pore volume (0.81 cm3 g−1) and a high specific surface (904 m2 g−1). Material M-4, consisting of grafted GS tether on silica (12 wt%), presents a net decrease of both the pore volume (0.50 cm3 g−1) and the specific surface area (600 m2 g−1). The reduction of the phase transition pressure (P/P0) from 0.32 for LUS-C to 0.28 for M-4 due to narrow-sized mesopore filling (or secondary micropore according to the IUPAC) due to significant interactions with the pore walls is compatible with a reduction of the mean pore size from 3.9 to 3.4 nm (see Table 2). The steep step in the adsorption isotherm of M-4 solid is consistent with an homogeneous distribution of the GS tether, most likely lying down the channel mouths.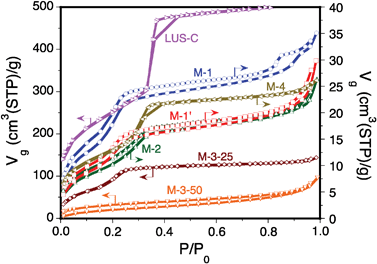 | ||
| Fig. 6 N2 adsorption/desorption isotherms at 77.4 K on samples LUS-C, M-1, M-2, M-3-25 and M-4. | ||
In the case of PEI-impregnated samples, a mere impregnation of 24 wt% PEI on LUS-C leads to material M-3-25 with a neatly smaller pore volume of 0.22 cm3 g−1 and a specific surface area divided by two (SBET = 426 m3 g−1). In the case of samples M-3-50 and M-3-75, with 49 and 70 wt% PEI, respectively, the pore volume and the surface area become practically suppressed (≤ 0.01 cm3 g−1 and ≤ 7 m2 g−1, see Table 1 & 2, isotherms not provided). This result suggests PEI migration into the channels and complete filling beyond 50 wt% PEI loading. Note that at 24 wt% PEI loading, i.e. half of the loading necessary to achieve full pore filling, the pore volume has decreased ca. 4 times instead of 2 compared to the original pore volume of LUS-C (0.81 cm3 g−1). A more accurate evaluation may be obtained assuming that the bare silica support, LUS-C, keeps its structure upon impregnation and that all PEI fills exactly the pore channels in M-3-50 (i.e. no PEI occupies external positions). Accordingly, the volume occupancy by PEI in M-3-25 would be 32%, leaving a 29% of pore volume accessible to N2 at 77.4 K and the remaining 39% inaccessible, even at P/P0 ∼1 (see Table 1). These values have been computed from the pore volume measured at P/P0 ∼0.7 on the LUS-C sample (about 0.76 cm3 g−1) and taking a PEI density of 1 g cm−3. Assuming again full pore occupancy by PEI in sample M-3-75, 30% of the PEI would lay inside the pores, while 70% would be located outside the mesoporous grains. Finally, the step at P/P0 = 0.21 in sample M-3-25 shows that the pore diameter (∼2.7 nm) is rather regular and that PEI forms a rather homogeneous ∼0.8-nm thick layer on the channel surface accessible to N2. The apparent density of loaded PEI in samples M-3-25 and M-3-50 computed as the ratio weight loading of PEI and pore volume reduction (see Table 1 & 2) is, respectively, about 0.44 and 0.65 g cm−3 (lower than the value of 1 g cm−3 used in the estimation of the inaccessible volume to N2).
In the following, the modification of the porosity upon the introduction of both GS tether and PEI will be discussed. Fig. 7 illustrates the different proposed PEI coverage schemes that can be achieved on these materials. In material M-1, where the tether is covalently linked to PEI before grafting to LUS-C, the isotherm still shows a Type IV isotherm pattern with two steps on the adsorption branch for P/P0 about 0.20 and 0.90. Desorption occurs with a shift towards higher adsorbed volumes all along the desorption branch leading to a marked hysteresis loop (see Fig. 6). Note also a first hysteresis loop starting at P/P0 > 0.85. Below this value, the adsorption and desorption branches match together with a quasi-constant upward shift and exhibit roughly the same step height. This result suggests that N2retention does not occur in the channels, but rather within intergrain voids partially blocked with PEI. Note also that the plateau in range P/P0 = 0.2–0.7 is larger than that observed for LUS-C. Assuming a loaded GS + PEI density about 1 g cm−3, the estimated GS + PEI volume occupancy in sample M-1 is about 30% with accessible and inaccessible volumes of about 7% and 63%, respectively (see Table 1). Knowing that PEI is not totally localized inside the silica channels, accessible and inaccessible volumes should be regarded as slightly overestimated.
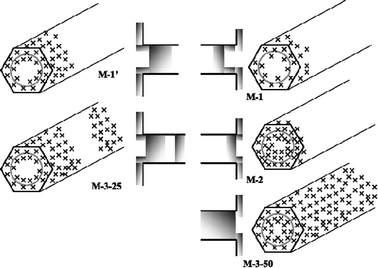 | ||
| Fig. 7 PEI coverage schemes inside silica channels and on the external surface for samples M-1, M-1′, M-2, M-3-25 and M-3-50. | ||
Material M-1′, differing from M-1 only by a pre-mixing step before heating to favour PEI migration within the channels during grafting, also shows a Type IV isotherm pattern with a marked hysteresis loop due to N2retention at higher pressures. The main difference resides on the higher N2 sorbed volume at high pressures and on a higher desorption pressure (0.94), leading to a less pronounced hysteresis loop. This result is consistent with a lower amount of PEI located within intergrain voids than for material M-1, showing larger windows through which N2 can desorb. The volume occupancy also suggests a large internal volume fraction inaccessible to N2 in sample M-1′ (about 41%, see Table 1). In both samples M-1 and M-1′, PEI tends to cover uniformly the channel surface, leading to a similar apparent pore size of 2.1 nm. This apparent size is similar to that measured for the impregnated material M-3-25. Such agreement might be attributed to the formation of a 0.8-nm thick PEI monolayer. This hypothesis can also be supported by the marked reduction of the <100> peak intensity in the XRD pattern for both materials (see Fig. 1).
Material M-2 corresponds to another situation where PEI is grafted on material M-4, namely after grafting the GS tether on LUS-C. The resulting N2 adsorption/desorption isotherms on material M-2 are similar to those observed on sample M-1′, with similar plateau heights and upward shifts of the desorption branch. Nonetheless, the N2 adsorption capacity at P/P0 > 0.94 is smaller (−30%) and pore filling begins at a higher pressure (P/P0 ∼0.26). These observations suggest that, unlike sample M-1′, PEI locates more preferentially within intergrain voids leaving a large internal volume fraction inaccessible to N2 (at least 46%, see Table 1). Contrary to that material, the condensation step in sample M-2 is completed at a higher pressure (P/P0 ∼0.29, apparent pore size about 2.5 nm). This size is close to that measured for sample M-4 with the surface only covered by the tether (2.7 nm). This observation suggests a virtual absence of PEI coverage on the inner accessible volume of the sample. This latter case also suggests that PEI reaction on the grafted tether leads to broader PEI segregation on the external surface.
Finally, note the upward shift of the desorption branch down to the lowest pressure for materials M-1, M-1′ and M-2, suggesting N2 forcing into the silica channels pores at P/P0 > 0.8 and further retention when the pressure decreases. This behaviour is most likely due to a slow N2 diffusion within the PEI plugging barrier in 1D channels. Note however that the amount of N2 retained during desorption represents less than 7% of the N2 adsorbed in the accessible volume.
CO2 adsorption isotherms
Fig. 8 plots the anhydrous CO2 adsorption isotherms of solids LUS-C, M-1, M-1′, M-2, M-3-25 and M-4. Two adsorption patterns can be clearly distinguished: (1) physical adsorption on surface silanol groups for samples LUS-C and M-4, where the CO2 loading shows a quasi linear trend with pressure, and (2) physical adsorption on amine groups for the rest of samples (grafted or impregnated with PEI), showing a characteristic Type I (pseudo-Langmuir) adsorption pattern indicative of stronger interactions between acidic CO2 and alkaline amine surface groups.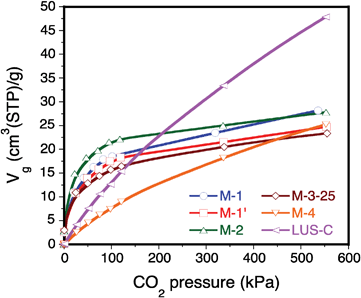 | ||
| Fig. 8 CO2 adsorption isotherms at 303 K for PEI-grafted samples LUS-C, M-1, M-1′, M-2, M-3-25 and M-4. | ||
Physical adsorption on surface silanol groups provide higher CO2 adsorption capacities than for amine groups, especially in the case of sample M-4, but at the expense of a lower CO2 affinity (lower Henry's constants). Although the samples grafted or impregnated with PEI show much lower CO2 adsorption capacities due to their reduced pore volumes, their affinity to CO2 becomes promoted (higher Henry's constants) due to the formation of stronger bonds between CO2 and PEI or grafted ethanolamine groups, probably through the formation of surface carbamates.
In the case of impregnated M-3-50 and M-3-75 samples, despite the different impregnated PEI amounts, the CO2 adsorption capacities remain comparable (see Table 2 and Fig. 9). This observation suggests that the adsorption capacity of PEI-impregnated solids does not depend much on the PEI loading. Note however the sharp adsorption trends obtained at low pressures, reflecting the formation of strong bonds between CO2 and amine groups belonging to PEI.
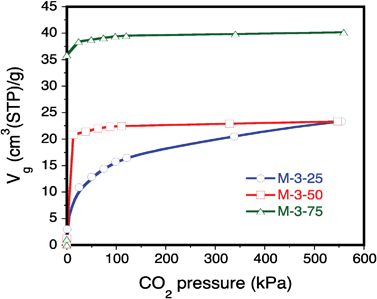 | ||
| Fig. 9 CO2 adsorption isotherms at 303 K for PEI-impregnated samples M-3-25, M-3-50 and M-3-75. | ||
Table 2 compares the adsorption capacities per gram of adsorbent and per gram of PEI at 303 K and 101 kPa obtained on the different materials prepared in this study. Higher CO2 adsorption capacities are obtained on systems containing ethanolamine units: 150 and 134 mgCO2![[thin space (1/6-em)]](https://www.rsc.org/images/entities/char_2009.gif) /
/![[thin space (1/6-em)]](https://www.rsc.org/images/entities/char_2009.gif) gPEI (36 and 43 mgCO2
gPEI (36 and 43 mgCO2![[thin space (1/6-em)]](https://www.rsc.org/images/entities/char_2009.gif) /
/![[thin space (1/6-em)]](https://www.rsc.org/images/entities/char_2009.gif) g-sorbent), respectively, for samples M-1 and M-2 compared to 55 mgCO2
g-sorbent), respectively, for samples M-1 and M-2 compared to 55 mgCO2![[thin space (1/6-em)]](https://www.rsc.org/images/entities/char_2009.gif) /
/![[thin space (1/6-em)]](https://www.rsc.org/images/entities/char_2009.gif) gPEI (14 mgCO2
gPEI (14 mgCO2![[thin space (1/6-em)]](https://www.rsc.org/images/entities/char_2009.gif) /
/![[thin space (1/6-em)]](https://www.rsc.org/images/entities/char_2009.gif) g-sorbent) for the impregnated sample M-3-25. Sample M-2 shows the highest CO2 adsorption capacity per gram of adsorbent, but displays a lower capacity per gram of PEI than for sample M-1 containing more external PEI. Although PEI-impregnated samples M-3-50 and M-3-75 show high CO2 adsorption capacities per gram of adsorbent, this capacity decreases when computed per gram of PEI due to their extremely low accessible volume for gas diffusion. The surface is only slightly grafted by PEI in sample M-3-50 and the amount of CO2 adsorbed per gram of PEI is rather modest. In the case of sample M-3-75, about 30% more PEI is grafted on the external surface, which explains the different CO2 capacities between this sample and M-3-50.
g-sorbent) for the impregnated sample M-3-25. Sample M-2 shows the highest CO2 adsorption capacity per gram of adsorbent, but displays a lower capacity per gram of PEI than for sample M-1 containing more external PEI. Although PEI-impregnated samples M-3-50 and M-3-75 show high CO2 adsorption capacities per gram of adsorbent, this capacity decreases when computed per gram of PEI due to their extremely low accessible volume for gas diffusion. The surface is only slightly grafted by PEI in sample M-3-50 and the amount of CO2 adsorbed per gram of PEI is rather modest. In the case of sample M-3-75, about 30% more PEI is grafted on the external surface, which explains the different CO2 capacities between this sample and M-3-50.
More detailed CO2 isotherms have been obtained in the temperature range 303–343 K for sample M-1 showing the highest affinity of CO2 to PEI (see Fig. S4 & S5, ESI†). At low pressures (<100 kPa), all the materials show similar curves at the three temperatures, the adsorption capacities only being slightly promoted at 323 K. Beyond this pressure, the materials show markedly higher adsorption capacities at 323 K than at 343 and 303 K; the isotherms show a quasi-linear increase of the adsorption capacity, similar to that observed for sample M-4 owing to the presence of free surface silanol groups. This hybrid behaviour has also been observed by Sayari & co-workers31 on monoamine-grafted PE-MCM-41 and modelled using a binary Langmuir–Freundlich isotherm equation including two contributions accounting, respectively, for physical adsorption on the bare support and chemical adsorption on amines. These trends suggest that CO2 adsorption on silanol groups is affected by the accessibility of CO2 to the active centres, most probably due to partial pore blocking by PEI.
Comparing the CO2 adsorption behaviour of materials M-1′ and M-3-25, the former shows higher adsorption capacities at 303 K, but lower at 323 K. Although both materials possess a similar PEI loading (25% and 24%, respectively, see Table 2), the N2 adsorption isotherms at 77.4 K reveal that PEI does not occupy the same positions in both materials. Indeed, in sample M-1′, a higher PEI amount is expected to be located on the external surface blocking channel mouths, inhibiting CO2 diffusion into the channels at 303 K and in turn its accessibility to the active centres. In contrast, the same PEI amount is distributed on the whole external and internal surface for sample M-3-25.
Conclusions
We have demonstrated the design and engineering of mesostructured silicas for CO2 capture based on the generation of supported ethanolamine groups. Sample M-1, consisting on one-pot PEI-GS grafting, shows the most promising adsorption capacities computed as mgCO2![[thin space (1/6-em)]](https://www.rsc.org/images/entities/char_2009.gif) /
/![[thin space (1/6-em)]](https://www.rsc.org/images/entities/char_2009.gif) gPEI due to a better dispersion of the surface amine groups on the internal surface of the mesoporous channel network. Sample M-1′ is less active for CO2 adsorption owing to a more heterogeneous dispersion of PEI-GS units, providing amine groups with different chemical nature and in its turn different chemical affinity to CO2, as well as more diffusional restrictions.
gPEI due to a better dispersion of the surface amine groups on the internal surface of the mesoporous channel network. Sample M-1′ is less active for CO2 adsorption owing to a more heterogeneous dispersion of PEI-GS units, providing amine groups with different chemical nature and in its turn different chemical affinity to CO2, as well as more diffusional restrictions.
The series of PEI-grafted materials M-1, M-1′ and M-2 show a hybrid CO2 adsorption behaviour between chemical and physical adsorption, the former ruling CO2 adsorption at lower pressures through interaction with amines and the latter at higher pressures through interaction with residual surface silanol groups. Further studies are necessary to promote the CO2 adsorption capacities, as well as to study the effect of moisture on the adsorption properties and stability of the materials.
References
- IPCC Report on Climate Change, R. K. Pachauri and A. Reisinger (ed.), IPCC, Geneve, Switzerland, 2007 Search PubMed.
- IPCC Special Report on Carbon Dioxide Capture and Storage, O. D. B. Metz, H. de Coninck, M. Loos and L. Meyer (ed.), IPCC, Geneva, Switzerland, 2005 Search PubMed.
- S. Choi, J. H. Drese and C. W. Jones, ChemSusChem, 2009, 2, 796 CrossRef CAS.
- D. M. D'Alessandro, B. Smit and J. R. Long, Angew. Chem., Int. Ed., 2010, 49, 6058 CrossRef CAS.
- W. J. Son, J. S. Choi and W. S. Ahn, Microporous Mesoporous Mater., 2008, 113, 31 CrossRef CAS.
- X. C. Xu, C. S. Song, J. M. Andresen, B. G. Miller and A. W. Scaroni, Energy Fuels, 2002, 16, 1463 CrossRef CAS.
- X. C. Xu, C. S. Song, J. M. Andresen, B. G. Miller and A. W. Scaroni, Microporous Mesoporous Mater., 2003, 62, 29 CrossRef CAS.
- M. B. Yue, Y. Chun, Y. Cao and X. Dong, Adv. Funct. Mater., 2006, 16, 1717 CrossRef CAS.
- M. B. Yue, L. B. Sun, Y. Cao, Z. J. Wang, Y. Wang, Q. Yu and J. H. Zhu, Microporous Mesoporous Mater., 2008, 114, 74 CrossRef CAS.
- J. C. Hicks, J. H. Drese, D. J. Fauth, M. L. Gray, G. G. Qi and C. W. Jones, J. Am. Chem. Soc., 2008, 130, 2902–2903 CrossRef CAS.
- J. J. Wen, F. N. Gu, F. Wei, Y. Zhou, W. G. Lin, J. Yang, J. Y. Yang, Y. Wang, Z. G. Zoub and J. H. Zhu, J. Mater. Chem., 2010, 20, 2840 RSC.
- G. Xomeritakis, C. Y. Tsai, Y. B. Jiang and C. J. Brinker, J. Membr. Sci., 2009, 341, 30 CrossRef CAS.
- A. Stein, B. J. Melde and R. C. Schroden, Adv. Mater., 2000, 12, 1403 CrossRef CAS.
- T. Yokoi, H. Yoshitake, T. Yamada, Y. Kubota and T. Tatsumi, J. Mater. Chem., 2006, 16, 1125 RSC.
- L. Wang, L. Ma, A. Wang, Q. Liu and T. Zhang, Chin. J. Catal., 2007, 28, 805 CrossRef CAS.
- S. Huh S, J. W. Wiench, J.-C. Yoo, M. Pruski and Y. S. Lin, Chem. Mater., 2003, 15, 4247 CrossRef.
- M. H. Lim and A. Stein, Chem. Mater., 1999, 11, 3285 CrossRef CAS.
- S.-N. Kim, W.-J. Son, J.-S. Choi and W.-S. Ahn, Microporous Mesoporous Mater., 2008, 115, 497 CrossRef CAS.
- T. Yokoi, H. Yoshitake and T. Tatsumi, J. Mater. Chem., 2004, 14, 951 RSC.
- T. Tsuda and T. Fujiwara, J. Chem. Soc., Chem. Commun., 1992, 1659 RSC.
- V. Zelenak, D. Halamova, L. Gaberova, E. Bloch and P. Llewellyn, Microporous Mesoporous Mater., 2008, 116, 358 CrossRef CAS.
- N. Hiyoshi, K. Yogo and T. Yashima, Microporous Mesoporous Mater., 2005, 84, 357 CrossRef CAS.
- P. J. E. Harlick and A. Sayari, Ind. Eng. Chem. Res., 2007, 46, 446 CrossRef CAS.
- G. P. Knowles, J. V. Graham, S. W. Delaney and A. L. Chaffee, Fuel Process. Technol., 2005, 86, 1435 CrossRef CAS.
- C. Knofel, J. Descarpentries, V. Benzaouia, S. Zelenak, S. Mornet, P. L. Llewellyn and V. Hornebecq, Microporous Mesoporous Mater., 2007, 99, 79 CrossRef.
- J. Wei, J. Shi, H. Pan, W. Zhao, Q. Ye and Y. Shi, Microporous Mesoporous Mater., 2008, 116, 394 CrossRef CAS.
- A. Sayari, Y. Yang, M. Kruk and M. Jaroniec, J. Phys. Chem. B, 1999, 103, 3651 CrossRef CAS.
- L. Bonneviot, M. Morin and A. Badiei, 2001, WO 01/55 031A1.
- P. Reinert, B. Garcia, C. Morin, A. Badiei, P. Perriat, O. Tillement, L. Bonneviot, in Nanotechnology in Mesostructured Materials, Elsevier Science Bv, Amsterdam, 2003, vol. 146, pp. 133–136 Search PubMed.
- M. Kruk and M. Jaroniec, Chem. Mater., 2001, 13, 3169 CrossRef CAS.
- R. Serna-Guerrero, Y. Belmabkhout and A. Sayari, Chem. Eng. J., 2010, 161, 173 CrossRef CAS.
Footnote |
| † Electronic Supplementary Information (ESI) available. See DOI: 10.1039/c2ra01007k/ |
| This journal is © The Royal Society of Chemistry 2012 |
