Novel Claycunbic to eliminate micropollutants and Vibrio fischeri from water†
Jurate
Virkutyte
*a and
Rajender S.
Varma
*b
aPegasus Technical Services Inc, E. Hollister Street, Cincinnati, OH 45219, USA. E-mail: Virkutyte.Jurate@epa.gov
bSustainable Technology Division, National Risk Management Research Laboratory, U.S. Environmental Protection Agency, MS 443, 26 West M. L. K. Drive, Cincinnati, Ohio 45268, USA. E-mail: Varma.Rajender@epa.gov
First published on 28th February 2012
Abstract
Montmorillonite clay (K10) was used as a precursor for the synthesis of a catalytic adsorbent, Claycunbic (Bi/Cu-pillared K10), which was characterized by SEM (EDS), TEM, XRD, BET, TGA and XPS analysis. The catalytic adsorption of cationic dye methylene blue (MB), anionic dye methyl orange (MO) and halogenated aromatic dichlorophenol (DCP) was assessed through multivariate experimental design. The adsorption kinetics was interpreted using pseudo-first order kinetics and an intra-particle diffusion model. It was found that the highest MB, MO and DCP removal efficiency was achieved with 0.5 mL and 1 mL hydrogen peroxide and 1 mg L−1 catalyst doses, respectively. Decrease in 95, 40 and 75% of TOC was observed for MB, MO and DCP, respectively. Bacterial (Vibrio fischeri) bioluminescence inhibition assay showed that inhibition of growth increased from 20 to 100%, with an increase in Claycunbic concentration from 10 to 2000 mg L−1 indicating applicability not only for the removal of organic but bacterial contamination as well. Claycunbic exhibited excellent stability up to 5 consecutive runs in terms of degradation of MB (100–88%) and regained nearly 100% catalytic activity after intermediate calcination at 400 °C for 2 h.
1. Introduction
Various physicochemical and biological methods are currently available to eliminate chemical and microbial contamination from water and wastewater. Among these approaches, the use of modified clays for catalytic sorption has gained an increased attention because they are less expensive than other sorbents such as activated carbon and may be prepared using facile protocols and benign precursors.1 It has also been reported that unmodified montmorillonite could adsorb microbial organisms such as Escherichia coli and Staphylococcus aureus; however, it did not exhibit any bacteriostatic or bactericidal effect.2 Cu-pillared montmorillonites have frequently been used as catalysts in various organic transformation reactions or as efficient adsorbents of small molecules3 and have demonstrated antibactericidal activity on E. coli, Clostridium and Salmonella.4,5 On the other hand, bismuth is a safe, inexpensive, easy to handle, non-toxic and non-carcinogenic metal that is widely used in medicinal preparations and as a catalyst for various organic transformations.2,6,7 Consequently, the combination of these two metals and montmorillonite may prove to be the winning combination for the degradation of organic pollutants and simultaneous elimination of microbial contamination.Most of the studies that deal with the degradation of contaminants use a traditional “trial and error” (TE) approach that separately examines various experimental parameters.8 Although this approach has been used for many years, it is costly in terms of analysis time and reagents and is not always precise. Currently, chemometric methods that are based on the statistical design of experiments (DOEs) are increasingly becoming acceptable in the scientific community. Response surface methodology (RSM) is a statistical tool for the design, empirical modelling, optimization of processes and their performance as well as formulation of new products, where the responses of interest are influenced by various process variables, so-called factors.9
This study aimed at finding an efficient and stable solid composite that could be manufactured in an eco-friendly manner for the catalytic adsorption of target molecules and inhibition of bacterial (V. fischeri) growth utilizing benign precursors incorporated in/onto montmorillonite (K10) framework. Optimization of the catalytic adsorption process was performed with Fractional Factorial design (FFD). To broaden the scope of exploitation, Claycunbic has been used to adsorb and catalytically degrade representative cationic Methylene Blue (MB), anionic Methyl Orange (MO) and aromatic un-charged Dichlorophenol (DCP). To investigate the antibacterial properties of Claycunbic, V. fischeri was subjected to the treatment with various catalytic adsorbent concentrations. Stability and potential recyclability of the catalytic adsorbent was also assessed.
2. Experimental section
2.1. Materials
Montmorillonite clay K10 with main chemical composition of SiO2 (69%), Al2O3 (14.6%), Fe2O3 (2.9%), MgO (2%) and CaO (1.5%), cation exchange capacity (CEC) of 30 meq 100 g−1 and the surface area of 220–270 m2 g−1 was obtained from Sigma-Aldrich (USA). BiCl3, Cu(NO3)2, Na2CO3, methylene blue (MB, analytical grade), methyl orange (MO, analytical grade) and dichlorophenol (DCP) were acquired from Fischer Scientific (USA) and used without further purification. Deionized water was used for the preparation of all the slurries and solutions.2.2. Synthesis
Claycunbic was prepared by slurring montmorillonite (K10) (10 g), dried at 80 °C overnight with 15 g (dissolved in 60 mL of deionized water) of each of BiCl3 and Cu(NO3)2, respectively. Detailed description of Claycunbic preparation and recycling can be found in Supporting Information† section.2.3. Characterization of the catalytic adsorbent
The X-ray diffraction (XRD) patterns of as-prepared Claycunbic and commercially available montmorillonite K10 samples were recorded on an X'Pert Pro MPD X-ray diffractometer with a Cu-Kα source and diffraction angle range of 2θ = 10–80°. The phases were identified by using Joint Committee on Powder Diffraction Standards (JCPDS). The thermogravimetric analysis (TGA) was executed with TGA Q5000 (TA instruments, USA) analyzer with a heating rate of 10° min−1 in an air flow adopting a ramp method with an increase in temperature from 100 to 800 °C. The morphology of samples was evaluated using scanning electron microscopy (FEI XL 30 ESEM), operating at 5–15 kV on grid-deposited samples. Transmission electron microscopic (TEM) images were recorded using FEI CM20 TEM operating at an accelerated voltage of 80–100 keV. The surface area measurements were carried out in a Micrometrics single point BET instrument (Micrometrics Instruments, Norcross, GA, USA). X-ray photoelectron spectroscopy (XPS) was performed using Surface Science Labs SSX-100 XPS. A more detailed description of the method was included into the Supporting Information† section.2.4. V. fischeri bioluminescence inhibition test
Inhibition of the bacterial growth was measured with Microtox toxicity test (EBPI, Canada) according to the ISO standard.10 More details on bioluminescence inhibition test are in the Supporting Information† section.2.5. Experimental design and process optimization
In the current study, the degradation of a probe molecule—MB over Claycunbic in the presence of hydrogen peroxide—was optimized with response surface methodology (RSM) applying fractional factorial design (FFD) by STATISTICA (Version 7.0, StatSoft, USA). Details are available in Supporting Information† section.2.6. Adsorption and catalytic activity
MB, MO and DCP solutions (100 mg L−1) were prepared by dissolving the appropriate amounts of the target contaminants in deionized water to reach the required initial concentration. The batch adsorption experiments were carried out in a 100 mL closed glass containers where 0.05 g of the catalyst (concentration of 1 g L−1) and 50 mL of the target contaminant was added. The typical catalytic activity was tested at room temperature (25 ± 1 °C) in a 100 mL glass flask. Additional details are available in Supporting Information† section. Changes in TOC were monitored on Shimadzu TOC V CPH for Non-Purgeable Organic Carbon analyzer.3. Results and discussion
3.1. Characterization
Pillaring of clays produced an open structure, which made it more accessible to adsorbate molecules.11 The specific surface area of un-calcined Claycunbic was 322 m2 g−1, due to the formation of micropores and spacing between the silicate layers.1 Nevertheless, after calcination it reduced to 115.2 m2 g−1 due to the temperature effect. However, calcined Claycunbic had a pore volume of 0.224 cm3 g−1 (average pore diameter of 3.89 nm), which was nearly three-times larger in comparison to the original clay (K10) of 0.083 cm3 g−1.12XRD was employed to identify the crystal structure and phase purity of Claycunbic in comparison to the parent material (Fig. 1). Accordingly, BiCl3 and Cu(NO3)2 acted as pillars in the interlayer of montmorillonite thus resulting in the enlargement of the basal spacing. Montmorillonite exhibited strong peaks at 26.5°, 38.3°, 45.4° and 53.9°.13,14 The strongest XRD peaks at 25.6, 33.4, 32.5° and 53.9 were assigned to tetragonal primitive crystal structure of fluffy dandelion shaped BiOCl6,15,16 with cell constants a = 3.875 Å, c = 7.382 Å, (JCPDS 85-0861, a = 3.890 Å, c = 7.370 Å) and 34.5°, which was attributed to Bi2O3. There were no peaks corresponding to those of BiCl3. In addition, copper showed a strong peak at 11.7°.
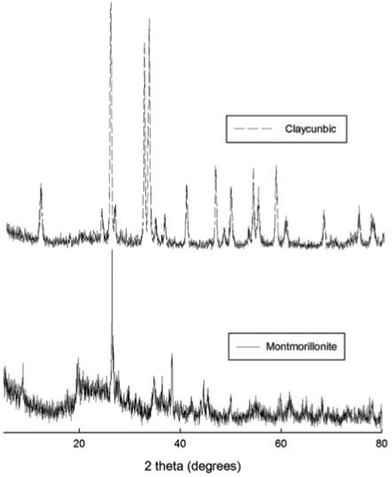 | ||
| Fig. 1 XRD pattern of original un-modified montmorillonite clay (K10) and Claycunbic after calcination. | ||
3.2. Thermogravimetric analysis
Thermogravimetric analysis curves for original un-modified montmorillonite (K10) and Claycunbic are presented in Figure SI1†. The weight loss for both specimens occurred in two steps. The first significant weight loss was observed over the temperature range of 100–350 °C and was attributed to the removal of physisorbed water on the clay surface.17 The second step was observed between 350–800 °C due to dehydroxylation of hydroxide groups associated with interlayer pillars of clay.17,183.3. Surface morphology
The SEM with EDS and TEM micrograms of Claycunbic are shown in Fig. 2. The catalytic adsorbent consisted of irregular flaky crystals with fluffy appearance revealing its fine platy structure with random orientation.1 The chemical analysis utilizing semi-quantitative EDS data is presented in Fig. 2b.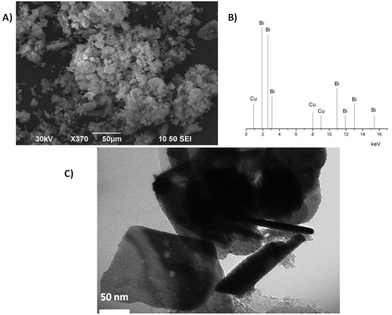 | ||
| Fig. 2 a) SEM microgram, b) semi-quantitative EDS data and c) TEM micrograms of Claycunbic after calcination. | ||
Pillaring showed a peak around 1.8 and 10.8 keV, which was attributed to Bi and 0.8 and 8 keV, which was assigned to Cu pillared on montmorillonite. Atomic composition of Claycunbic mainly constituted of C K (13.70%), O K (59.75%). Si K (14.34%), Fe K (0.38%), Al K (2.27%), Cu K (0.56%), Bi K (4.51%) and insignificant amounts of other trace elements. A porous structure can be seen in the TEM image, which also depicts some agglomeration of Bi and Cu on montmorillonite particles (Fig. 2c). Such a porous and fluffy appearance is most likely due to the change in the surface charge of the clay particles as a result of pillaring.19
3.4. XPS analysis
X-ray photoelectron spectra for Claycunbic were recorded to further confirm the valence state of bismuth in the sample. Fig. 3 shows the low resolution XPS graph. The XPS analysis indicated that the sample consisted of bismuth, oxygen, carbon, silica, aluminum and chloride elements. Atomic concentrations of Claycunbic obtained by using XPS are also shown in Table SI1†. The O (1s), Si (2p) and C (1s) binding energies of Claycunbic were 531, 101.9 and 283.2 eV, respectively, which was in a good agreement with reported values of 531.4, 102.2 and 285.0 eV, respectively.20 Moreover, in Fig. 3, the peaks at 162.8 eV and 157.2 eV, corresponded to the binding energies of Bi 4f5/2 and Bi 4f7/2, respectively, which indicated that the main chemical states of bismuth were trivalence.21 Also, the Cl 2p peak was assigned to Cl 2p1/2 (at 197.5 eV), which confirmed the formation of BiOCl,22 which in turn supported aforementioned XRD observations. High resolution graphs for each region can be seen in Figure SI2 in the Supporting Information†. However, no copper was found on the surface of Claycunbic, supporting the assumption that most of bismuth remained on the surface, whereas copper was incorporated into the K10 lattice.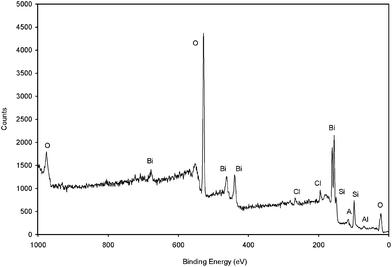 | ||
| Fig. 3 “Fingerprint” XPS spectrum of Claycunbic after calcination. | ||
3.5. Adsorption kinetics
The chemical structures of MB, MO and DCP are shown in Fig. SI3†. The decentralized positive charge on the organic framework of MB molecule keeps the dye on the surface of the clay23 and therefore it is expected that the adsorption of MB onto the catalyst will nearly be instantaneous in comparison to anionic dye MO and aromatic molecule DCP. The amount of DCP, MO and MB adsorbed on the catalytic adsorbent with time is shown in Fig. 4. The curve indicated that adsorption of MB was rapid during the first minutes, whereas adsorption of MO and DCP was less pronounced and the equilibrium was reached in 240 min, 200 min and 30 min for DCP, MO and MB, respectively.![The effect of the contact time on the adsorption of MB, MO and DCP onto Claycunbic (the values of k were determined from the slope of the linear plot of log10 [Ce/C–Ct] vs. t and given as inset).](/image/article/2012/RA/c2ra01088g/c2ra01088g-f4.gif) | ||
| Fig. 4 The effect of the contact time on the adsorption of MB, MO and DCP onto Claycunbic (the values of k were determined from the slope of the linear plot of log10 [Ce/C–Ct] vs. t and given as inset). | ||
To get a more profound understanding of the process, MB adsorption mechanism was explained and results were compared to the adsorption of anionic dye MO and aromatic molecule DCP onto Claycunbic. Initially, MB molecules overcame a rapid adsorption on the montmorillonite particles via ion-exchange and possible aggregation on the external surfaces of the tactoids so that the concentration of the contaminant increased, thus inducing the formation of dimers.24 Such behavior resulted in the intense absorption bands at ∼605 nm (H-dimers) and ∼665 nm (H-monomer) (Figure SI4†) at the beginning of the process.25 H-aggregates induced electrostatic repulsion of dipoles, which increased excitation energy compared to that of the monomers, therefore translating into lower wavelengths.26 Consequently, target molecule migrated from the external surface to the inter-lamellar region, resulting in the de-aggregation of the dimers and restoring the monomer.27 Therefore, absorption at ∼665 nm dominated, which corresponded to the adsorption of monomers.25,27 Accordingly, the rate of MB adsorption onto catalytic adsorbent decreased with time due to the dimerization, aggregation and de-aggregation processes.24
The adsorption data were fitted with Langmuir adsorption rate equation:24
 | (1) |
where Ce (mg g−1) was the equilibrium amount of a target contaminant on the unit mass of the adsorbent, Ct (mg g−1) was the adsorbate amount at time28t which was the adsorption time28 and k was the adsorptive rate constant. The values of k were determined from the slope of the linear plot of log10 [Ce/C–Ct] vs. t and given in Fig. 4 as inset.
The values of k were 2.4 × 10⁻² min−1, 2.1 × 10⁻² min−1 and 2.2 × 10⁻² min−1 for MB, MO and DCP, respectively. As the equilibrium was reached in 30 min to 4 h, it was assumed that MB adsorption was kinetics controlled, whereas MO and DCP adsorption was both, kinetics and diffusion controlled with kinetics being the predominant one.29 Therefore, to identify the exact adsorption mechanism, it is important to take into account intra-particle diffusion, which is characterized by the dependence between the sorption capacities at any given reaction time (Qt) and the square root of time and usually occurs on a porous adsorbent:
| Qt = kid × t1/2 + C | (2) |
The slope of the relationship is the intra-particle diffusion rate and the intercept is C. Figure SI5† shows the sorption capacity vs. the square root of time for MB, MO and DCP adsorption onto as-prepared Claycunbic. Intra-particle diffusion model parameters are presented in Table SI2† (kid (mg g−1 min−1/2, C (mg g−1), R2). According to Figure SI5†, the relationship yielded a straight line passing though the origin for MO indicating that the intra-particle diffusion was the rate limiting step.29,30 Whereas in the case of MB and DCP, the linear portions of the curves did not pass through the origin, indicating some degree of boundary layer control and that other process than intra-particle diffusion might control the rate of the adsorption process.1,22,31
3.6. Design of experiments (RSM)
Table SI3† shows experimental and coded values of low, medium and high level of variables. The classical fractional factorial design (23) was used to investigate the interaction of contaminant degradation process factors, e.g. catalyst and oxidant amount based on polynomial models. To explain and optimize catalytic degradation of MB, which was chosen as the probe molecule in terms of process optimization, the following second-order polynomial equation with coded values was established by applying multiple regression analysis on the design matrix (Table SI4†):| Y = −38.5x1 + 22.2x12 + 216.5x2 − 52.6x22 + 3.3x1x2 − 70.2 | (3) |
The optimum values of x1 and x2 were obtained by solving eqn (3) and by analyzing the response surface contour plots. Table 1 shows ANOVA results of the quadratic model. The Prob > F less than 0.05 indicate that the model terms are significant (linear and quadratic terms of the catalyst amount), whereas values above 0.1 are insignificant.32
| Factor | Sum of Squares (SS) | Degrees of Freedom (dF) | Mean of Square (MS) | F-ratio | Prob > F |
|---|---|---|---|---|---|
| a [R2 = 0.981; R2adj = 0.948; MS residual = 83.307]. | |||||
| (1) H2O2 (L) | 75.05 | 1 | 75.05 | 0.9 | 0.4 |
| H2O2 (Q) | 39.34 | 1 | 39.34 | 0.5 | 0.5 |
| (2) Catalyst amount (L) | 10![[thin space (1/6-em)]](https://www.rsc.org/images/entities/char_2009.gif) 937.78 937.78 |
1 | 10![[thin space (1/6-em)]](https://www.rsc.org/images/entities/char_2009.gif) 937.78 937.78 |
131.3 | < 0.0001 |
| Catalyst amount (Q) | 4940.64 | 1 | 4940.64 | 59.3 | < 0.0001 |
| 1L by 2L | 15.41 | 1 | 15.41 | 0.18 | 0.7 |
| Error | 249.9 | 3 | 83.31 | ||
| Total SS | 12![[thin space (1/6-em)]](https://www.rsc.org/images/entities/char_2009.gif) 774 774 |
8 | |||
The predicted vs. experimental MB degradation plot is depicted in Figure SI6†. The contour plot schematized in Fig. 5 indicated that the MB removal efficiency increased with the addition of the catalyst regardless the hydrogen peroxide dosage.
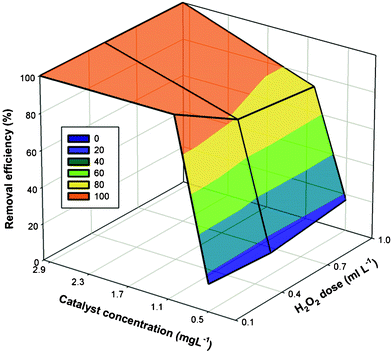 | ||
| Fig. 5 The 3D response surface of MB removal efficiency (%) as a function of catalyst concentration (mg L−1) and H2O2 dose (mL). | ||
For instance, low (12–17%) MB degradation efficiencies were observed at all levels of hydrogen peroxide when the Claycunbic dose was the lowest (0.5 g L−1). However, an increase in the catalyst dose from 0.5 g L−1 to 1 g L−1, resulted in nearly seven- or even ten-fold increase in MB degradation efficiency (Figure SI7†). Subsequently, further increase in the catalyst amount was only significant for medium (0.5 mL) and high (1 mL) level of hydrogen peroxide resulting in a complete removal of MB from the aqueous solution.
The standardized effects of the independent variables (x1 and x2) and their interactions on the response of the system were determined by Pareto chart (Figure SI8†). A reference line indicated that those factors that extended past this line were potentially important.33 Thus, catalyst amount linear and quadratic terms were the most significant in predicting the efficiency of MB degradation, which was also consistent with ANOVA results. The reason for the catalyst amount being the most significant term is that adequate formation of hydroxyl radicals that are responsible for the degradation of MB depends on sufficient surface area and active sites rather than the amount of the oxidizing agents.34 For instance, when degradation experiments were performed in the absence of the catalyst with various amounts of hydrogen peroxide, complete disappearance of MB was achieved in 50 min, which was the same as in the case of pure adsorption, thus indicating that no adequate formation of radicals was achieved. However, when an optimized Claycunbic concentration (1 g L−1) was used, a complete degradation of MB was achieved in 10 min, which could be attributed to the formation of radicals.35 In addition, the disappearance of MB followed first order reaction kinetics and the reaction rate constants were 0.47 min−1, 0.03 min−1 and 0.037 min−1 for 0.1 mL, 0.5 mL and 1 mL of hydrogen peroxide, respectively.
3.7. Degradation of MO and DCP at optimized conditions
The degradation of MO and DCP at the optimized catalytic adsorbent dose (1 g L−1) and various hydrogen peroxide concentrations are shown in Fig. 6. It was found that disappearance of MO increased with an increase in hydrogen peroxide dose; however, degradation of DCP did not follow a well defined pattern. For instance, the most effective destruction of MO was achieved with 1 mL, lesser degradation efficiency was attained with 0.5 mL addition of hydrogen peroxide (Fig. 6a). Additionally, disappearance of DCP was most pronounced when the hydrogen peroxide dose was 0.5 mL and the trend was nearly identical when the dose was 0.1 mL or 1 mL (Fig. 6b). Degradation of both MO and DCP followed first order reaction kinetics with kinetic constants of 1.3 × 10⁻³ min−1, 3.3 × 10⁻³ min−1, 3.6 × 10⁻³ min−1, and 3.1 × 10⁻³ min−1, 4.5 × 10⁻³ min−1 and 2.9 × 10⁻³ min−1 for 0.1 mL, 0.5 mL and 1 mL of hydrogen peroxide, respectively (Fig. 6a and b insets). The TOC of the reaction solution reduced from 40% (MO) to 75% (DCP), indicating that significant mineralization was achieved in the presence of Claycunbic at optimized reaction conditions.![The effect of the contact time on degradation of a) MO and b) DCP in the presence of optimized Claycunbic concentration (1 g L−1) and various H2O2 doses (the values of kd were determined from the slope of the linear plot of ln [C0/C] vs. t and given as inset).](/image/article/2012/RA/c2ra01088g/c2ra01088g-f6.gif) | ||
| Fig. 6 The effect of the contact time on degradation of a) MO and b) DCP in the presence of optimized Claycunbic concentration (1 g L−1) and various H2O2 doses (the values of kd were determined from the slope of the linear plot of ln [C0/C] vs. t and given as inset). | ||
3.8. Toxicity measurements
The results indicated that Claycunbic inhibited luminescent activity of V. fischeri in comparison to the original montmorillonite K10 (Figure SI9a†). The inhibition of bacterial growth was the lowest (15.2%) when the lowest concentration (10 mg L−1) of Claycunbic was used. Moreover, the inhibition increased from 15.2% to nearly 100% with an increase in Claycunbic concentration from 10 mg L−1 to 2 g L−1. Importantly, inhibition was more pronounced after 48 h and varied from 20.2 to 100%. Such an increased inhibition may be associated with the modifying agents on the surface of Claycunbic,36 especially bismuth, which is considered as a very effective bactericide and fungicide.37 Moreover, when Claycunbic was recycled and tested against V. fischeri, it was found that antimicrobial activity was diminished only by 5–8% (Figure SI9b†), which indicated the stability and effectiveness of as-prepared Claycunbic that could be used multiple times without a significant loss in activity.3.9. Stability and regeneration
It is of vital importance to ensure the stability of the catalyst or a catalytic adsorbent for practical reasons. Thus, additional experiments were performed to evaluate the potential recyclability of Claycunbic. Fig. 7 shows the performance of the catalytic adsorbent in terms of MB disappearance in 5 consecutive runs in addition to 5 more consecutive runs with the calcined specimen.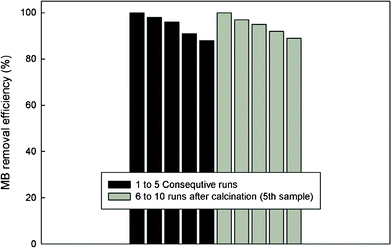 | ||
| Fig. 7 Stability and the effectiveness of Claycunbic at optimized conditions (0.1 mL H2O2; 1 g L−1 Claycunbic, 10 min) to destroy MB (1 to 5 runs were performed with the filtered catalytic adsorbent, whereas 6 to 10 runs were performed with the calcined (400 °C, 2 h) Claycunbic after the 5th run). | ||
In order to recover the catalyst, the effluent after each degradation experiment was filtered, dried overnight at room temperature and used for the subsequent experiment. After the 5th run, Claycunbic was calcined at 400 °C for 2 h and re-used again. It is clear from Fig. 7 that only a slight decrease in the catalytic activity (from 100% to 88%) was observed. Such decay in catalytic activity may be attributed to various effects, specifically to the decrease in the catalyst specific surface area and poisoning of the active sites due to adsorbed organic species.38 Thus, to regain its catalytic activity, Claycunbic sample was subjected to the intermediate calcination after the 5th run. Results showed that recurring calcination can be an effective means to recover catalytic activity from 88% to nearly 100% (Fig. 7) as similarly observed by Centi and colleagues.39
4. Conclusion
A novel catalytic adsorbent—Claycunbic—was developed by a simple and facile, optimized synthesis. Claycunbic demonstrated an increased photocatalytic activity towards the degradation and mineralization of MB, MO and DCP. Also, it demonstrated excellent stability and effectiveness for up to 5 consecutive runs and an additional 5 runs after intermediate calcination. Also, Claycunbic demonstrated outstanding antibacterial properties against V. fischeri, which could be utilized in simultaneous removal of chemical and biological contamination in water and wastewater. This simple approach could easily be adapted to other metal and/or metal oxides pillared clays for various applications including environmental remediation, solar cells, organic transformations and photo-disinfection for self-sterilized surfaces. Moreover, research on determining the mechanism and detailed evaluation of whether pillaring with several metal ions is more beneficial in comparison to the treatment with a single metal ion is currently under way.Acknowledgements
This research was performed at the National Risk Management Research Laboratory of U.S. Environmental Protection Agency (EPA), Cincinnati, Ohio, while J.V. held a National Research Council Research Associateship Award. This paper has not been subjected to internal policy review of the U.S. EPA. Therefore, the research results do not necessarily reflect the views of the agency or its policy. Mention of trade names and commercial products does not constitute endorsement or recommendation for use.References
- Z. Bekçi, Y. Seki and M. Kadir Yurdakoç, J. Mol. Struct., 2007, 827, 67–74 CrossRef.
- A. Dakovic, S. Matijasevic, G. E. Rottinghaus, D. R. Ledoux, P. Butkeraitis and Z. Sekulic, Colloids Surf., B, 2008, 66, 20–25 CrossRef CAS.
- A. Itadani, M. Tanaka, T. Abe, H. Taguchi and M. Nagao, J. Colloid Interface Sci., 2007, 313, 747–750 CrossRef CAS.
- M. S. Xia, C. H. Hu and Z. R. Xu, Anim. Feed Sci. Technol., 2005, 118, 307–317 CrossRef CAS.
- C.-H. Hu and M.-S. Xia, Appl. Clay Sci., 2006, 31, 180–184 CrossRef CAS.
- J. A. R. Salvador and S. M. Silvestre, Tetrahedron Lett., 2005, 46, 2581–2584 CrossRef CAS.
- D. H. Aggen, J. N. Arnold, P. D. Hayes, N. Smoter and R. S. Mohan, Tetrahedron, 2004, 60, 3675–3679 CrossRef CAS.
- V. A. Sakkas, M. A. Islam, C. Stalikas and T. A. Albanis, J. Hazard. Mater., 2010, 175, 33–44 CrossRef CAS.
- D. C. Montgomery and R. H. Myers, Response Surface MethodologyWiley-Interscience, New York, US, 2002 Search PubMed.
- ISO, in: ISO 11348-3, 2007 Search PubMed.
- S. Ouidri and H. Khalaf, J. Photochem. Photobiol., A, 2009, 207, 268–273 CrossRef CAS.
- A. D. Stefanis, A. A. G. Tomlinson, T. A. Steriotis, K. L. Stefanopoulos and U. Keiderling, J. Mater. Chem., 2003, 13, 1145–1148 RSC.
- T. Joseph, G. V. Shanbhag and S. B. Halligudi, J. Mol. Catal. A: Chem., 2005, 236, 139–144 CrossRef CAS.
- R. A. Alvarez-Puebla, C. Aisa, J. Blasco, J. C. Echeverría, B. Mosquera and J. J. Garrido, Appl. Clay Sci., 2004, 25, 103–110 CrossRef CAS.
- Q. Wang, C. Jiang, D. Cao and Q. Chen, Mater. Lett., 2007, 61, 3037–3040 CrossRef CAS.
- Z.-Q. Li, L.-G. Qiu, T. Xu, Y. Wu, W. Wang, Z.-Y. Wu and X. Jiang, Mater. Lett., 2009, 63, 78–80 CrossRef CAS.
- R. R. Tiwari, K. C. Khilar and U. Natarajan, Appl. Clay Sci., 2008, 38, 203–208 CrossRef CAS.
- Z. B. Molu and K. Yurdakoç, Microporous Mesoporous Mater., 2010, 127, 50–60 CrossRef CAS.
- D. M. Manohar, B. F. Noeline and T. S. Anirudhan, Appl. Clay Sci., 2006, 31, 194–206 CrossRef CAS.
- T. Ebina, T. Iwasaki, A. Chatterjee, M. Katagiri and G. D. Stucky, J. Phys. Chem. B, 1997, 101, 1125–1129 CrossRef CAS.
- H. Li, D. Wang, P. Wang, H. Fan and T. Xie, Chem.–Eur. J., 2009, 15, 12521–12527 CrossRef CAS.
- X. Chang, J. Huang, C. Cheng, W. Sha, X. Li, G. Ji, S. Deng and G. Yu, J. Hazard. Mater., 2010, 173, 765–772 CrossRef CAS.
- C. A. P. Almeida, N. A. Debacher, A. J. Downs, L. Cottet and C. A. D. Mello, J. Colloid Interface Sci., 2009, 332, 46–53 CrossRef CAS.
- Y.-L. Ma, Z.-R. Xu, T. Guo and P. You, J. Colloid Interface Sci., 2004, 280, 283–288 CrossRef CAS.
- A. Czímerová, J. Bujdák and R. Dohrmann, Appl. Clay Sci., 2006, 34, 2–13 CrossRef.
- J. Budjak, N. Iyi and T. Fujita, Clay Miner., 2002, 37, 121–133 CrossRef.
- M. G. Neumann, F. Gessner, C. C. Schmitt and R. Sartori, J. Colloid Interface Sci., 2002, 255, 254–259 CrossRef CAS.
- S. Miao, Z. Liu, B. Han, H. Yang, Z. Miao and Z. Sun, J. Colloid Interface Sci., 2006, 301, 116–122 CrossRef CAS.
- S. Venkata Mohan, N. Chandrasekhar Rao and J. Karthikeyan, J. Hazard. Mater., 2002, 90, 189–204 CrossRef CAS.
- L. Krim, S. Nacer and G. Bilango, American Journal of Environmental Sciences, 2006, 2, 27–32 CrossRef.
- B. H. Hameed, Colloids Surf., A, 2007, 307, 45–52 CrossRef CAS.
- B. K. Körbahti and M. A. Rauf, Chem. Eng. J., 2008, 138, 166–171 CrossRef.
- S. V. Srinivasan and D. V. S. Murthy, J. Hazard. Mater., 2009, 165, 909–914 CrossRef CAS.
- V. A. Sakkas, P. Calza, M. A. Islam, C. Medana, C. Baiocchi, K. Panagiotou and T. Albanis, Appl. Catal., B, 2009, 90, 526–534 CrossRef CAS.
- M. Kurian and S. Sugunan, Chem. Eng. J., 2006, 115, 139–146 CrossRef CAS.
- M. Mortimer, K. Kasemets, M. Heinlaan, I. Kurvet and A. Kahru, Toxicol. in Vitro, 2008, 22, 1412–1417 CrossRef CAS.
- D. E. Mahony, S. Lim-Morrison, L. Bryden, G. Faulkner, P. S. Hoffman, L. Agocs, G. G. Briand, N. Burford and H. Maguire, Antimicr. agents chemother., 1999, 43, 582–588 CAS.
- J. H. Ramirez, C. A. Costa, L. M. Madeira, G. Mata, M. A. Vicente, M. L. Rojas-Cervantes, A. J. López-Peinado and R. M. Martín-Aranda, Appl. Catal., B, 2007, 71, 44–56 CrossRef CAS.
- G. Centi, S. Perathoner, T. Torre and M. G. Verduna, Catal. Today, 2000, 55, 61–69 CrossRef CAS.
Footnote |
| † Electronic supplementary information (ESI) available: experimental section, TGA, XPS, chemical structures of MB, MO, DCP, absorption bands, sorption capacity, intra-particle diffusion, experimental matrix with coded parameters, predicted vs. experimental plot, Pareto chart and inhibition of bacterial growth. See DOI: 10.1039/c2ra01088g |
| This journal is © The Royal Society of Chemistry 2012 |
