DOI:
10.1039/C2RA01159J
(Paper)
RSC Adv., 2012,
2, 3458-3466
NaCl-assisted low temperature synthesis of layered Zn-In-S photocatalyst with high visible-light activity for hydrogen evolution
Received
22nd November 2011
, Accepted 22nd January 2012
First published on 29th February 2012
Abstract
Single ZnIn2S4 or Zn-In-S composites were synthesized by a simple low temperature (80 °C) method assisted by the presence of NaCl. The products were characterized by XRD, SEM, TEM, TG/DTA, ICP-AES, BET and UV-Vis absorption spectrometry. The decomposition of thioacetamide (TAA) at low temperature was investigated by UV-Vis absorption spectrometry. The decomposition rate of TAA and NaCl concentration influenced the composition, structure, morphology and grain size of the products. The obtained samples are marigold-like microspheres consisting of nanosheets. Loading 0.10 wt% Pt on the samples by in situ photoreduction, allowed the photocatalytic activity of the prepared samples to be evaluated by hydrogen evolution from aqueous solution containing triethanolamine as the electron donor under visible light (λ ≥ 420 nm) irradiation. The activity of the sample obtained in the presence of 0.50 mol L−1 NaCl is ca. 5 times higher than samples without NaCl. Thus, a photocatalyst with layered structure is beneficial for photoactivity. A possible mechanism is discussed.
Introduction
Visible-light-driven photocatalytic water splitting for hydrogen evolution has attracted considerable attention driven by the need for alternative energy supplies and to conserve the environment.1–15 Much research into ZnIn2S4 has been carried out due to its superior electron and optical properties.16–24 Most research has aimed to synthesize ZnIn2S4 with a particular morphology, such as marigold-like microspheres and nanobelts and nanowires by hydrothermal or solvothermal methods by using organic surfactants or polymers as templates, and to investigate the relationship between preparation parameters and photocatalytic activity. In this work, organic surfactants or polymers tune size and morphology of the final obtained product by coordinating with metal ions or adsorbing to a specific crystal facet.25–28 However, the as-prepared products may be contaminated by surfactants or polymers and their photocatalytic activities would therefore be depressed.29 In fact, inorganic salts can be used as “shape and structure modifiers” to control crystal structure, size and morphology of the products.30,31 Inorganic salts are more soluble in water and cheaper than surfactants or polymers. Thus, inorganic salts as shape and structure modifiers are important in practical applications.
We have prepared Zn-In-S composite microspheres by a NaCl-assisted hydrothermal method.32 We found that NaCl not only controlled the size and shape but also changed the composition of the products. In the absence of NaCl, significant differences were observed between the solubility product constant of In2S3 (ksp =5.7 × 10−74)33 and ZnS (ksp =1.51 × 10⁻²⁴)34 that led to the formation of a composite of In2S3 and ZnS and ZnIn2S4 with lower photoactivity under the hydrothermal conditions. In the presence of NaCl, Cl− ion as a complex agent coordinates with In3+ to decrease the precipitation tendency of In3+. As a result, single ZnIn2S4 product or Zn-In-S composites were obtained. The as-prepared photocatalyst with appropriate NaCl concentration is a single ZnIn2S4 which exhibits very high photoactivity compared to that without NaCl.
ZnIn2S4 was synthesized at temperatures >100 °C by hydrothermal or solvothermal processes in most previous works.16,18,23 In view of practical applications, it is very meaningful that a Zn-In-S photocatalyst with a higher activity could be obtained at low temperature. Fu et al. prepared ZnIn2S4 at 80 °C in aqueous solution, and found that the product showed improved visible-light photocatalytic activity for methyl orange degradation. Inspired by this, we prepared a Zn-In-S composite photocatalyst by a NaCl-assisted process at low temperature (80 °C). Photocatalytic activity for hydrogen evolution of the products was investigated using triethanolamine as the electron donor. Photocatalytic activity of the product obtained with added NaCl was much higher than that without NaCl. It is interesting that the product prepared at low temperature exhibited higher photocatalytic activity for hydrogen evolution than did the sample obtained by hydrothermal methods using a similar NaCl-assisted process. At low temperature, the decomposition rate of thioacetamide (TAA) is relatively slow. Effect of NaCl on the composition, structure, size and shape of the products should be different from those under hydrothermal conditions in our previous work because TAA decomposes rapidly in a hydrothermal system (160 °C). The possible mechanism for this reaction is discussed.
Experimental
Preparation of photocatalysts
Zn-In-S photocatalysts were synthesized at low temperature in aqueous solution by using ZnSO4, In2(SO4)3, thioacetamide (TAA) and NaCl. In a typical process, ZnSO4 (4.0 mmol), In2(SO4)3·6H2O (4 mmol) and excessive TAA (20.0 mmol) were dissolved in 80 mL distilled water in a 250 mL flask, and then the flask was partially sealed with a ground glass stopper and put into a water bath at temperature 80 °C for a given time. After a suspension formed, the solution was cooled to room temperature naturally, and the product was collected by filtration and washed several times with deionized water and absolute ethanol. The final sample was dried at 60 °C for 6 h. The synthesis process of a Zn-In-S photocatalyst in the presence of NaCl was the same as the above process except that a given amount of NaCl was added. The as-prepared product was denoted as ZIS-m, where m represents molar concentration of NaCl in the reaction system.
Characterization
XRD patterns were acquired on a Bede D1 System multifunction X-ray diffractometer, employing Cu Ka (λ = 1.5406 Å) radiation. Voltage and current were 40 kV and 40 mA, respectively. UV-Vis diffuse reflectance absorption spectra and UV absorption spectra were obtained on a Hitachi U-3310 spectrophotometer. The scanning electron microscopy (SEM) images were taken on a Quanta 200F field emission scanning electron microscope working at 20 kV. The transmission electron microscopy (TEM) images were taken on a JEM 2100F field emission transmission electron microscope working at 200 kV. The thermogravimetric and differential thermal analysis (TG-DTA) measurements were carried out on a PE Pyris diamond thermal analyzer at a heating rate of 10 °C min−1 in air atmosphere using α–Al2O3 as the reference. BET specific surface areas were obtained on a 3H-2000BET-M surface analyzer. The contents of metal elements in the filtrates from the above-mentioned preparation process and from the photocatalytic reaction solution were determined by inductively coupled plasma-atomic emission spectra (ICP) on an OPTIMA 5300DV spectrometer. Attenuated total reflectance (ATR) infrared (IR) data were acquired on a Nicolet 5700 spectrometer equipped with a ZnSe crystal horizontal unit. The tested solution was added on to the surface of the ZnSe crystal. Pure water was used as a reference.
Photocatalytic reaction
Each photocatalytic reaction was performed in a 230 mL Pyrex cell with a flat side window for illumination. A 400 W high-pressure Hg lamp was used as the light source with a cutoff filter to remove radiation below 420 nm. 0.100 g of photocatalyst powder was dispersed by ultrasonication for 5 min in an aqueous solution (100 mL) containing 10 mL triethanolamine and 0.26 mL 1.93 × 10⁻³ mol L−1 H2PtCl6, and N2 was bubbled through the reaction mixture for 20 min to remove oxygen. Pt was deposited by in situ photoreduction and its calculated content was 0.10 wt%. Sampling was done intermittently through the septum during experiments. The photocatalytic activity was determined by measuring the amount of hydrogen production on a gas chromatograph (TCD, 13X molecular sieve column, N2 as gas carrier). During the stability experiment, N2 was bubbled through the reaction mixture for 20 min periodically after every reaction run. The apparent quantum yield is defined by eqn (1).| |  | (1) |
The average photon flux of the incident light determined on a FGH-1 ray virtual radiation actinometer (light spectrum: 400–700 nm) was 529 μmol m−2 s−1 (11.5 mW cm−2).
Results and discussion
Effect of metal salts on decomposition of TAA
Fig. 1 shows UV absorption spectra of TAA aqueous solutions after different heat treatment times at 80 °C in the presence or absence of NaCl. All of the tested solutions have two absorption peaks at 209.9 nm and 261.0 nm which were assigned to absorption bands of –NH2 and C![[double bond, length as m-dash]](https://www.rsc.org/images/entities/char_e001.gif) S of TAA, respectively. With increasing heat treatment time, the peak intensities (Fig. 1a) decreased slowly. In the presence of 0.50 mol L−1 NaCl, a decrease in the peak intensities with time does not increase markedly (Fig. 1b). The results indicate that TAA decomposes slowly at 80 °C and NaCl does not obviously prompt the decomposition of TAA.
S of TAA, respectively. With increasing heat treatment time, the peak intensities (Fig. 1a) decreased slowly. In the presence of 0.50 mol L−1 NaCl, a decrease in the peak intensities with time does not increase markedly (Fig. 1b). The results indicate that TAA decomposes slowly at 80 °C and NaCl does not obviously prompt the decomposition of TAA.
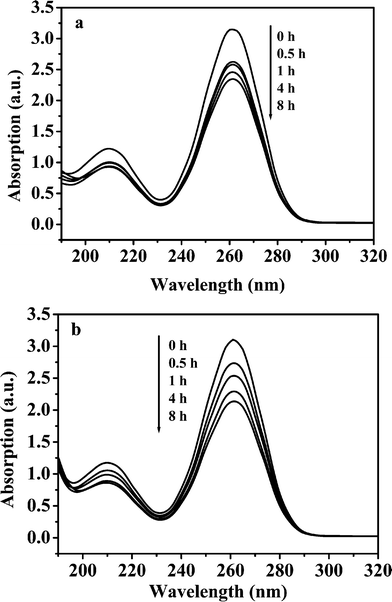 |
| | Fig. 1 UV absorption spectra of 0.25 mol L−1 TAA aqueous solution (dilution 1:1000) after different heat treatment times at 80 °C in the presence or absence of NaCl. (a) Pure water, and (b) 0.50 mol L−1 NaCl. | |
Effect of metal ions (Zn2+ and In3+) on decomposition of TAA was investigated. As shown in Fig. 2, the concentrations of TAA decreased quickly with increased reaction time. Compared with Fig. 1, we concluded that metal ions Zn2+ (Fig. 2a) and In3+ (Fig. 2b) facilitate decomposition of TAA, and the facilitation action of In3+ ion is stronger than that of Zn2+ ion. This is due to that ksp for In2S3 is much smaller than that for ZnS. Although decomposition of TAA in the mixture solution of indium sulfate and zinc sulfate is fastest (Fig. 2c), TAA does not decompose completely after 4 h of reaction. These results show that the decomposition of TAA and precipitation of Zn2+ and In3+ in the reaction system are slow processes and that the precipitation rate of In3+ is faster than that of Zn2+. It has been reported that the decomposition rate of TAA at 90 °C was 2 and 4 times as high as that at 80 °C and 70 °C at pH 1.0, respectively.36 Therefore, the facilitation effect of the metal ions on decomposition of TAA at 80 °C is limited, whereas temperature effect is very remarkable. In our previous work, the hydrothermal reaction was conducted at 160 °C.32 In this case, TAA would decompose rapidly.
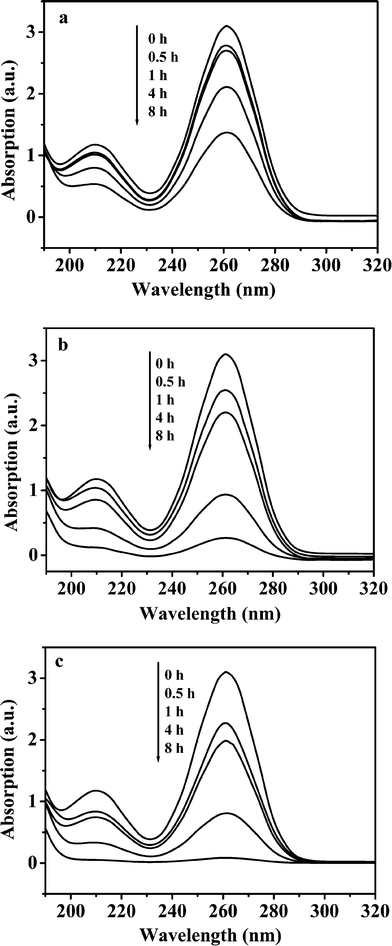 |
| | Fig. 2 Effect of metal ions on decomposition of TAA at 80 °C in the presence of 0.50 mol L−1 NaCl (dilution 1:1000). (a) 0.050 mol L−1 Zn2+; (b) 0.10 mol L−1 In3+; (c) 0.050 mol L−1 Zn2+ + 0.10 mol L−1 In3+. | |
Effect of NaCl on properties of ZIS-m samples
Fig. 3 shows SEM images of the prepared samples with different NaCl concentrations at 80 °C for 4 h. ZIS-0, ZIS-0.50 and ZIS-2.0 exhibit microsphere morphology with a “marigold-like” superstructure. Without NaCl, the sample (ZIS-0) is composed of microspheres comprising of numerous petals with diameter of 1–4 μm (Fig. 3a, 3b). ZIS-0.50 (Fig. 3c) consisted of similar microspheres with diameter of 2–8 μm. Grain size distribution is wider and there are many small grains. The gap between petals in a magnified single microsphere is smaller than that of ZIS-0 (Fig. 3). ZIS-2.0 has a similar size range (Fig. 3e) but the distribution of grain size is narrower compared to ZIS-0.50. The petals of microspheres of ZIS-2.0 are open and puffy (Fig. 3f). Fig. 4 (a–c) shows TEM images of the samples ZIS-0, ZIS-0.50 and ZIS-2.0. All samples display microsphere morphology, and the grain size and distribution accord with SEM results. As shown in Fig. 4d, nanosheets are assembled into fringes of the microspheres of ZIS-0.50. The microspheres of ZIS-0 and ZIS-0.50 show a similar superstructure (not shown).
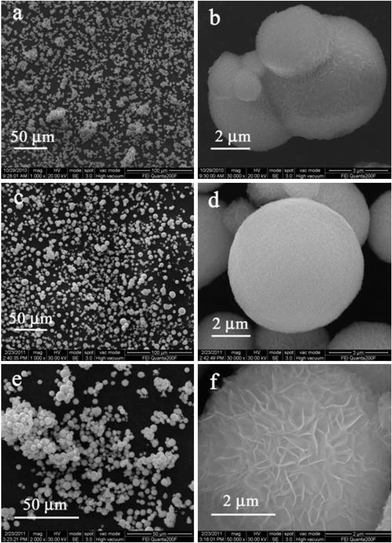 |
| | Fig. 3 SEM images of the samples (a, b) ZIS-0, (c, d) ZIS-0.50, and (e, f) ZIS-2.0. | |
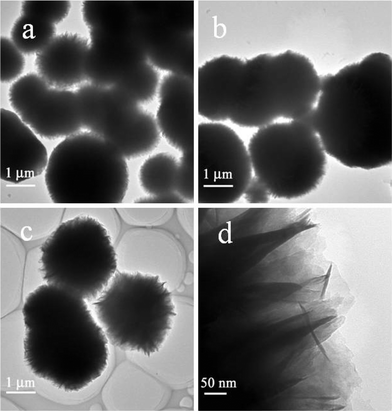 |
| | Fig. 4 TEM images of the samples (a) ZIS-0, (b, d) ZIS-0.50, and (c) ZIS-2.0. | |
As shown in Table 1, the specific surface area of ZIS-m decreases with increased NaCl concentration. This indicates that NaCl increases the grain size of the products, in agreement with the results from Fig. 3 and Fig. 4.
Table 1 Band gap (Eg) and specific surface area of the samples obtained in the presence of different NaCl concentrations
| NaCl concentration (mol L−1) |
0 |
0.10 |
0.20 |
0.50 |
1.0 |
2.0 |
|
E
g (eV) |
2.09 |
2.16 |
2.29 |
2.32 |
2.37 |
2.37 |
| BET (m2 g−1) |
148 |
142 |
104 |
44.2 |
40.7 |
15.4 |
The contents of In3+ and Zn2+ ions in the 4 h reacted filtrate in the presence of the different NaCl concentrations were determined by ICP, and the percentage of In3+ or Zn2+ in the filtrate was calculated (Table 2). The percentage of In3+ increased with the increase in NaCl concentration, but the percentage of Zn2+ decreased at first and was then enhanced. When the NaCl concentration is 0.50 mol L−1, percentage of In3+ is almost equal to that of Zn2+ within experimental error, indicating that in this case the composition of obtained product is in accord with stoichiometric ratio of ZnIn2S4, whereas the composition of the products obtained in other cases (0, 0.10 and 2.0 mol L−1 NaCl) obviously derive from the stoichiometric ratio. The results can be attributed to coordination of Cl− ions (see mechanism section).
Table 2 Percentage of In or Zn ions in the filtrate after 4 h heat treatment in the presence of different NaCl concentrationsa
| NaCl concentration (mol L−1) |
0 |
0.10 |
0.50 |
2.0 |
|
F represents the filtrate and T represents the added total content of metal ions.
|
| InF/InT (at.%) |
0.0450 |
0.949 |
14.3 |
17.8 |
| ZnF/ZnT (at.%) |
25.5 |
15.7 |
16.2 |
42.0 |
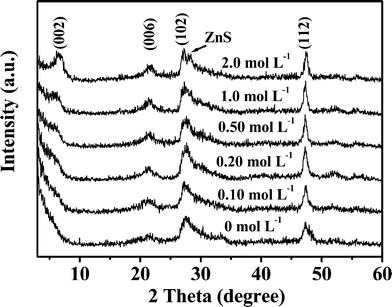
Fig. 5 shows XRD patterns of the products synthesized at 80 °C for 4 h with the different NaCl concentrations. The main diffraction peaks of the products could be attributed to the hexagonal phase of ZnIn2S4 (JCPDS Card No. 65-2023, a = 3.85 Å and c = 24.68 Å). When the NaCl concentration is below 0.10 mol L−1, the diffraction peak (002) crystal facet of the products was not present. However, when above 0.20 mol L−1, a diffraction peak occurs, and the diffraction intensity increases with increased NaCl concentration. ZnIn2S4 is a compound with layered crystal structure, in which the stacking of atoms along the c-axis is a repeated sequence of S-Zn-S-In-S-In-S.37 Addition of NaCl decreased the reaction rate so that the stacking of atoms along the c-axis is preferential. So, for the samples prepared with high NaCl concentration, the diffraction intensities (002) and (006) facets are enhanced. When the NaCl concentration is 2.0 mol L−1, a new peak at 28.4° appears which can be indexed to the cubic ZnS (JCPDS card No. 65-0309). This confirms that the product is a composite.
 |
| | Fig. 5 XRD patterns of the obtained products in the presence of different NaCl concentrations. | |
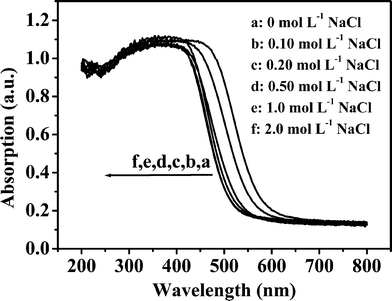
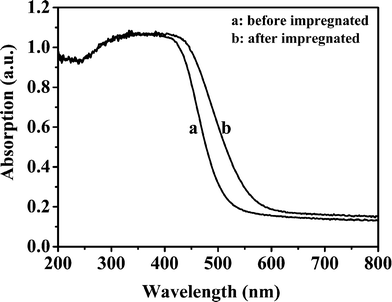
Fig. 6 shows UV-Vis diffuse reflectance absorption spectra of the products obtained in the presence of different NaCl concentrations. All the samples have steep absorption in the visible light range of 400 and 550 nm, and the steep absorption of the curves suggests that the absorptions are relevant to the band gap due to the intrinsic transition of the materials rather than the transition from impurity levels.38 Compared to the product obtained in the absence of NaCl, the band edges of the prepared samples in the presence of NaCl shift to shorter wavelength with increased NaCl concentration. When NaCl concentrations are 1.0 and 2.0 mol L−1, the absorption curves of the prepared samples almost coincide. The band gaps of the samples calculated from onset of the absorption curves are shown in the Table 1. In the absence of NaCl in the reaction system, the band gap of the obtained product is in agreement with that of In2S3 (2.07 eV),39 which indicates that the product contains a considerable amount of In2S3. When the NaCl concentration is above 0.20 mol L−1, the band gaps of the products are close to that of ZnIn2S4 (2.30 eV).19 It has been reported that the absorption edge of a composite of In-Zn-S solid solution with In2S3 is shifted toward shorter wavelength with decreased In2S3 content.40 Therefore, the experimental results suggest that In2S3 content of the products prepared with higher NaCl concentrations reduces. Based on the results from XRD patterns (Fig. 5) and Table 2, we could conclude that there are ZnS and In2S3 phases for the product obtained with 2.0 mol L−1 NaCl. However, In2S3 cannot be detected by the absorption spectrum, which will be due to incident depth of light being smaller than the thickness of the outer ZnIn2S4. In order to prove the inference, we impregnated 0.20 g ZIS-2.0 sample in 20 mL 0.050 mol L−1 HCl solution for 1 h. As shown in Fig. 7, the absorption edge of the acid-treated sample (ZIS-2.0) shifts to longer wavelength and its band gap is 2.13 eV which is close to that of In2S3. Therefore, the interior of the sample ZIS-2.0 should contain In2S3.
 |
| | Fig. 6 UV-Vis diffuse reflectance absorption spectra of the products obtained in the presence of different NaCl concentrations. | |
 |
| | Fig. 7 UV-Vis diffuse reflectance absorption spectra of the products ZIS-2.0 before and after impregnation with 20 mL 0.050 mol L−1 HCl solution. | |
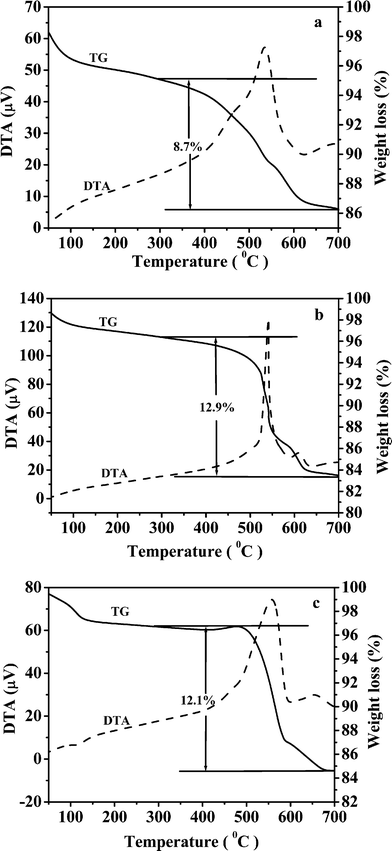
Fig. 8 shows TG/DTA curves of the samples ZIS-0, ZIS-0.50 and ZIS-2.0. ZnIn2S4 undergoes oxidation in the range 300–700 °C.41 The weight loss of ZIS-0, ZIS-0.50 and ZIS-2.0 in this region are 8.7%, 12.9% and 12.1%, respectively. The DTA curves of the samples In2S3 and ZnS show that the oxidation peaks occur at 495 and 660 °C (not shown), respectively, indicating that In2S3 can be oxidized at a lower temperature than ZnS. Fig. 8a shows that a remarkable shoulder peak appears at ca. 490 °C which can be attributed to oxidation of In2S3 contained in the ZIS-0. The peak also occurs in Fig. 8c for ZIS-2.0, but it is weaker than that in Fig. 8a. However, the peak is not visible in Fig. 8b (ZIS-0.50). These results suggest that ZIS-0 and ZIS-2.0 contain In2S3, but ZIS-0.50 does not. The oxidation peaks appear at 535 (Fig. 8a) and 540 °C (Fig. 8b) and can be assigned to oxidation of ZnIn2S4. However, peak shifts to 558 °C for ZIS-2.0 (Fig. 8c), are due to ZnS in ZnIn2S4.
 |
| | Fig. 8 TGA/DTA curves of samples (a) ZIS-0, (b) ZIS-0.50, and (c) ZIS-2.0. | |
In summary, ZIS-0 prepared without NaCl is a composite of ZnIn2S4, ZnS and In2S3. ZIS-0.50 is composed of single ZnIn2S4. When the NaCl concentration is higher or lower, ZIS-m becomes a composite again but the composition is closer to the stoichiometric ratio of ZnIn2S4 than of ZIS-0.
Photocatalytic performance of ZIS-m samples
Fig. 9 shows the effect of NaCl concentration on the photocatalytic activity of ZIS-m for hydrogen evolution from aqueous triethanolamine solution under visible light irradiation (λ ≥ 420 nm). ZIS-m samples were loaded with 0.10 wt% (theoretical content) Pt by in situ photoreduction. The photocatalytic activities of 0.10 wt% Pt/ZIS-m samples increased with increasing NaCl concentration to a maximum of 0.50 mol L−1 NaCl, beyond which the activities decreased. The H2 produced from ZIS-0 for 2 h irradiation is 45.8 μmol, whereas that of ZIS-0.50 is 211.2 μmol. The latter is ca. 5 times as higher than the former. This result demonstrates that adding NaCl at proper concentration in the preparation system can greatly improve photoactivity of the prepared photocatalyst. The apparent quantum yield of ZIS-0.50 is 6.47%. The yield of ZIS-0.50 prepared by the hydrothermal method at 160 °C in our previous work32 is 4.69% under the same irradiation condition. Higher apparent quantum yield for the sample prepared at low temperature can be attributed to slow growth of ZnIn2S4 to increased sequential stacking of atoms along the c-axis.
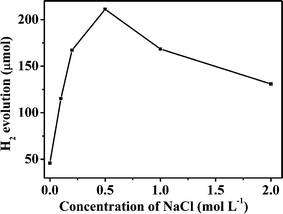 |
| | Fig. 9 Amount of photocatalytic hydrogen production over 0.10 wt% Pt/ZIS-m (m = 0, 0.10, 0.20, 0.50, 1.0 and 2.0) for 2 h irradiation. | |
Our previous work demonstrated that the In2S3 phase in Zn-In-S composites decreased the photocatalytic activity of Zn-In-S composites for hydrogen evolution.32 In2S3 has a lower conduction band position and a higher valence band position than that of ZnIn2S4. Lower conduction band position of In2S3 decreases hydrogen production, whereas the higher valence band position of In2S3 decreases oxidization of triethanolamine by the hole, leading to increasing recombination of photoinduced electrons and holes. Although ZIS-0 has the largest specific surface area (Table 1), its activity for hydrogen evolution is the lowest due to presence of considerable amounts of In2S3 (Fig. 6, Fig. 8 and Table 2). ZIS-0.50 is composed of ZnIn2S4, and thus displays the highest photoactivity. ZIS-2.0 which contains only a little In2S3 and which has the smallest specific surface area exhibits higher photocatalytic activity for hydrogen evolution than ZIS-0 and ZIS-0.10. The reason for this could be related to the crystal structure of ZIS-2.0. According to the XRD patterns (Fig. 5), diffraction peak intensity (002) facet of ZIS-2.0 is the strongest, namely a highly sequential stacking of atoms along the c-axis. The structure can separate photoinduced hole-electron pair effectively and therefore enhance photocatalytic activity.42 This result differs from our previous work in which the samples were prepared by a hydrothermal method at 160 °C. The photoactivity of ZIS-2.0 prepared by the hydrothermal method is close to that of ZIS-0.
Fig. 10 shows the time course of photocatalytic hydrogen evolution from triethanolamine over 0.10 wt% Pt/ZIS-0.50 under visible light irradiation (λ ≥ 420 nm). Four irradiation runs were carried out. The amount of produced H2 is 493.3 μmol in the first run. H2 is stably produced over three runs, within experimental error, illustrating that the ZIS-0.50 is a stable photocatalyst. Metal elements Zn and In in the reaction solution, 0.10 wt% Pt/ZIS-0.50 after each run were measured by ICP. The amounts of both Zn and In in the solution after the first run were below 0.30 wt% and the values did not increase markedly with increased irradiation time (below 0.35 wt% after the fourth run), further suggesting that ZIS-0.50 is a stable photocatalyst.
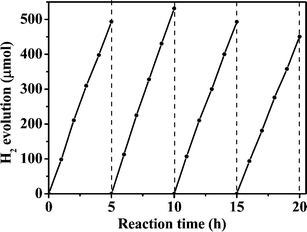 |
| | Fig. 10 Time course of photocatalytic hydrogen evolution over 0.10 wt% Pt/ZIS-0.50. | |
Mechanism
It was reported that in aqueous solution, Zn2+ and In3+ with TAA could form coordination ions.23,25 ATR IR analysis (Table 3) shows that the absorption peak of C![[double bond, length as m-dash]](https://www.rsc.org/images/entities/char_e001.gif) S of TAA in aqueous solution occurs at ca. 1308 cm−1. When Zn2+ and In3+ ions are added into the TAA solution, respectively, shift of the absorption band of C
S of TAA in aqueous solution occurs at ca. 1308 cm−1. When Zn2+ and In3+ ions are added into the TAA solution, respectively, shift of the absorption band of C![[double bond, length as m-dash]](https://www.rsc.org/images/entities/char_e001.gif) S in TAA solution is below 1.0 cm−1. Presence of NaCl does not affect the absorption band. The results indicate that the coordination of Zn2+ and In3+ with TAA is very weak under our experimental conditions, and that Zn2+ and In3+ mainly exist as hydrated ions.
S in TAA solution is below 1.0 cm−1. Presence of NaCl does not affect the absorption band. The results indicate that the coordination of Zn2+ and In3+ with TAA is very weak under our experimental conditions, and that Zn2+ and In3+ mainly exist as hydrated ions.
Table 3 Wavenumbers of absorption maxima in infrared spectra of C![[double bond, length as m-dash]](https://www.rsc.org/images/entities/char_e001.gif) S of TAA in different solutions
S of TAA in different solutions
| Tested solution |
Wavenumbers of C![[double bond, length as m-dash]](https://www.rsc.org/images/entities/char_e001.gif) S of TAA (cm−1) S of TAA (cm−1) |
| 0.25 mol L−1 TAA |
1308.4 |
| 0.05 mol L−1 ZnSO4 + 0.25 mol L−1TAA |
1308.8 |
| 0.05 mol L−1 In2(SO4)3 + 0.25 mol L−1 TAA |
1307.8 |
| 0.25 mol L−1 TAA + 0.50 mol L−1NaCl |
1308.1 |
| 0.05 mol L−1 ZnSO4 +0.25 mol L−1 TAA + 0.50 mol L−1NaCl |
1307.9 |
| 0.05 mol L−1 In2(SO4)3 + 0.25 mol L−1 TAA + 0.50 mol L−1NaCl |
1307.5 |
Because we cannot obtain solubility products of ZnS and In2S3 at various temperatures from the reported literature and experimental measurement is difficult, we calculated them by ion entropy correspondence principles.43 The obtained solubility products of ZnS and In2S3 are 1.78 × 10⁻²² and 1.48 × 10−66 at 80 °C, and 5.01 × 10⁻¹⁹ and 5.37 × 10−57 at 160 °C, respectively, larger than the corresponding values at room temperature. At 80 °C, the pressure of the reaction system is constant (atmospheric pressure) and the calculated values of the solubility products should be close to their true values, whereas the calculated values at 160 °C deviate from the true values to some extent due to the effect of pressure (much larger than atmospheric pressure).
The hydrolysis rate of TAA to H2S is slow at 80 °C (Fig. 1 and Fig. 2) (eqn (2)). Thus, H2S concentration in the reaction system is low, which leads to smaller ionic products to precipitate the two metal sulfides. In the absence of NaCl, at the initial reaction stage, due to significant differences between the solubility product constant of In2S3 (ksp = 1.48 × 10−66) and that of ZnS (ksp = 1.78 × 10⁻²²), a part of In3+ ions reacted, at first, with H2S to form the In2S3 crystal nuclei and then grew further into In2S3 crystals (eqn (3)). Because In2S3 growth leads to decreased In3+ ion concentration, supersaturation of In2S3 decreased, and the relative precipitation rate for Zn2+ increased. As a result, In3+ ions and Zn2+ ions simultaneously reached saturation with S2− ions, resulting in formation of ZnIn2S4 crystal nuclei, which grew to form ZnIn2S4 crystals (eqn (4)). Due to the low H2S concentration under experimental conditions at 80 °C, the tendency for selective precipitation of In3+ is much larger than that at higher temperatures. Thus, under the experimental conditions, ZnmIn2Sm+3 (m = 2–5) should not be formed, which is different from the result of our previous work conducted at 160 °C by hydrothermal methods. With decreased Zn2+ concentration for growth of ZnIn2S4, In2S3 reforms, and then ZnIn2S4. When In3+ ions are completely precipitated, excess Zn2+ ions react with H2S to form ZnS crystals (eqn (5)). However, based on the result of Fig. 2, the rate of ZnS growth is lower. As a result, we did not observe the ZnS phase from Fig. 5. Thus, ZIS-0 should be a mixture of ZnIn2S4, In2S3 and ZnS.
Fig. 11 shows XRD patterns of ZIS-0 samples obtained at different reaction times. The patterns of all the samples are similar and their diffraction peaks can be assigned to hexagonal phase of ZnIn2S4. No In2S3 and ZnS phases were observed for all the samples, suggesting that they were highly dispersed and of small size. Because the reaction temperature is low and reaction times short, the growth of grains by Oswald ripening will be negligible.
| | | H3CCSNH3(TAA) + H2O → H2S + CH3CONH2 | (2) |
| | | In3+ + 3H2S → In2S3 nuclei + 6H+ → In2S3 crystals | (3) |
| | | 2In3+ + Zn2+ + 4H2S → ZnIn2S4 + 8H+ | (4) |
| | | Zn2+ + H2S → ZnS + 2H+ | (5) |
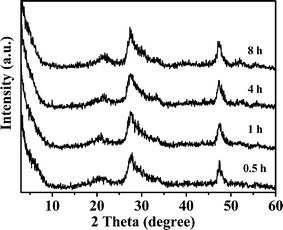 |
| | Fig. 11 XRD patterns of the products obtained at different reaction times without NaCl. | |
In the presence of NaCl, In3+ ions coordinate with Cl− ions to form InCl2+, InCl2+ and InCl3 coordination ions (denoted as InClm3−m),44 whose cumulative stability constants are 102.58, 103.84 and 104.2, respectively. Cumulative stability constants45 of ZnCl+, ZnCl2, ZnCl3−, ZnCl42− are 100.43, 100.63, 100.53 and 100.2, respectively. In the original reaction solution, the concentrations of In3+ and Zn2+ were 0.10 and 0.050 mol L−1, respectively. When the concentration of Cl− is low (<0. 30 mol L−1 NaCl), due to difference of stability constant between In3+ and Zn2+ coordination ion, In3+ formed InClm3−m coordination ions (eqn (6)) but Zn2+ did not, namely Zn2+ exists mainly as free ion. The presence of InClm3−m coordination ions decreased and the concentration of free In3+ ions in the reaction system leads to decreased In3+ precipitation rates. As a result, In3+ and Zn2+ precipitate simultaneously, and thus the amoiunt of In2S3 in the product decreased and the ZnIn2S4 amount increased. In addition, the low growth rate of the products led to increased grain size (Fig. 3 and Fig. 4) and decreased specific surface area (Table 2).
In the presence of 0.50 mol L−1 NaCl, Zn2+ ions coordinated with Cl− ions to form ZnCln2−n except the InClm3−m coordination ions in reaction solution (eqn (7)). In this case, the In3+ precipitation rate will be equal to or close to the Zn2+ precipitation rate. Thus, In3+ and Zn2+ should precipitate simultaneously to form single ZnIn2S4 phase (eqn (4)). Table 2 and Fig. 5, 6 and Fig. 8b demonstrate that the product obtained after 4 h reaction is single ZnIn2S4.
Fig. 12 shows XRD patterns of ZIS-0.50 samples prepared at different reaction times. Compared to Fig. 11, the diffraction intensity of ZIS-0.50 is stronger than that of ZIS-0, namely it has higher crystallinity. This is the reason why ZIS-0.50 has a higher photoactivity than ZIS-0. The diffraction intensities (002) facet reduce with increasing reaction time, attributed to the fact that H2S concentration in the solution is higher at the reaction stage of the latter, which results in decreased stacking of atoms along the c-axis in ZnIn2S4 formation.
| |  | (6) |
| |  | (7) |
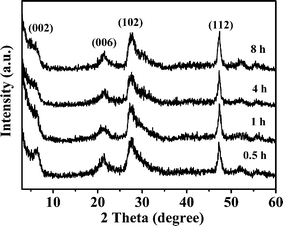 |
| | Fig. 12 XRD patterns of the products obtained at different reaction times in the presence of 0.50 mol L−1 NaCl. | |
When the concentration of NaCl is high enough, such as 2.0 mol L−1, the high concentration of NaCl can cause the InClm3−m and ZnCln2−n coordination ions to become more stable so that the concentration of their free metal ions is very low, this results in the concentration of the metal ions in the filtrate after 4 h reaction to be higher (Table 2). Although an increase in NaCl concentration can enhance the stability of InClm3−m coordination ions, due to smaller ksp for In2S3, In3+ ions can still precipitate effectively at the initial reaction stage. However, because of larger ksp for ZnS, enhancement of the stability of ZnCln2−n with increased NaCl concentration decreases the precipitation rate of Zn2+ markedly due to the low H2S concentration. Therefore, more In3+ ions precipitate in the form of In2S3 at the initial stage compared with that for ZIS-0.50. Table 2 shows that the molar ratio of In/Zn in the sample ZIS-2.0 is higher than that of ZnIn2S4. This result further demonstrates that In2S3 exists in the ZIS-2.0 sample, in agreement with the results of Fig. 7 and Fig. 8c. With increasing reaction time, the relative concentration of Zn2+ ions (compared to that of In3+) increased and thus ZnIn2S4 could form. At the later reaction stage, ZnS will form because of the excess Zn2+ ions which exist in the reaction system. Stability of ZnCln2−n coordination ions enhances with increased concentration of NaCl. This lowers the growth rate of ZnS and is thus favorable to ZnS nanocrystals formation. Therefore, the ZnS phase can be observed from the XRD pattern of the product obtained with 2.0 mol L−1 NaCl (Fig. 13). The diffraction intensity (002) facet of ZIS-2.0 is larger than that of ZIS-0.50. This illustrates that Cl− ion influences significantly the crystal structure of layered ZnIn2S4. The higher the concentration of Cl−, the larger the effect. This can be attributed to the fact that higher Cl− concentration decreases precipitation rates of the both metal ions so enhances the stacking of atoms along the c-axis for ZnIn2S4.
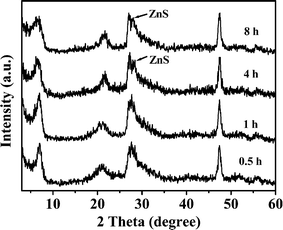 |
| | Fig. 13 XRD patterns of the products obtained at different reaction times in the presence of 2.0 mol L−1 NaCl. | |
In summary, ZnIn2S4 photocatalyst has been successfully synthesized by a facile and cheap thermal solution method at 80 °C. Most previously reported preparation methods of ZnIn2S4 need relative higher temperature and special equipment or reagents/additives. We list the preparation parameters of various reported methods for ZnIn2S4 in Table 4. Interestingly, ZnIn2S4 prepared at 80 °C in this work exhibits higher photocatalytic activity for hydrogen evolution than the compound prepared at 160 °C in our previous work.
Table 4 Comparison of various preparation methods for ZnIn2S4 photocatalyst
| No. |
Solvent |
Reaction temperature and time |
Special equipment |
Template or additive |
Evaluation of photoactivity |
References |
|
Teflon-lined autoclave.
A microwave system with Teflon-lined double-walled digestion vessel.
Photocatalyic degradation of pollutant.
Photocatalyic hydrogen evolution, QY: apparent quantum yield for hydrogen evolution in whole visible light range in the presence of various sacrificial reagents.
|
| 1 |
Water |
160 °C, 60 h |
|
None |
|
16
|
| 2 |
Water |
160 °C, 24 h |
|
Surfactant |
QY = 3.1% |
17
|
| 3 |
Water |
160 °C, 1–48 h |
|
Surfactant |
|
18
|
| 4 |
Ethylene glycol/methanol/water |
160 °C, 12 h |
|
None |
|
19
|
| 5 |
Pyridine |
160 °C, 16 h |
|
None |
|
20
|
| 6 |
Water |
160 °C, 12 h |
|
HCl |
|
21,41
|
| 7 |
Ethylene glycol |
200 °C, 10 min |
|
None |
|
22
|
| 8 |
Pyridine/water |
≥ 180–120 °C, 16 h |
|
Surfactant/polymer |
— |
23
|
| 9 |
Methanol |
160 °C, 11 h |
|
None |
|
24
|
| 10 |
Water |
160 °C, 11 h |
|
NaCl |
QY = 4.69% |
32
|
| 11 |
Water |
80 °C, 6 h |
None |
HCl |
|
35
|
| 12 |
Water |
80 °C, 4 h |
None |
NaCl |
QY = 6.47% |
This work |
Conclusions
Zn-In-S photocatalysts were synthesized by a NaCl-assisted low-temperature (80 °C) method. Cl− ion not only affected the composition, size and shape but also the crystal structure of the products. With increased NaCl concentration, diffraction intensity (002) facet and the grain size of the product increased, and the specific surface area decreased. With the appropriate concentration of NaCl (0.50 mol L−1), the product is composed of a single ZnIn2S4 crystal of layered structure, which shows the highest photocatalytic activity for hydrogen evolution and good stability. Photocatalyst with an orderly layered structure was found to be beneficial for photoactivity. This work is important to explain the complex preparation process of multi-component sulfides at low temperatures using TAA as the sulfur source and action mechanism for the Cl− ion.
Acknowledgements
Financial support from the National Basic Research Program of China (2009CB220003), the National Nature Science Foundation of China (21163012), the Natural Science Foundation of Jiangxi, China (2010JZH0096), and the Research Fund of Education Ministry of Jiangxi, China (GJJ09041) are gratefully acknowledged.
References
- N. S.Chaudhari, A. P. Bhirud, R. S. Sonawane, L. K. Nikam, S. S. Warule, V. H. Rane and B. B. Kale, Green Chem., 2011, 13, 2500 RSC
 .
.
- Y. X. Li, D. Gao, S. Q. Peng, G. X. Lu and S. B. Li, Int. J. Hydrogen Energy, 2011, 36, 4291 CrossRef CAS
 .
.
- C. Das, P. Roy, M. Yang, H. Jha and P. Schmuki, Nanoscale, 2011, 3, 3094 RSC
 .
.
- Y. X. Li, G. Chen, Q. Wang, X. Wang, A. K. Zhou and Z. Y. Shen, Adv. Funct. Mater., 2010, 20, 3390 CrossRef CAS
 .
.
- Y. X. Li, F. He, S. Q. Peng, G. X. Lu and S. B. Li, J. Mol. Catal. A, 2011, 341, 71 CrossRef CAS
 .
.
- K. Maeda, K. Teramura, D. Lu, N. Saito, Y. Inoue and K. Domen, Angew. Chem. Int. Ed., 2006, 45, 7806 CrossRef CAS
 .
.
- Y. X. Li, J. Du, S. Q. Peng, D. Xie, G. X. Lu and S. B. Li, Int. J. Hydrogen Energy, 2008, 33, 2007 CrossRef CAS
 .
.
- Y. Q.Wu, G. X. Lu and S. B. Li, J. Phys. Chem. C, 2009, 113, 9950 Search PubMed
 .
.
- Y. X. Li, Y. F. Hu, S. Q. Peng, G. X. Lu and S. B. Li, Phys. Chem. C, 2009, 113, 9352 CrossRef CAS
 .
.
- E. A. Kozlova and A. V. Vorontsov, Int. J. Hydrogen Energy, 2010, 35, 7337 CrossRef CAS
 .
.
- Y. X. Li, G. F. Ma, S. Q. Peng, G. X. Lu and S. B. Li, Appl. Catal. A, 2009, 363, 180 CrossRef CAS
 .
.
- Y. X. Li, F. He, S. Q. Peng, G. X. Lu and S. B. Li, Int. J. Hydrogen Energy, 2011, 36, 10565 CrossRef CAS
 .
.
- Y. X. Li, M. M. Guo, S. Q. Peng, G. X. Lu and S. B. Li, Int. J. Hydrogen Energy, 2009, 34, 5629 CrossRef CAS
 .
.
- J. G Yu, J. Zhang and M. Jaroniec, Green Chem., 2010, 12, 1611 RSC
 .
.
- J. Lv, T. Kako, Z. S. Li, Z. G. Zou and J. H. Ye, J. Phys. Chem. C, 2010, 114, 6157 CAS
 .
.
- Z. B. Lei, W. S. You, M. Y. Liu, G. H. Zhou, T. Takata, M. Hara, K. Domen and C. Li, Chem. Commun., 2003, 2142 RSC
 .
.
- S. H. Shen, L. Zhao and L. J. Guo, Mater. Res. Bull., 2009, 44, 100 CrossRef CAS
 .
.
- S. H. Shen, L. Zhao and L. J. Guo, Int. J. Hydrogen Energy, 2008, 33, 4501 CrossRef CAS
 .
.
- S. H. Shen, L. Zhao and L. J. Guo, J. Phys. Chem. Solids, 2008, 69, 2426 CrossRef CAS
 .
.
- F. Fang, L. Chen, Y. B. Chen and L. M. Wu, J. Phys. Chem. C, 2010, 6, 2393 Search PubMed
 .
.
- B. Chai, T. Y. Peng, P. Zeng, X. H. Zhang and X. J. Liu, J. Phys. Chem. C, 2011, 115, 6149 CAS
 .
.
- X. L. Hu, J. C. Yu, J. M. Gong and Q. Li, Cryst. Growth Des., 2007, 7, 2444 CAS
 .
.
- X. L. Gou, F. Y. Cheng, Y. H. Shi, L. Zhang, S. J. Peng, J. Chen and P. W. Shen, J. Am. Chem. Soc., 2006, 128, 7222 CrossRef CAS
 .
.
- Y. X. Li, J. X. Wang, S. Q. Peng, G. X. Lu and S. B. Li, Int. J. Hydrogen Energy, 2010, 35, 7116 CrossRef CAS
 .
.
- M. P. Pileni, Nat. Mater., 2003, 2, 145 CrossRef CAS
 .
.
- S. Kumar and T. Nann, Small, 2006, 2, 316 CrossRef CAS
 .
.
- W. Z.Wang, B. Poudel, Y. Ma and Z. F. Ren, J. Phys. Chem. B, 2006, 110, 25702 CrossRef
 .
.
- S. Wohlrab, N. Pinna, M. Antonietti and H. Co lfen, Chem. Eur. J., 2005, 11, 2903 CrossRef CAS
 .
.
- C. X. Li, J. Yang, Z. W. Quan, P. P. Yang, D. Kong and J. Lin, Chem. Mater., 2007, 19, 4933 CrossRef CAS
 .
.
- R. Yu, L. Yan, P. Zheng, J. Chen and X. Xing, J. Phys. Chem. C., 2008, 112, 19896 CAS
 .
.
- L. W. Qian, J. T. Zai, Z. Chen, J. Zhu, Y. P. Yuan and X. F. Qian, CrystEngComm, 2010, 12, 199 RSC
 .
.
- Z. D. Xu, Y. X. Li, S. Q. Peng, G. X. Lu and S. B. Li, CrystEngComm., 2011, 13, 4770 RSC
 .
.
- D. G. Tuck, Pure Appl. Chem., 1983, 55, 1477 CrossRef CAS
 .
.
- T. Sugimoto, S. H. Chen and A. Muramatsu, Colloids Surf. A, 1998, 135, 207 CrossRef CAS
 .
.
- Z. X. Chen, D. Z. Li, W. J. Zhang, C. Chen, W. J. Li, M. Sun, Y. H. He and X. Z. Fu, Inorg. Chem., 2008, 47, 9766 CrossRef CAS
 .
.
- O. M. Peeters and C. J. de Ranter, J. Chem. Soc., Perkin Trans., 1974, 2, 1832 Search PubMed
 .
.
- F. G. Donika, S. I. Radautsan, G. A. Kiosse, S. A. Semiletov, T. V. Donika and I. G. Mustya, Sov. Phys. Crystallogr., 1971, 16, 190 Search PubMed
 .
.
- J. Wang and J. Ye, J. Mater. Chem., 2005, 15, 4246 RSC
 .
.
- T. Nishino and Y. Hamakawa, Jpn. J. Appl. Phys., 1977, 16, 1291 CrossRef CAS
 .
.
- S. Lzzeza, K. Boubaker, T. B. Nasrallah, M. Mnari, R. Chtourouc, M. Amlouka and S. Belgacem, Acta Phys. Pol. A, 2008, 114, 869 Search PubMed
 .
.
- B. Cai, T. Y. Peng, P. Zeng and X. H. Zhang, Dalton Trans., 2012, 41, 1179 RSC
 .
.
- K. L. Zhang, C. M. Liu, F. Q. Huang, C. Zheng and W. D. Wang, Appl. catal. B, 2006, 68, 125 CrossRef CAS
 .
.
- C. M. Criss and J. W. Cobble, J. Am. Chem. Soc., 1964, 86, 5385 CrossRef CAS
 .
.
- D. Ferri, Acta. Chem. Scand., 1972, 26, 733 CrossRef CAS
 .
.
- D. F. C. Morris, D. T. Anderson, S. L. Waters and G. L. Reed, Electrochimica Acta, 1969, 14, 643 CrossRef CAS
 .
.
|
| This journal is © The Royal Society of Chemistry 2012 |
Click here to see how this site uses Cookies. View our privacy policy here. 
![[double bond, length as m-dash]](https://www.rsc.org/images/entities/char_e001.gif) S of TAA, respectively. With increasing heat treatment time, the peak intensities (Fig. 1a) decreased slowly. In the presence of 0.50 mol L−1 NaCl, a decrease in the peak intensities with time does not increase markedly (Fig. 1b). The results indicate that TAA decomposes slowly at 80 °C and NaCl does not obviously prompt the decomposition of TAA.
S of TAA, respectively. With increasing heat treatment time, the peak intensities (Fig. 1a) decreased slowly. In the presence of 0.50 mol L−1 NaCl, a decrease in the peak intensities with time does not increase markedly (Fig. 1b). The results indicate that TAA decomposes slowly at 80 °C and NaCl does not obviously prompt the decomposition of TAA.


![[double bond, length as m-dash]](https://www.rsc.org/images/entities/char_e001.gif) S of TAA in aqueous solution occurs at ca. 1308 cm−1. When Zn2+ and In3+ ions are added into the TAA solution, respectively, shift of the absorption band of C
S of TAA in aqueous solution occurs at ca. 1308 cm−1. When Zn2+ and In3+ ions are added into the TAA solution, respectively, shift of the absorption band of C![[double bond, length as m-dash]](https://www.rsc.org/images/entities/char_e001.gif) S in TAA solution is below 1.0 cm−1. Presence of NaCl does not affect the absorption band. The results indicate that the coordination of Zn2+ and In3+ with TAA is very weak under our experimental conditions, and that Zn2+ and In3+ mainly exist as hydrated ions.
S in TAA solution is below 1.0 cm−1. Presence of NaCl does not affect the absorption band. The results indicate that the coordination of Zn2+ and In3+ with TAA is very weak under our experimental conditions, and that Zn2+ and In3+ mainly exist as hydrated ions.
![[double bond, length as m-dash]](https://www.rsc.org/images/entities/char_e001.gif) S of TAA in different solutions
S of TAA in different solutions
![[double bond, length as m-dash]](https://www.rsc.org/images/entities/char_e001.gif) S of TAA (cm−1)
S of TAA (cm−1)


.
.
.
.
.
.
.
.
.
.
.
.
.
.
.
.
.
.
.
.
.
.
.
.
.
.
.
.
.
.
.
.
.
.
.
.
.
.
.
.
.
.
.
.
.
