DOI:
10.1039/C2RA01213H
(Paper)
RSC Adv., 2012,
2, 3828-3834
Electrical conductivity optimization in electrolyte-free fuel cells by single-component Ce0.8Sm0.2O2-δ–Li0.15Ni0.45Zn0.4 layer
Received
30th November 2011
, Accepted 15th February 2012
First published on 9th March 2012
Abstract
Single-component electrolyte-free fuel cells possess a similar function to the traditional fuel cells with a complex three-component structure. However, how to enhance their electrical properties for practical industrial applications remains a timely and important issue. Here, we report the manipulation of concentration ratios of ionic to electronic conductors in an electrolyte-free Ce0.8Sm0.2O2-δ–Li0.15Ni0.45Zn0.4 by adjusting the relative weight between its two inside compositions. Our systematic investigations reveal that the fuel cell with 30% in weight of Li0.15Ni0.45Zn0.4 exhibits an almost uniform distribution of the two compositions and has a total conductivity as high as 10 × 10−2 S cm−1 at 600 °C. Such an enhancement is found to be attributed to the established balance between the numbers of its inside ionic and electronic conductors. These findings are relevant for the technological improvement of this new species of electrolyte-free fuel cell and represent an important step toward commercialization of this single-component fuel cell.
Introduction
Solid oxide fuel cells (SOFCs) have captured much attention recently because of their high efficiency in energy conversion and for their fuel flexibility.1–6 In general, the conventional SOFCs comprise three parts, that is, anode, electrolyte and cathode, wherein the electrolyte plays a critical role in controlling functionalities by separating the two electrodes and transporting the H+ or O2− ions in between.7–10 Owing to its importance, much effort has been exerted to date on the upgrade of electrolytes in the SOFCs, aimed at putting them into large-scale technological applications. However, there remain several key issues that pose a significant hurdle to the industrial uses of conventional SOFCs, involving e.g., electrolyte thickness and cost of materials.11–15 Taking the amount of problems and keeping in mind the desperate needs to improve the SOFCs, designing a new SOFC material with cost efficiency and superior properties is timely and important.
Very recently, a few species of electrolyte-free fuel cells have been proposed by applying a unique homogeneous single-component oxide layer which possesses both ionic and electrical conductivity. The SDC-LNZ (where SDC indicates Ce0.8Sm0.2O2−δ and LNZ represents Li0.15Ni0.45Zn0.4),16 LiNiCuZnFe-NSDC (where LiNiCuZnFe is Li0.15:Ni0.25:Cu0.1:Zn0.2:Fe0.3 and NSDC Ce0.8Sm0.2O2−δ–Na2CO3),17 LiNiO2-GDC (LiNiO2 indicates Li+ doped NiO and GDC Ce0.9Gd0.1O2−δ),18 and NSDC-LiNiZn (NSDC indicates Ce0.8Sm0.2O2−δ–Na2CO3 and LiNiZn Li:Ni4:Zn5 or Li2:Ni4:Zn4)19 are just a few representative examples. Such currently developed single-component fuel cells not only hold the similar functions as the conventional SOFCs with the three components, but often show enhanced properties. For example, the single-component SDC-LNZ is reported to have a conductivity of 0.1–1 S cm−1 and a power density as high as over 600 mW cm−2 at 550 °C.16 These seminal works hence raise an appealing possibility that electrolytes in the SOFCs could be in principle thickened to almost nil, yielding a structurally much simpler and cost more effective fuel cell.
In its structure, the electrolyte-free SDC-LNZ fuel cell has two fundamental phases (Fig. 1), the ionic SDC and semiconducting LNZ, which provide percolating paths for both ions and electrons. The ions in the SDC-LNZ fuel cell are conducted in a way similar to the transport process in a normal electrolyte, while electrons are transferred in a p–n junction-like manner.16 It has been proposed that the working mechanism of such electrolyte-free fuel cell can be understood via the following process:16
| | | on H2 side: H2 → 2H+ + 2e− | (1) |
| | | on air (O2) side: ½O2 + 2e− → O2− | (2) |
| | | overall reactions: H2 + ½O2 → 2H+ + O2− | (3) |
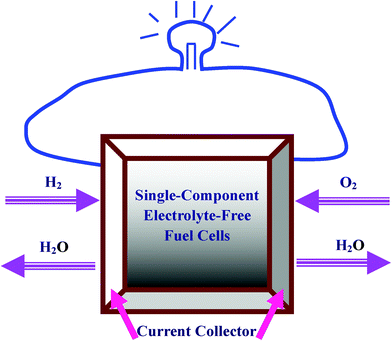 |
| | Fig. 1 Schematic illustration of the single-component electrolyte-free fuel cells. | |
In this sense, the balance matters between the concentrations of ionic conductors and protons in this device. Since the ions move much slower than the protons as a result of their much heavier mass,20 the investigation of optimal weight ratio between the two fundamental phases inside the single-component layer is of pronounced significance, which may further open an additional avenue to upgrade functionality of fuel cells. Here, we synthesize a series of SDC-LNZ oxides with different weight ratios between the two phases, and investigate systematically their electrical conductivity, aimed at offering an in-depth scientific understanding of this new type of fuel cell.
Experimental
Synthesis of the SDC-LNZ oxides
Two steps were adopted in fabricating the SDC-LNZ fuel cells with a series of weight ratios between its two inside phases. Detailed information on starting materials, chemical purity, and evaluated number of carriers were given in Table 1. First, the SDC and LNZ were prepared independently using the modified sol–gel technique. The Ce(NO3)3·6H2O, Ni(NO3)2·6H2O and LiNO3 were dissolved separately in the distilled water, while the Sm2O3 and ZnO in aqueous solution of nitric acid. Subsequently, the individual Ce(NO3)3·6H2O and Sm2O3 solutions were mixed, followed by the addition of solid citric acid monohydrate under magnetic stirring and heating at 70 °C. The rest of the separate solutions were mixed as well to prepare LNZ. Molar ratio of the metal ions to citric acid was maintained to be 1![[thin space (1/6-em)]](https://www.rsc.org/images/entities/char_2009.gif) :
:![[thin space (1/6-em)]](https://www.rsc.org/images/entities/char_2009.gif) 1.5. Next, the mixtures were dried into gels overnight independently in the water bath at 60–70 °C. The dry precursors were finally grounded in agate mortars and calcined in air in a muffle furnace at 800 °C for 5 h. The second step is to fabricate the SDC-LNZ by mixing the individual SDC and LNZ in a series of weight ratios (Table 1). These mixed powders were then ball milled and pressed into pellets with 10 mm in diameter and 1 mm in thickness under 30 MPa, followed by a final sintering at 800 °C for 8 h. These pellets were also polished and coated with the silver paste on both sides. Pt plate was applied as sample holder. The weight ratios of the LNZ to SDC were set to be 10%, 20%, 30%, and 40%, which were hereafter named as 9SDC-1LNZ, 8SDC-2LNZ, 7SDC-3LNZ, and 6SDC-4LNZ, respectively.
1.5. Next, the mixtures were dried into gels overnight independently in the water bath at 60–70 °C. The dry precursors were finally grounded in agate mortars and calcined in air in a muffle furnace at 800 °C for 5 h. The second step is to fabricate the SDC-LNZ by mixing the individual SDC and LNZ in a series of weight ratios (Table 1). These mixed powders were then ball milled and pressed into pellets with 10 mm in diameter and 1 mm in thickness under 30 MPa, followed by a final sintering at 800 °C for 8 h. These pellets were also polished and coated with the silver paste on both sides. Pt plate was applied as sample holder. The weight ratios of the LNZ to SDC were set to be 10%, 20%, 30%, and 40%, which were hereafter named as 9SDC-1LNZ, 8SDC-2LNZ, 7SDC-3LNZ, and 6SDC-4LNZ, respectively.
Table 1 Compositions, starting materials, chemical purity and molar ratio of the electronic to ionic conductors in the synthesized samples
| Sample |
Composition |
Starting Material |
Purity |
Ratio |
| SDC |
|
Ce(NO3)3·6H2O |
≥99.5% |
|
| Ce0.8Sm0.2O2-δ |
|
|
| |
Sm2O3 |
≥99.99% |
| 90 wt% Ce0.8Sm0.2O2-δ |
Ce0.8Sm0.2O2-δ |
|
| 9SDC-1LNZ |
|
LiNO3 |
≥99.5% |
2.38 |
| 10 wt% Li0.15Ni0.45Zn0.4 |
Ni(NO3)2·6H2O |
≥99.5% |
|
| |
ZnO |
≥99.99% |
| 80 wt% Ce0.8Sm0.2O2-δ |
Ce0.8Sm0.2O2-δ |
|
| 8SDC-2LNZ |
|
LiNO3 |
≥99.5% |
1.05 |
| 20 wt% Li0.15Ni0.45Zn0.4 |
Ni(NO3)2·6H2O |
≥99.5% |
|
| |
ZnO |
≥99.99% |
| 70 wt% Ce0.8Sm0.2O2-δ |
Ce0.8Sm0.2O2-δ |
|
| 7SDC-3LNZ |
|
LiNO3 |
≥99.5% |
0.62 |
| 30 wt% Li0.15Ni0.45Zn0.4 |
Ni(NO3)2·6H2O |
≥99.5% |
|
| |
ZnO |
≥99.99% |
| 60 wt% Ce0.8Sm0.2O2-δ |
Ce0.8Sm0.2O2-δ |
|
| 6SDC-4LNZ |
|
LiNO3 |
≥99.5% |
0.40 |
| 40 wt% Li0.15Ni0.45Zn0.4 |
Ni(NO3)2·6H2O |
≥99.5% |
|
| |
ZnO |
≥99.99% |
| C6H8O7·H2O |
C6H8O7·H2O |
C6H8O7·H2O |
≥99.5% |
Characterization and measurement of the SDC-LNZ oxides
Microstructures were analyzed using the X-ray diffraction (XRD), field-emission scanning electron microscopy (FE-SEM), and transmission electron microscopy (TEM). For the XRD, the D8 advance diffractometry (BrukerAXS, German) with Cu-Kα radiation (λ = 0.15405 nm) was used, which was operated at 40 kV and 40 mA. The XRD spectra were recorded from 10° to 100° at a speed of 6°/min. Morphologies of the polished and thermally etched pellets were observed by the Hitachi S-4800 high resolution FE-SEM equipped with the energy dispersive X-ray spectrometer (EDX) analyzer (XP30, Philips). The TEM images were taken on carbon-coated copper grid using the JEOL JEM-2100F electron microscope operated at an accelerating voltage of 200 kV. Ionic conductivity (σ) was measured using the Autolab Electrochemical Instruments PGSTAT302 and analyzed by FRA 4.9.006 software. First, resistances (R) were measured by cooling the samples from 600 °C to 300 °C at a step of 50 °C under a frequency ranging from 1 MHz to 0.1 Hz. The ionic conductivity was then calculated upon the expression, σ = L/(RS), where L and S were thickness and surface area of the sample, respectively.
Results and discussion
Fig. 2 presents the XRD patterns of the as-prepared SDC and LNZ powders. All peaks in the lower panel are indexed as the pure SDC with a cubic fluorite-type structure. In the upper panel, two different sets of diffraction patterns are observed, which correspond to LiNiO and ZnO. It is well known that the Li+ doped NiO is a p-type conductor, while the ZnO is an n-type semiconductor. On the other hand, the SDC is an oxygen ion conductor. Further TEM studies show that their particle size is no more than 50 nm (Fig. 3a and b), and the selected-area diffraction patterns confirm the nanocrystalline nature of the two types of powders (inset of Fig. 3a and b). Upon a closer inspection using EDX (Fig. 3c and d), the SDC is confirmed to be composed of Sm, Ce and O, and the LNZ Ni, Zn and O, as expected in their nominal chemical compositions, which means a successful output of individual SDC and LNZ powders.
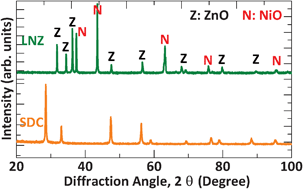 |
| | Fig. 2 XRD diffraction patterns of the individual SDC and LNZ powders calcined at 800 °C for 5 h. | |
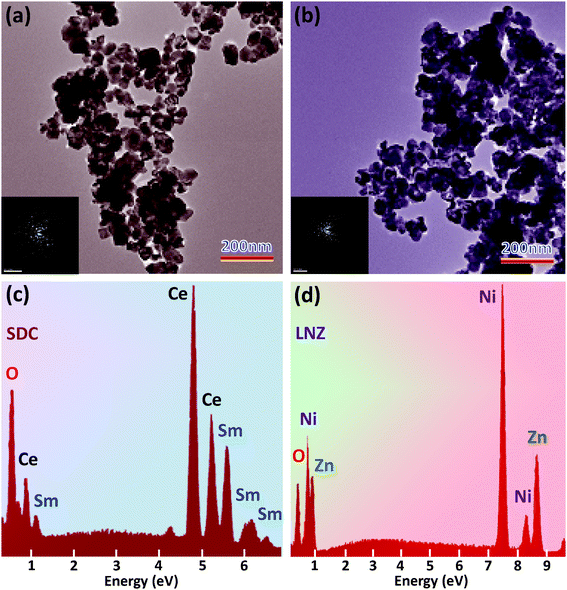 |
| | Fig. 3 TEM images of the individual (a) SDC and (b) LNZ powders. The inset shows selected-area diffraction patterns of the SDC and LNZ powders, respectively. (c) EDX spectrum of the SDC powders calcined at 800 °C for 5 h. (d) EDX of the LNZ powders. The vertical axis in (c) and (d) denotes the counts (i.e., intensity). | |
Fig. 4 shows XRD patterns of the SDC-LNZ samples sintered at 800 °C for 8 h with the weight ratio of LNZ ranging from 10% to 40%. As expected, the intensity of the diffraction peaks of LNZ is enhanced as its concentration increases. In addition, only diffraction peaks of SDC and LNZ are detected, indicating that no phases are newly formed when mixing the two oxides. Fig. 5a–d show corresponding SEM images of the four samples, where two types of particles, larger and relatively smaller ones, can be seen. Further EDX investigations reveal that the comparatively larger particles are mainly composed of LNZ (Fig. 5e), whereas the small ones SDC (Fig. 5f). Upon closer inspection, the large particles are prevalent in the 6SDC-4LNZ sample (Fig. 5d) rather than in the 9SDC-1LNZ and 8SDC-2LNZ samples (Fig. 5a and b), as is also reflected in their chemical compositions. However, the 7SDC-3LNZ exhibits almost uniformly distributed large and small particles (Fig. 5c), suggesting that the ionic SDC and electronic LNZ conductors in this sample reach a balance.
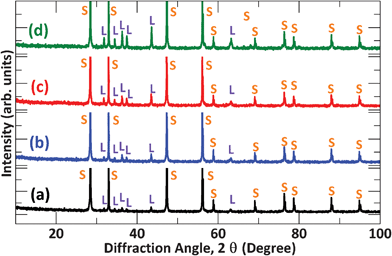 |
| | Fig. 4 XRD spectra of (a) 9SDC-1LNZ, (b) 8SDC-2LNZ, (c) 7SDC-3LNZ, and (d) 6SDC-4LNZ samples sintered at 800 °C for 8 h. Note that the S represents the SDC and L the LNZ oxide. | |
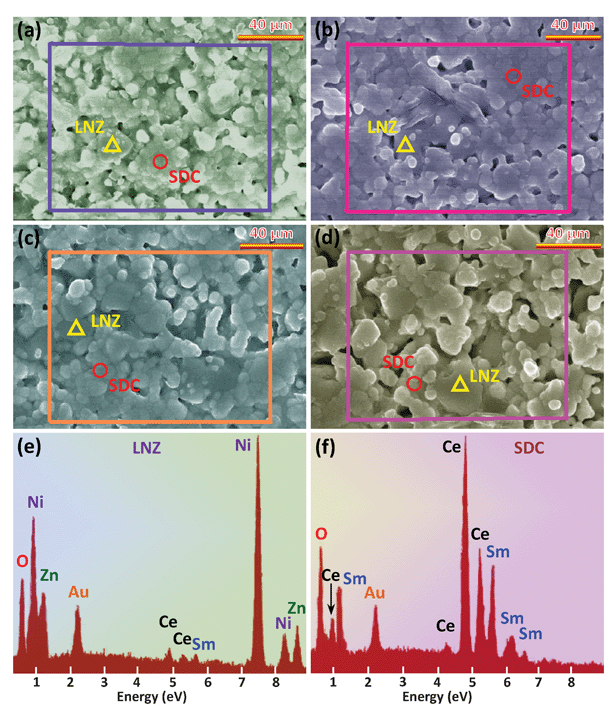 |
| | Fig. 5 FE-SEM micrographs of (a) 9SDC-1LNZ (b) 8SDC-2LNZ (c) 7SDC-3LNZ, and (d) 6SDC-4LNZ samples sintered at 800 °C for 8 h. EDX data obtained at (e) large and (f) small particle area, indicating that the large particles can be identified as SDC, while the small ones LNZ. The vertical axis in (e) and (f) denotes the counts. | |
To gain further insight into chemical composition of the two types of particles, Fig. 6 presents the elemental mapping of the four samples. The ratio of Ce to Sm decreases with the increase of Ni/Zn ratio, consistent with the aforementioned SEM image analyses. A key feature in this figure is that in comparison to other samples, the 7SDC-3LNZ sample has a more evenly distributed SDC and LNZ particles (Fig. 5), which demonstrates that such mixing ratio is optimized and might enhance electrical conductivity of the SDC-LNZ.
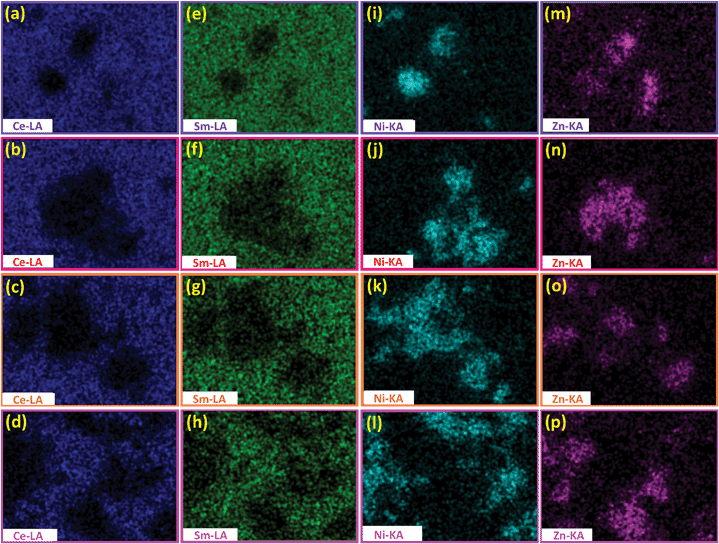 |
| | Fig. 6 (a) Ce, (b) Sm, (c) Ni, and (d) Zn elemental mappings of the 9SDC-1LNZ sample. Elemental mappings in the (e)–(h) 8SDC-2LNZ, (i)–(l) 7SDC-3LNZ, and (m)–(p) 6SDC-4LNZ. All samples are sintered at 800 °C for 8 h. The mapping regions are marked as the squares in Fig. 4(a)–(d). | |
To test this scenario, Fig. 7 presents electrochemical impedance spectroscopy (EIS) and corresponding equivalent circuit. The frequency in measurements is flexible, ranging from 1 MHz to 0.1 Hz via tailoring voltage in air at different temperatures. In the equivalent circuit, the L, R1, R2CPE2 and R3CPE3 denote the inductance (effect of stainless tube), Ohmic resistance, charge and mass transfer, respectively. In this sense, the EIS results can directly reflect the changes in total conductivity including both ion and electron contributions for the samples with different ratios of SDC to LNZ. All impedance spectra share a feature in this figure: they have a semicircle followed by a tail except that of the 6SDC-4LNZ. The presence of the semicircle in the impedance spectra implies that the reactions on the anode and cathode are kinetically fast,16–19,21 which provides further support that most of the SDC-LNZ samples have high catalytic activity for H2 and O2. In addition, arcs in the spectra of 9SDC-1LNZ, 8SDC-2LNZ, and 7SDC-3LNZ shrink as measurement temperature increases from 500 °C to 600 °C, (Fig. 7a–c). However, for the 6SDC-4LNZ sample, these arcs evolve into a small but visible horizontal line (inset of Fig. 7d), which may be due to the overwhelming amount of electronic conductors arising from the LNZ. Such electronic conductivity may not be counted completely by the EIS once electronic conductors are of very high concentration.22,23 A comparison between the spectra reveals that the 7SDC-3LNZ has the smallest arcs in the spectrum, meaning that it has the lowest total resistance at the measured temperature. This is due to the balance between SDC and LNZ particles in the 7SDC-3LNZ (Fig. 5 and 6), and further indicates that the best equilibrium is reached in between the ionic and electronic conductors.
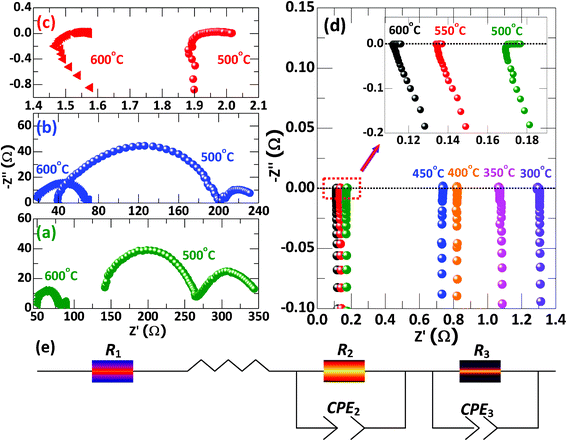 |
| | Fig. 7 Impedance spectra of (a) 9SDC-1LNZ, (b) 8SDC-2LNZ, (c) 7SDC-3LNZ, and (d) 6SDC-4LNZ sintered at 800 °C for 8 h. The measurements are carried out at different temperatures. (e) Illustration of an equivalent circuit. | |
The electrical conductivities for all the samples are further calculated based on the impedance measured in air, as shown in Fig. 7. The total conductivity reaches a maximum for the 7SDC-3LNZ sample at every measured temperature (e.g., 10 × 10−2, 0.2 × 10⁻² and 0.1 × 10⁻² S cm−1 at 600 °C for 7SDC-3LNZ, 8SDC-2LNZ and 9SDC-1LNZ samples). As mentioned previously, it has been reported that the single-component fuel cell is similar in function to the traditional SOFC, with three components from the viewpoint of ion transport and ion-electron junction between electrodes and electrolyte.16 Since the ionic SDC and electronic LNZ phases coexist in this single-component layer, they both contribute to the EIS measurements. However, such contributions differ because ions are well known to transfer much slower than electrons as a result of their much heavier mass. According to the previously proposed reaction equations,16 the molar concentration ratio of ionic to electronic conductors is evaluated to be 1![[thin space (1/6-em)]](https://www.rsc.org/images/entities/char_2009.gif) :
:![[thin space (1/6-em)]](https://www.rsc.org/images/entities/char_2009.gif) 2. Hence, the actual ratio in our samples should be somewhat higher than the estimated value owing to the heavier ionic conductors.
2. Hence, the actual ratio in our samples should be somewhat higher than the estimated value owing to the heavier ionic conductors.
Fig. 8 demonstrates that the electrical conductivity is gradually increased from 9SDC-1LNZ to 7SDC-3LNZ, which is ascribed to the increasing weight ratio of LNZ. Since ionic conductors in the 9SDC-1LNZ are excessive, the electronic conductors are not enough to react with all the ionic conductors. However, with the increase of LNZ weight ratio (e.g. in 8SDC-2LNZ), more electrons are produced, which consume more ionic conductors, and result in better electrical conductivity. Further increase of LNZ (e.g., in 7SDC-3LNZ) introduces a much more significant amount of electrons, which balances the two species of conductors in the sample and results in the highest electrical conductivity. Therefore, the quantitative analysis of the molar concentration ratio within these samples provides us a pathway to optimize electrical properties of this new single-component layer fuel cell.
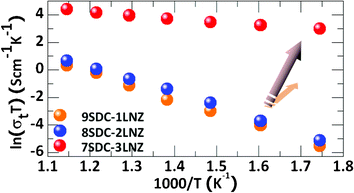 |
| | Fig. 8 Total conductivity (σt) of a series of the SDC-LNZ samples with different weight ratios. The samples are sintered at 800 °C for 8 h. | |
Table 1 lists the calculated molar concentration ratio between ionic and electronic conductors for all the samples. The ratio in the 7SDC-3LNZ is estimated to be 0.62, somewhat higher than the aforementioned value of 0.5, which means that electrical properties are optimized in the fuel cells with high concentration of ionic conductors. However, the minor difference indicates that ionic transport is insignificant, in contrast to the conventional fuel cells in which the O2− transportation via electrolyte is a critical step. In the single-component fuel cell, ionic transportation process involves movement of O2− ions from the SDC interiors to the surface where the redox reactions occur, a shorter process than that in traditional three-component fuel cells. However, the electrical properties have been reported to be optimized in the NSDC-LiNiZn sample with a weight ratio of 6![[thin space (1/6-em)]](https://www.rsc.org/images/entities/char_2009.gif) :
:![[thin space (1/6-em)]](https://www.rsc.org/images/entities/char_2009.gif) 4, which differs from the value we obtained for the SDC-LNZ.19 This is mainly because the NSDC has a higher ionic conductivity than the SDC,24–28 which requires a higher concentration of electronic conductors to balance the ionic conductors. The 6SDC-4LNZ sample here behaves in a semiconducting fashion because electronic conductors are more than ionic conductors inside this sample, though its weight ratio of 0.40 is close to that of evaluated value of 0.5. The electrical conductivity of the ionic phase hence plays an important role as well in balancing the electronic and ionic conductivity, and such optimization of the mixing ratio between the ionic and electronic phases represents an important step forward in improving this new class of single-component fuel cells.
4, which differs from the value we obtained for the SDC-LNZ.19 This is mainly because the NSDC has a higher ionic conductivity than the SDC,24–28 which requires a higher concentration of electronic conductors to balance the ionic conductors. The 6SDC-4LNZ sample here behaves in a semiconducting fashion because electronic conductors are more than ionic conductors inside this sample, though its weight ratio of 0.40 is close to that of evaluated value of 0.5. The electrical conductivity of the ionic phase hence plays an important role as well in balancing the electronic and ionic conductivity, and such optimization of the mixing ratio between the ionic and electronic phases represents an important step forward in improving this new class of single-component fuel cells.
Conclusions
We have designed a series of single-component SDC-LNZ oxides with differing weight ratios of the SDC to LNZ and investigated their electrical properties, with an aim to optimize this new class of electrolyte-free fuel cells. The total conductivity is found to be enhanced significantly with the rise of LNZ weight ratio in SDC-LNZ, which is attributed to the increasing amount of electronic conductors. Of all the mixing oxides, the 7SDC-3LNZ exhibits the highest total conductivity at the measured temperatures as a direct consequence of the optimal balance between its inside ionic and electronic conductors. These results demonstrate that the relative weight ratio between the two compositions in the mixed oxides is critical to enhancing this electrolyte-free full cell, opening up an avenue to further improve the properties of single-component fuel cells and even to design more powerful fuel cells with simpler structures.
Acknowledgements
This work is supported by the National Natural Science Foundation of China under grant no. 51002148, 21071141, 20871023 and 20921002, and by the Natural Science Foundation of Jilin province, China, under grant no. 201115126. Z.W. thanks the support from the Grant-in-Aid for Young Scientists (B) (grant no. 22760500) in Japan.
References
- V. Thangadurai and W. Weppner, Ionics, 2006, 12, 81–89 CrossRef CAS.
- H. Inaba and H. Tagawa, Solid State Ionics, 1996, 83, 1–16 CrossRef CAS.
- E. P. Murray, T. Tsai and S. A. Barnett, Nature, 1999, 400, 649–651 CrossRef CAS.
- S. Park, J. M. Vohs and R. J. Gorte, Nature, 2000, 404, 265–267 CrossRef CAS.
- B. C. H. Steele, Solid State Ionics, 2000, 129, 95–110 CrossRef CAS.
- M. Mogensen, N. M. Sammes and G. A. Tompsett, Solid State Ionics, 2000, 129, 63–94 CrossRef CAS.
- B. C. H. Steel and A. Heinzel, Nature, 2001, 414, 345–52 CrossRef.
- R. W. James, K. Worawarit, M. Roberto, C. Hsun-Yi, M. H. Jon, D. J. Miller, T. Katsuyo, W. V. Peter, B. A. Stuart and A. B. Scott, Nat. Mater., 2006, 5, 541–544 CrossRef.
- S. M. Haile, D. A. Boysen, C. R. I. Chisholm and R. B. Merle, Nature, 2001, 410, 910–913 CrossRef CAS.
- J. B. Goodenough, Nature, 1999, 404, 821–823 CrossRef.
- Z. P. Shao and S. M. Haile, Nature, 2004, 431, 170–173 CrossRef CAS.
- J. Will, A. Mitterdorfer, C. Kleinlogel, D. Perednis and L. J. Gauckler, Solid State Ionics, 2000, 131, 79–76 CrossRef CAS.
- B. Zhu, Int. J. Energy Res., 2006, 30, 895–903 CrossRef CAS.
- B. Zhu, X. T. Yang, J. Xu, Z. G. Zhu, S. J. Ji and M. T. Sun, J. Power Sources, 2003, 118, 47–53 CrossRef CAS.
- B. Zhu, X. R. Liu and T. Schober, Electrochem. Commun., 2004, 6, 378–383 CrossRef CAS.
- B. Zhu, R. Raza, G. Abbas and M. Singh, Adv. Funct. Mater., 2011, 21, 2465–2469 CrossRef CAS.
- B. Zhu, R. Raza, H. Y. Qin and L. D. Fan, J. Power Sources, 2011, 196, 6362–6365 CrossRef CAS.
- B. Zhu, Y. Ma, X. D. Wang, R. Raza, H. Y. Qin and L. D. Fan, Electrochem. Commun., 2011, 13, 225–227 CrossRef CAS.
- B. Zhu, H. Y. Qin, R. Raza, Q. H. Liu, L. D. Fan, J. Patakangas and P. Lund, Int. J. Hydrogen Energy, 2011, 36, 8536–8541 CrossRef CAS.
- J. Nelson George, A. Peracchio Aldo and K. S. Chiu Wilson, J. Power Sources, 2011, 196, 4695–4704 CrossRef.
-
J. Bard and L. R. Faulkner, Electrochemical methods: fundamentals and applications, 2nd ed, New York,: John Wiley & Sons, Inc., 2001, p. 380–387 Search PubMed.
-
D. Vladikova, The technique of the differential impedance analysis Part I: basics of the impedance spectroscopy. Proceedings of the International Workshop “Advanced Techniques for Energy Sources Investigation and Testing” 2004, September, Sofia, Bulgaria, 4–9 Search PubMed.
- E. J. L. Schouler, N. Mesbahi and G. Vitter, Solid State Ionics, 1983, 989–996 Search PubMed.
- B. Zhu, J. Power Sources, 2003, 114, 1–9 CrossRef CAS.
- J. B. Huang, Z. Q. Mao, L. Z. Yang and R. R. Peng, Electrochem. Solid-State Lett., 2005, 8, A437–440 CrossRef CAS.
- J. B. Huang, Z. Q. Mao, Z. X. Liu and C. Wang, Electrochem. Commun., 2007, 9, 2601–2605 CrossRef CAS.
- A. Boden, J. Di, C. Lagergren, G. Lindergh and C. Y. Wang, J. Power Sources, 2007, 172, 520–529 CrossRef CAS.
- B. Zhu, X. R. Liu, Z. G. Zhu and R. Ljungberg, Int. J. Hydrogen Energy, 2008, 33, 3385–3392 CrossRef CAS.
|
| This journal is © The Royal Society of Chemistry 2012 |
Click here to see how this site uses Cookies. View our privacy policy here. 
![[thin space (1/6-em)]](https://www.rsc.org/images/entities/char_2009.gif) :
:![[thin space (1/6-em)]](https://www.rsc.org/images/entities/char_2009.gif) 1.5. Next, the mixtures were dried into gels overnight independently in the water bath at 60–70 °C. The dry precursors were finally grounded in agate mortars and calcined in air in a muffle furnace at 800 °C for 5 h. The second step is to fabricate the SDC-LNZ by mixing the individual SDC and LNZ in a series of weight ratios (Table 1). These mixed powders were then ball milled and pressed into pellets with 10 mm in diameter and 1 mm in thickness under 30 MPa, followed by a final sintering at 800 °C for 8 h. These pellets were also polished and coated with the silver paste on both sides. Pt plate was applied as sample holder. The weight ratios of the LNZ to SDC were set to be 10%, 20%, 30%, and 40%, which were hereafter named as 9SDC-1LNZ, 8SDC-2LNZ, 7SDC-3LNZ, and 6SDC-4LNZ, respectively.
1.5. Next, the mixtures were dried into gels overnight independently in the water bath at 60–70 °C. The dry precursors were finally grounded in agate mortars and calcined in air in a muffle furnace at 800 °C for 5 h. The second step is to fabricate the SDC-LNZ by mixing the individual SDC and LNZ in a series of weight ratios (Table 1). These mixed powders were then ball milled and pressed into pellets with 10 mm in diameter and 1 mm in thickness under 30 MPa, followed by a final sintering at 800 °C for 8 h. These pellets were also polished and coated with the silver paste on both sides. Pt plate was applied as sample holder. The weight ratios of the LNZ to SDC were set to be 10%, 20%, 30%, and 40%, which were hereafter named as 9SDC-1LNZ, 8SDC-2LNZ, 7SDC-3LNZ, and 6SDC-4LNZ, respectively.


![[thin space (1/6-em)]](https://www.rsc.org/images/entities/char_2009.gif) :
:![[thin space (1/6-em)]](https://www.rsc.org/images/entities/char_2009.gif) 2. Hence, the actual ratio in our samples should be somewhat higher than the estimated value owing to the heavier ionic conductors.
2. Hence, the actual ratio in our samples should be somewhat higher than the estimated value owing to the heavier ionic conductors.
![[thin space (1/6-em)]](https://www.rsc.org/images/entities/char_2009.gif) :
:![[thin space (1/6-em)]](https://www.rsc.org/images/entities/char_2009.gif) 4, which differs from the value we obtained for the SDC-LNZ.19 This is mainly because the NSDC has a higher ionic conductivity than the SDC,24–28 which requires a higher concentration of electronic conductors to balance the ionic conductors. The 6SDC-4LNZ sample here behaves in a semiconducting fashion because electronic conductors are more than ionic conductors inside this sample, though its weight ratio of 0.40 is close to that of evaluated value of 0.5. The electrical conductivity of the ionic phase hence plays an important role as well in balancing the electronic and ionic conductivity, and such optimization of the mixing ratio between the ionic and electronic phases represents an important step forward in improving this new class of single-component fuel cells.
4, which differs from the value we obtained for the SDC-LNZ.19 This is mainly because the NSDC has a higher ionic conductivity than the SDC,24–28 which requires a higher concentration of electronic conductors to balance the ionic conductors. The 6SDC-4LNZ sample here behaves in a semiconducting fashion because electronic conductors are more than ionic conductors inside this sample, though its weight ratio of 0.40 is close to that of evaluated value of 0.5. The electrical conductivity of the ionic phase hence plays an important role as well in balancing the electronic and ionic conductivity, and such optimization of the mixing ratio between the ionic and electronic phases represents an important step forward in improving this new class of single-component fuel cells.