DOI:
10.1039/C2RA01229D
(Paper)
RSC Adv., 2012,
2, 4220-4227
Self-assembled magnetite peony structures with petal-like nanoslices: one-step synthesis, excellent magnetic and water treatment properties†
Received
2nd December 2011
, Accepted 23rd February 2012
First published on 27th March 2012
Abstract
Self-assembled magnetite (Fe3O4) peony structures with petal-like nanoslices have been successfully synthesized by a low-temperature and environmentally friendly one-step aqueous method without any surfactant and calcination treatment. Powder X-ray diffraction (XRD), field emission scanning electron microscopy (FE-SEM), transmission electron microscopy (TEM), Raman spectroscopy, X-ray photoelectron spectroscopy (XPS), Mössbauer spectroscopy and superconducting quantum interference device magnetometer measurements were used to characterize the samples. The experimental results indicate that the use of the organic additive triethanolamine (N(CH2CH2OH)3) has an obvious impact on the morphologies of the products. The possible formation mechanism for the Fe3O4 peony structures with well-defined morphology has been presented in detail. The magnetic and electrical properties of the Fe3O4 peony structures are investigated. The sample shows a ferrimagnetic behaviour with a high saturation magnetization of 88.4 emu g−1 at 295 K. Low-field magnetoresistance of ca. −2.0% is achieved in an applied magnetic field of ±1.0 T at 295 K. In addition, the as-prepared Fe3O4 peony materials are studied as adsorbents in waste-water treatment, and exhibit an excellent ability to remove Cr(VI) pollutant from aqueous solution. The Fe3O4 peony sample demonstrates ca. 5.24 mg g−1 of adsorption capacity towards Cr(VI) ions favourably comparing with commercial and reported adsorbents.
Introduction
Three-dimensional (3D) nanoarchitectures often demonstrate unique size- and shape-dependent physical and chemical properties, which are of technological importance and research interest.1 The most wide and simplest synthetic route to 3D nanoarchitectures is probably self-assembly, in which ordered aggregates are formed during a spontaneous process. However, it is still a great challenge to develop facile and reliable synthetic methods for hierarchically self-assembled nanoarchitectures with designed components and controllable morphologies. Morphology and dimensionality now are considered to be the particular factors that could strongly affect the properties of nanomaterials.
Magnetite (Fe3O4) is one of the most important functional materials and plays many roles. Recently magnetite nanostructures have been attractive nanomaterials for fundamental studies and potential applications including magnetic ferrofluids,2 magnetic response imaging and sensing,3 biomedical drug delivery,4 catalysis,5 energy device6 and data storage etc.7 Various magnetite nanostructures, such as nanocrystals,8 particles,9 wires,10 tubes,11 rods,12 plates,13 cubes14 and octahedra,15 have been successfully synthesized by a variety of methods. However, the self-assembly of these low-dimensional building blocks into complex 3D ordered nanostructures is still considerably more difficult to achieve. Up to now, there are few reports on the self-assembled magnetite nanostructures prepared with macromolecule surfactants,16 followed by a subsequent calcination treatment at intermediate temperatures (∼450 °C).17 In order to further understand the self-organized mechanism and expand the application of magnetite nanomaterials, self-assembled magnetite 3D nanostructures need to be explored in detail. Synthetic routes should be developed to be more simple and environmentally friendly.
Aqueous chemistry is a widely used method to prepare inorganic nanomaterials in the laboratory. In this paper, we report for the first time a simple and facile route for the synthesis of the Fe3O4 peony structures with petal-like nanoslices by a low-temperature, one-step aqueous process. In our experiment, the 3D self-assembled structures are obtained without any surfactant and calcination treatment, in contrast to previous reports. The reaction mechanism leading to the nanocrystals and the self-assembly process are discussed. These Fe3O4 peony structures exhibit ferrimagnetic behaviour with high saturation magnetization. Low-field magnetoresistance (MR) has also been observed in the Fe3O4 peony structures. Moreover, the as-prepared Fe3O4 materials exhibit a quick and efficient absorption for Cr(VI) ions in waste-water treatment. Thus they have potential applications in magnetic devices for electrochemical energy production and in water treatment.
Experimental
Synthesis
Chemicals: Fe2(SO4)3 (99.9%), FeSO4·7H2O (99%), N(CH2CH2OH)3 (98%), NaOH (99.9%) and K2Cr2O7 (99.5%) were purchased from Beijing Fine Chemical Company, and HCl was commercially available analytical grade and used as received without further purification.
In a typical synthesis, 3 g Fe2(SO4)3 (7.5 mmol) and 2.78 g FeSO4·7H2O (10 mmol) were dissolved each in 75 mL deoxygenated water. 7.45 g (0.05 mmol) triethanolamine (N(CH2CH2OH)3) and 12 g (0.3 mol) NaOH were dissolved into 100 mL deoxygenated water, resulting in a mixture of N(CH2CH2OH)3 and NaOH. Two equal portions of this mixed solution were then added into the two solutions of Fe2(SO4)3 and FeSO4. The obtained solutions of Fe2(SO4)3 and FeSO4 were then mixed, followed by heating at 100 °C and holding for 20 h in an oven. After completion of reaction, the obtained black powder was isolated by an Nd–Fe–B magnet and washed several times with deoxygenated water. Finally, the products were dried under Ar atmosphere at 75 °C.
Characterization
The powder X-ray diffraction (XRD) pattern of the products were measured on a Rigaku D/MAX-2500 diffractometer with Cu Kα radiation (λ = 1.5406 Å). Field-emission scanning electron microscopy (FE-SEM) was conducted on a Hitachi S-4800 equipped with energy-dispersive spectrum (EDS) analysis. Transmission electron microscopy (TEM), high-resolution transmission electron microscopic (HRTEM) images and selected area electron diffraction (SAED) patterns were obtained on a FEI TF30 microscope operated at 300 kV. Raman spectra were collected using a HORIBA Jobin Yvon LabRAM HR800 Laser Raman spectrometer at room temperature using an excitation wavelength of 458 nm. X-Ray photoelectron spectroscopy (XPS) measurements were performed using a high-performance AXIS 165 X-ray photoelectron spectrometer (UK, KRATOS). The 57Fe Mössbauer spectrum was taken by an Oxford MS-500 in transmission configuration and in constant acceleration mode using a 57Co:Rh radioactive source. The data were fitted by the Gauss–Newton method.
The magnetic measurements were carried out on a superconducting quantum interference device (SQUID) magnetometer (LakeShore 7303) at different temperatures. The dc I–U curves of the samples was obtained by using Keithley 2400 and 2000 electrometers as a homemade variable voltage source and milliammeter, respectively. The magnetoresistance (MR) measurements were performed using Keithley 2400 programmable electrometers in resistance mode directly to measure the change in the resistance at various temperatures with different applied magnetic fields (0–1.0 T). For the water treatment experiment, K2Cr2O7 was used as the source of Cr(VI). Solutions containing different concentrations of Cr(VI) ions (6, 8, 10, 12 mg L−1) were prepared and the pH value of the aqueous solution was adjusted to 3 using HCl. Then, 0.01 g of the absorbent sample as added to 7 mL of the above solution under stirring at room temperature (23 °C). After a specified time, the solid absorbent and liquid were separated and inductively coupled plasma-mass spectroscopy (ICP-MS) (Thermal Electron, XSeries II) was used to measure the chromium concentration in the remaining solution.
Results and discussion
Phase, composite and morphology
Experimentally, Fe2(SO4)3 (s) and FeSO4·7H2O (s) were dissolved in water and then ligand, N(CH2CH2OH)3 and NaOH added (Fig. 1). The resulting mixture was stored at 100 °C for 20 h to achieve the growth of Fe3O4 peony structures. The addition of N(CH2CH2OH)3 is crucial for a successful synthesis. After the dissolution of Fe2(SO4)3 and FeSO4·7H2O, N(CH2CH2OH)3 must be added simultaneously with NaOH. Otherwise, the hydrolysis by NaOH would lead to the formation of Fe3O4 nanoparticles. The composition, phase purity and morphology of the as-prepared samples were investigated by XRD, XPS, Raman spectroscopy, Mössbauer spectroscopy and FE-SEM.
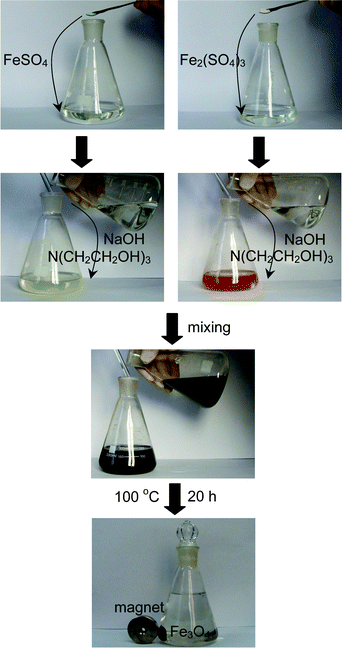 |
| | Fig. 1 Photographic illustration of the procedure for synthesis of Fe3O4 peony structures. | |
Fig. 2a shows a typical X-ray diffraction (XRD) pattern of the Fe3O4 peony structures. All the diffraction peaks can be indexed to face-centered cubic (fcc) phase Fe3O4 (Joint Committee on Powder Diffraction Standards, JCPDS, no. 19-0629), and no diffraction peaks arising from the possible impurity phases, such as Fe2O3, FeOOH, etc., can be detected, indicating the formation of single-phase Fe3O4. The lattice parameters of the products are calculated according to the equation 1/d2 = (h2 + k2 + l2)/a2 based on the crystal plane (311), and the lattice parameter is a = 0.8397 nm, which is well compatible with the literature value of a = 0.8396 nm (JCPDS, no. 19-0629). Fig. 2b shows the Raman spectrum of the Fe3O4 peony structures. The peaks at 331, 486, 571 and 652 cm−1 correspond to T2g(1), E1g, T2g(2) and A1g modes of Fe3O4 structure, respectively.18 The absence of characteristic peaks of other iron oxides in both XRD and Raman analysis suggests the formation of pure-phase Fe3O4. X-Ray photoelectron spectroscopy analysis of the Fe3O4 products was also performed to determine the valences of iron ions (see Fig. S1, ESI†). The center values of electron-bonding energy of Fe![[thin space (1/6-em)]](https://www.rsc.org/images/entities/char_2009.gif) 2p3/2 and Fe
2p3/2 and Fe![[thin space (1/6-em)]](https://www.rsc.org/images/entities/char_2009.gif) 2p1/2 are 710.8 and 725.1 eV, respectively. The unresolved shakeup satellite structures at the higher binding energy sides of the Fe
2p1/2 are 710.8 and 725.1 eV, respectively. The unresolved shakeup satellite structures at the higher binding energy sides of the Fe![[thin space (1/6-em)]](https://www.rsc.org/images/entities/char_2009.gif) 2p3/2 peak are fingerprints of the XPS spectrum of Fe3O4.19 Moreover, the broad Fe
2p3/2 peak are fingerprints of the XPS spectrum of Fe3O4.19 Moreover, the broad Fe![[thin space (1/6-em)]](https://www.rsc.org/images/entities/char_2009.gif) 2p signals are attributed to the coexistence of Fe3+ and Fe2+ states. These results prove the presence of Fe3+ and Fe2+ ions in the sample.
2p signals are attributed to the coexistence of Fe3+ and Fe2+ states. These results prove the presence of Fe3+ and Fe2+ ions in the sample.
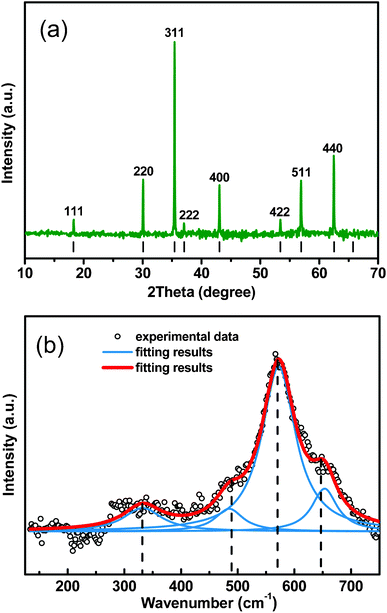 |
| | Fig. 2 (a) XRD pattern of the Fe3O4 peony structures. Vertical bars indicate the peak positions of Fe3O4 (JCPDS no. 19-0629). (b) Raman spectra of the Fe3O4 peony structures. | |
The Mössbauer spectrum of the as-prepared sample was measured at room temperature. The experimental and fitted Mössbauer spectra of the Fe3O4 peony-like sample are shown in Fig. 3. The spectrum of the Fe3O4 peony-like sample can be fitted with two magnetic hyperfine sextets. According to the isomer shift values of the sextets corresponding to tetrahedral and octahedral sites, one can conclude that the tetrahedral sites have larger hyperfine field (48.88 T) and are occupied only by Fe3+ ions, as the isomer shift value is 0.31 mm s−1. The isomer shift of octahedral sites indicates the coexistence of Fe3+ and Fe2+, which is agreement with the above XPS analysis.
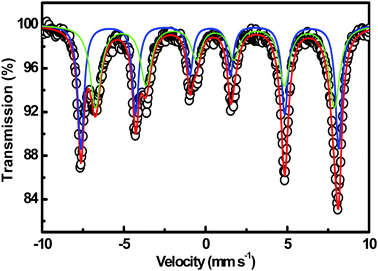 |
| | Fig. 3 Room-temperature Mössbauer spectra of the Fe3O4 peony structures. The open circles represent the experimental data, and the solid lines present the fitted results. | |
The morphology and size of the Fe3O4 products are shown in Fig. 4. Fig. 4a and b show typical field-emission scanning electron microscope (SEM) images of the Fe3O4 peony structures. It can be seen that the Fe3O4 products consist of numerous well-defined Fe3O4 hierarchical flower structures in the micrometer size range (Fig. 4a). The high magnification image of the Fe3O4 flower structures presents an interesting peony-like morphology (Fig. 4b), and a photo of a peony in China is also shown in Fig. 4b. These Fe3O4 peony-like structures have a size of around 3–4 μm in diameter, and are composed of hierarchically and packed radially oriented nanoslices that are similar to peony petals. The thickness of peony-like nanoslices is approximately 20–30 nm. Energy-dispersive spectra (EDS) analysis (Fig. S2, ESI†) indicates that the products only contain Fe and O elements. Further structural characterizations of the Fe3O4 peony structures were performed by transmission electron microscopy (TEM) and high-resolution TEM (HRTEM). Fig. 4c shows a typical TEM image of an individual Fe3O4 petal-like nanoslice, while a HRTEM image recorded from a part of nanoslice is shown in Fig. 4d. A high-magnification TEM image of a nanoslice (inset in Fig. 4c) reveals that the nanoslices show a highly porous structure. The lattice spacing of 0.207 nm corresponds to the planar spacing of (400) at 0.209 nm for the cubic spinel-structured Fe3O4. The selected-area electron diffraction (SAED) pattern presented in Fig. 4e also demonstrates the highly crystalline nature of the peony structures. The lattice spacings, calculated based on five distinct diffraction rings (1–5), can be indexed to (220), (311), (400), (422) and (440) planes of Fe3O4 (JCPDS, no. 19-0629).
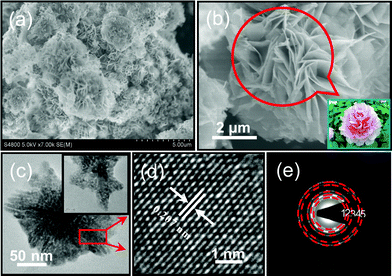 |
| | Fig. 4 (a) Low-magnification and (b) high-magnification SEM images of the Fe3O4 peony structures (inset shows the digital picture of a peony in China). (c) TEM image of an individual Fe3O4 petal-like nanoslice (inset shows high-magnification TEM image of an individual nanoslice), (d) HRTEM image and (e) SAED pattern recorded from the rectangular part of the nanoslice in Fig. 4c. | |
Growth mechanism
In order to elucidate the formation process of the Fe3O4 peony structures, we carried out a time-dependent experiment during which samples were collected at different time intervals from the reaction mixture. The products obtained at different stages of the reaction were studied using the SEM technique. As shown in Fig. 5a, at the early stage (1 h), the sample is composed of a mixture of ca. 200–300 nm nanocubes and truncated nanocubes. The samples collected 5 h later (Fig. 5b) show ca. 400 nm octahedra as well as ca. 200 nm nanocubes. At the same time, the amount of octahedra increases at the expense of the nanocubes. As the reaction time proceeds to 10 h (Fig. 5c), the octahedra aggregate into 3D structures and the morphology becomes flowerlike. The entirely self-assembled 3D peony structures obtained after 20 h of reaction are shown in Fig. 5d. The whole evolution process is illustrated in Fig. 5e. In this formation process, time is the most important controlling factor. By preparing at different stages, we can easily obtain three kinds of samples: (1) nanocubes and truncated nanocubes; (2) octahedra; (3) 3D peony structures. Such a process is consistent with previous reports of a so-called two-step growth process, which involves the initial nucleation and a subsequent growth stage, self-assembly and secondary growth stage.20 In our experiment, N(CH2CH2OH)3 molecules first coordinate with Fe3+ and Fe2+ ions to produce iron alkoxides, which precipitate to become the nuclei and crystallize as nanocubes because of their highly symmetric cubic structure. At the growth stage, the growth rates on different facets are determined by the surface energy, and the general sequence for the surface energies of magnetite structure is γ{111} < γ{100} < γ{110}.21 On the basis of the surface free energy minimization principle, the fcc structure with six {100} facets, which have relatively high surface energies, is a less stable morphology. The growth rate along the (100) plane is faster than along the (111) plane, so the (100) plane will be gradually decreased. Thus, the octahedra enclosed by (111) planes are formed by increasing the reaction time. In the following secondary growth stage, the octahedra aggregate into 3D micrometer structures that become the core of the peony structures. As the aging time increases, part of the corners and edges of the 3D microcrystals dissolve into smaller nanocrystals, which minimizes the surface energy. A surface recrystallization process takes place. Crystal growth then follows, and 3D micrometer structures continue to grow by combining with dissolved and remaining small nanocrystals, finally forming the peony structures. The surfaces of the petals in the peony structures are very smooth, probably due to Ostwald ripening.22
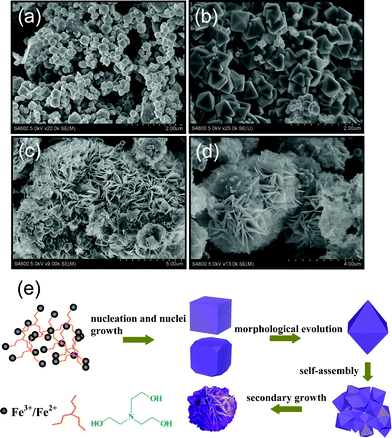 |
| | Fig. 5 SEM images of Fe3O4 products collected for different time intervals of (a) 1, (b) 5, (c) 10 and (d) 20 h. (e) Schematic illustration of the formation process of the Fe3O4 peony structures. | |
The role of N(CH2CH2OH)3 is found to be critical in this synthesis method. In a control experiment, when no N(CH2CH2OH)3 is added under the same reaction conditions, Fe3O4 nanoparticles approximately 15 nm in size are observed by TEM (Fig. S3, ESI†) because of the strong hydrolysis reaction. In a solution-phase synthetic process, organic or inorganic additives are often used to alter the surface energies through adsorption or chemical interaction, and thus new shapes of the particles come into being. In this case, N(CH2CH2OH)3 is used as a chelating agent and morphology controller. In aqueous solution, hydroxy groups can form complexes with iron cations through coordination interaction, which greatly decreases the free ion concentration in solution. Such a low concentration of iron cations leads to a relatively slow nucleation rate and facilitates the growth of Fe3O4 nanocrystals in view of the dynamic process. During the growth stage, nanosized octahedra self-assemble together to form 3D micrometer structures because of the hydrogen-bonding and electrostatic effects of the N(CH2CH2OH)3 anions. Therefore, Fe3O4 peony structures are obtained.
The mechanism for the formation of the final morphology by interaction between primary particles remains of interest to material chemists, although many kinds of 3D flower-like structures have been reported.16,17,23 In fact, the mechanism for the formation of the 3D flowerlike structures is very complicated because several factors, including crystal-face attraction, electrostatic and dipolar fields associated with the aggregate, van der Waals forces, hydrophobic interactions, and hydrogen bonds, have various effects on the self-assembly.24 Further work is underway to investigate the details of the self-assembly mechanism.
Magnetic properties
Fig. 6a shows the M–H loop for the Fe3O4 peony structures measured at 295 K. The sample exhibits a symmetric loop and ferrimagnetic behaviour, with saturation magnetization (Ms) of 88.4 emu g−1, remanent magnetization (Mr) of 13.3 emu g−1 and coercivity (He) of 112 Oe. The ferrimagnetic behaviour of the Fe3O4 peony structures is expected because their size (3–4 μm) already exceeds the critical size of single magnetic domains.25 The saturation magnetization value is close to the value of bulk magnetite (92 emu g−1) as has been reported already elsewhere.26 The observed high saturation magnetization value can be explained by the high crystallinity of the products. In addition, the large surface-to-volume ratio of nanoslices contributes to the only slightly reduced magnetization compared to 92 emu g−1. The as-prepared Fe3O4 peony sample responds strongly to an external magnetic field. Solid material could be quickly separated from the dispersion by holding the sample close to a commercial magnet, as shown in Fig. 6b. After about ten seconds, the products can be entirely separated from the aqueous solution, indicating that it is possible to manipulate these magnetic peony particles by an external magnetic field.
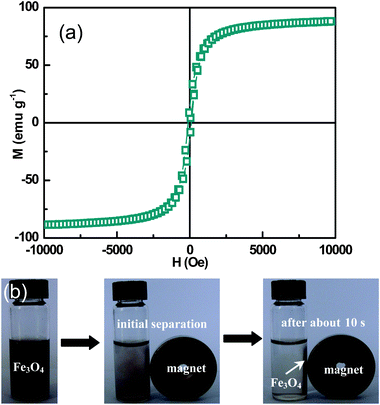 |
| | Fig. 6 (a) Magnetic hysteresis curve of the Fe3O4 peony structures measured at 295 K. (b) Photographs of as-prepared Fe3O4 peony sample dispersed in water (left), initially separated by an external magnet (middle), and response to a magnet after about 10 s (right). | |
Electronic transport studies were carried out with the Fe3O4 peony structures. Fig. 7a shows the I–U curve recorded at 295 K. It is noted that the sample exhibits nonlinear feature for the I–U curve, indicating the typical intergranular tunneling conductance mechanism.27 Due to spin-polarized transport across the structural domains in Fe3O4, negative magnetoresistance (MR) has also been observed in the Fe3O4 peony structures (Fig. 7b). The MR ratio was recorded at different temperatures while a perpendicular magnetic field was double swept between B = ±1.0 T. An MR ratio of ∼−2.0% is observed at 295 K when a magnetic field of B = ±1.0 T is applied. Fig. 8 shows the temperature dependence of MR ratio in an applied magnetic field of 1.0 T for the Fe3O4 peony structures. The MR monotonically increases with the decreasing temperature. This is understandable, as decreasing the temperature improves the alignment in the magnetic domains and also increases the degree of spin polarization near the Fermi level, and then contributes to an increase in the MR. In addition, there is a Verwey transition in magnetite, which is characterized by an increase in resistivity at the transition temperature TV ∼ 120 K. In our measurements, the MR ratio increases with decrease of temperature above the Verwey transition; however, it decreases below the transition temperature. The drop of MR ratio below the Verwey point may be attributed to the rapid increase in the resistance of magnetite, which diminishes the spin-dependent tunneling current.28 The electrical and magnetic results for the Fe3O4 peony sample suggest promising applications in magnetic devices and electrochemical energy production.
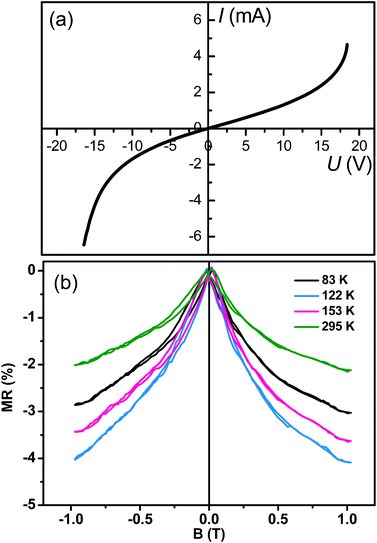 |
| | Fig. 7 (a) I–U curve of the Fe3O4 peony structures measured at 295 K. (b) Magnetoresistance as a function of magnetic field for the Fe3O4 peony structures measured at different temperatures. | |
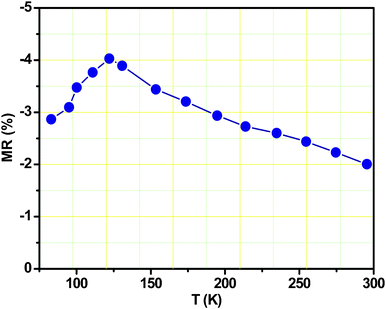 |
| | Fig. 8 Temperature dependence of MR ratio in an applied magnetic field of 1.0 T for the Fe3O4 peony structures. | |
Water treatment properties
Many reports have proved that iron oxide nanomaterials have the ability to remove toxic ions and organic pollutants from water, and these materials show higher removal capacities than bulk material.17a,29 Because of their novel 3D hierarchical and porous structure, we expected that the as-obtained Fe3O4 materials from this experiment would be useful in water treatment. Nitrogen adsorption isotherms show that the Brunauer–Emmett–Teller (BET) specific surface area of the Fe3O4 peony structures is about 60 m2 g−1. The high BET surface area is beneficial for adsorption and various catalytic reactions. In addition, the micrometer size and excellent magnetic properties of the Fe3O4 peony structures can lead to the efficient recovery of our Fe3O4 sample by a simple magnetic separation. Herein, we used the as-obtained Fe3O4 peony materials to investigate their application in waste-water treatment. Chromium ions are considered as a primary highly toxic pollutant in water sources and their efficient removal from water is very important. The as-prepared Fe3O4 peony sample can remove nearly 90% of Cr(VI) ions, as confirmed by the adsorption rate curve and photographs at different times in Fig. 9. Fig. 9a shows the adsorption rate of Cr(VI) on the as-obtained Fe3O4 materials when 0.01 g of Fe3O4 sample is added to 7 mL chromium solution with an initial concentration of 8 mg L−1 at room temperature. The adsorption rate (Qt) of metal ions is determined using the following equation (at equilibrium Qe):where Co and Ct are the initial concentration and concentration of Cr(VI) ions in solution after time t, respectively (mg L−1). Most Cr(VI) ions can be removed by the Fe3O4 peony sample in a short time. The adsorption rate is about 0.82 in the first 10 min with a high rate of adsorption due to the high abundance of available active sites on the adsorbent. Then, the adsorption rate decreases due to the gradual decrease in number of active sites, and the equilibrium time is about 2 h, with the adsorption (Qe) reaching about 0.9. We should note that above 10 min, the faint yellow colour of Cr(VI) remains unchanged as shown in Fig. 9b, indicating the most Cr(VI) ions in the solution should be removed by the Fe3O4 peony sample within 10 min. This result coincides well with the absorption curve.
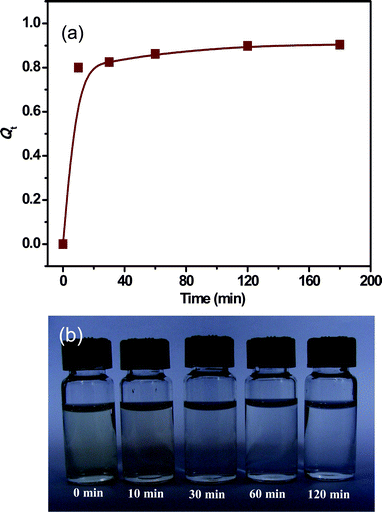 |
| | Fig. 9 (a) Adsorption of Cr(VI) on the as-prepared Fe3O4 peony sample at room temperature. (b) Photographs of absorption of Cr(VI) on Fe3O4 peony sample at different times. | |
The relationship between the removal ability of the material and the concentration of the contaminant solution can be illustrated by an adsorption isotherm. Fig. S4 (ESI†) shows the adsorption isotherm of Cr(VI) for the as-prepared Fe3O4 peony sample. The Langmuir adsorption model is employed for the adsorption analysis. Such a model is used to present the relationship between the amount of heavy metal adsorbed at equilibrium (qe, mg g−1) and the equilibrium solution concentration (Ce, mg L−1). The linearized form of this isotherm can be expressed as follows:30
| | | Ce/qe = (1/Qob) + (Ce/Qo) | (2) |
where
Qo (mg g
−1) and
b (L mg
−1) are constants related to the adsorption capacity and energy of
adsorption, respectively. Values of the Langmuir constants
Qo and
b are calculated from the slope and intercept, respectively, of plots of
Ce/
qevs.
Ce (Fig. S4, ESI
†). The
adsorption capacity of the Fe
3O
4 peony sample is measured as 5.24 mg g
−1. The
experimental data fits the Langmuir adsorption isotherm well, with correlation coefficient of 0.9919. The mechanism for the removal of the metal and anionic contaminant is proposed to involve surface complexation for minimizing the surface energy and ion exchange between the
iron oxide surface and the toxic ions in the aqueous solution.
31 The
adsorption capacities of various reported conventional adsorbents are listed in
Table 1.
17a,30,32 It is clear from
Table 1 that the adsorption capacity of the prepared Fe
3O
4 sample is significant in comparison with the other listed adsorbents. The better performances could be attributed to the highly porous structure and high surface area of the prepared Fe
3O
4 materials composed of thin nanoslices.
Table 1 Comparison of Cr(VI) adsorption capacities of some conventional adsorbents with the Fe3O4 peony sample
| Adsorbent |
Adsorption capacity/mg g−1 |
Ref. |
| Commercial α-Fe2O3 |
0.68 |
17a
|
| Commercial TiO2 |
2.42 |
17a
|
| Commercial CeO2 |
0.37 |
32
|
| Fe3O4 flower-like sample |
4.38 |
17a
|
| α-Fe2O3 flower-like sample |
4.47 |
17a
|
| Fe3O4 nanoparticles |
3.56 |
30
|
| Activated alumina |
1.6 |
30
|
| Sawdust |
3.6 |
30
|
| Spent activated clay |
1.5 |
30
|
| Fe3O4 peony sample |
5.24 |
This work |
The kinetics of Cr(VI) adsorption on the Fe3O4 peony sample is also examined at pH 3 with an initial concentration of 8 mg L−1. As shown in Fig. 10, Cr(VI) uptake increases quickly to 4.5 mg g−1 in the first 10 min. Afterward, the Cr(VI) uptake increases only slightly and a final value of 5.0 mg g−1 is reached after 3 h. The pseudo-first order and pseudo-second-order kinetic models are applied to fit the Cr(VI) adsorption data. The pseudo-first-order model is described as follows:33
where
qe and
qt are the amount of Cr(
VI) adsorbed per unit mass of the absorbent (mg g
−1) at equilibrium and time
t (min), respectively, and
k1 is the rate constant of
adsorption (min
−1). The pseudo-second-order model can be expressed as:
33where
k2 is the rate constant of the pseudo-second-order equation (g mg
−1 min
−1). The equilibrium value of
qe and rate constant of these two kinetic models are obtained by using nonlinear regression and shown in
Table 2. It seems that the pseudo-second order kinetic model fitted the data better according to the higher correlation coefficient (
R2).
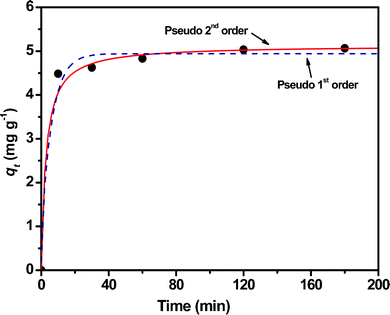 |
| | Fig. 10 Plots of adsorbed capacity vs. time for the adsorption kinetics of Cr(VI) on the Fe3O4 peony sample at room temperature, pH = 3 and the initial concentration of Cr(VI) ions is 8 mg L−1. | |
Table 2 Kinetics parameters of Cr(VI) adsorption on the Fe3O4 peony sample at room temperature
| Kinetic model |
Parameter constant |
Value |
| Pseudo-first-order |
q
e/mg g−1 |
4.15 |
|
k
1/min−1 |
0.158 |
|
R
2
|
0.9957 |
| Pseudo-second-order |
q
e/mg g−1 |
5.13 |
|
k
2/g mg−1 min−1 |
0.073 |
|
R
2
|
0.9998 |
Conclusions
In summary, we report, for the first time, one-step synthesis of self-assembled Fe3O4 peony structures with petal-like nanoslices through a simple and environmentally friendly aqueous process. The chelating agent, N(CH2CH2OH)3 is the key factor and results in the growth of superstructures of nanoslices. Our study may provide a new method for direct synthesis of transition-metal oxides with 3D superstructures and related functional materials. The obtained magnetic magnetite exhibits a ferrimagnetic behaviour with high saturation magnetization. Negative low-field magnetoresistance is found with the best MR ratio of ∼−2.0% at 295 K. The as-prepared Fe3O4 peony materials show an excellent ability to remove heavy-metal Cr(VI) ion pollutant in waste-water treatment. This study suggests that the Fe3O4 peony structures can serve as a candidate for many magnetic, industrial treatment and related applications.
Acknowledgements
The authors acknowledge financial support from National Natural Science Foundation of China (Nos. 20701013 and 20801016), Natural Science Foundation of Heilongjiang Province, China (LC201030), Scientific Foundation of Harbin City (RC2011LX017002), Fundamental Research funds for the Central Universities (HEUCF201210010), Foundation of State Key Laboratory of Rare Earth Resource Utilization (RERU2011013).
References
-
(a) S. Park, J. H. Lim, S. W. Chung and C. A. Mirkin, Science, 2004, 303, 348–351 CrossRef CAS;
(b) R. F. Service, Science, 2005, 309, 95 CrossRef CAS;
(c) J. W. Long and D. R. Lorison, Acc. Chem. Res., 2007, 40, 854–862 CrossRef CAS;
(d) A. M. Cao, J. S. Hu, H. P. Liang and L. J. Wan, Angew. Chem., Int. Ed., 2005, 44, 4391–4395 CrossRef CAS;
(e) M. M. Shaijumon, E. Perre, B. Daffos, P. L. Taperna, J. M. Tarascon and P. Simon, Adv. Mater., 2010, 22, 4978–4981 CrossRef CAS;
(f) Y. H. Jun, D. G. Yu, M. C. George and P. V. Barun, J. Am. Chem. Soc., 2010, 132, 9958–9959 CrossRef CAS.
- F. Y. Cheng, C. H. Shu, Y. S. Yang, C. S. Yeh, C. Y. Tsai, C. L. Wu, M. T. Wu and D. B. Shieh, Biomaterials, 2005, 26, 729–738 CrossRef CAS.
-
(a) Z. Li, L. Wei, M. Y. Gao and H. Lei, Adv. Mater., 2005, 17, 1001–1005 CrossRef CAS;
(b) L. Y. Wang, J. Bao, L. Wang, F. Zhang and Y. D. Li, Chem.–Eur. J., 2006, 12, 6341–6347 CrossRef CAS;
(c) J. Xie, F. Zhang, M. Aronova, L. Zhu, X. Lin, Q. M. Quan, G. Liu, G. F. Zhang, K. Y. Choi, K. M. Y. Kim, X. L. Sun, S. K. Lee, S. H. Sun, R. Leapman and X. Y. Chen, ACS Nano, 2011, 5, 3043–3051 CrossRef CAS.
-
(a) U. Y. Jeong, X. W. Teng, Y. Wang, H. Yang and Y. N. Xia, Adv. Mater., 2007, 19, 33–60 CrossRef CAS;
(b) D. K. Pan, H. Zhang, T. Fan, J. G. Chen and X. Duan, Chem. Commun., 2011, 47, 908–910 RSC;
(c) S. L. Gai, P. P. Yang, P. A. Ma, D. Wang, C. X. Li, X. B. Li, N. Niu and J. Lin, J. Mater. Chem., 2011, 21, 16420–16426 RSC;
(d) S. L. Gai, P. P. Yang, C. X. Li, W. X. Wang, Y. L. Dai, N. Niu and J. Lin, Adv. Funct. Mater., 2010, 20, 1166–1172 CrossRef CAS;
(e) Z. H. Xu, C. X. Li, X. J. Kang, D. M. Yang, P. P. Yang, Z. Y. Hou and J. Lin, J. Phys. Chem. C, 2010, 114, 16343–16450 CrossRef CAS.
-
(a) J. L. Zhang, Y. Wang, H. Ji, Y. G. Wei, N. Z. Wu, B. J. Zuo and Q. L. Wang, J. Catal., 2005, 229, 114–118 CrossRef CAS;
(b) M. M. Ye, Q. Zhang, Y. X. Hu, J. P. Ge, Z. D. Lu, L. He, Z. L. Chen and Y. D. Yin, Chem.–Eur. J., 2010, 16, 6243–6250 CrossRef CAS.
- Z. M. Cui, L. Y. Jiang, W. G. Song and Y. G. Guo, Chem. Mater., 2009, 21, 1162–1166 CrossRef CAS.
- H. Zeng, J. Li, J. P. Liu, Z. L. Wang and S. H. Sun, Nature, 2002, 420, 395–398 CrossRef CAS.
-
(a) Z. Li, B. Tan, M. Allix, A. I. Cooper and M. J. Rosseinsky, Small, 2008, 4, 231–239 CrossRef CAS;
(b) M. Kim, Y. F. Chen, Y. C. Liu and X. G. Peng, Adv. Mater., 2005, 17, 1429–1432 CrossRef CAS;
(c) W. Thiessen, A. Dubavik, V. Lesnyak, N. Gaponik, A. Eychmüller and T. Wolf, Phys. Chem. Chem. Phys., 2010, 12, 2063–2066 RSC.
-
(a) C. R. De Silva, S. Smith, I. Shim, J. Pyun, T. Gutu, J. Jiao and Z. P. Zheng, J. Am. Chem. Soc., 2009, 131, 6336–6337 CrossRef CAS;
(b) H. Deng, X. L. Li, Q. Peng, X. Wang, J. P. Chen and Y. D. Li, Angew. Chem., Int. Ed., 2005, 44, 2782–2785 CrossRef CAS;
(c) C. Stefaniu, M. Chanana, D. Y. Wang, D. V. Novikov, G. Brezesinski and H. Möhwald, ChemPhysChem, 2010, 11, 3585–3588 CrossRef CAS.
-
(a) X. G. Wen, S. H. Wang, Y. Ding, Z. L. Wang and S. H. Yang, J. Phys. Chem. B, 2005, 109, 215–220 CrossRef CAS;
(b) J. Juárez, A. Cambón, A. Topete, P. Taboada and V. Mosquera, Chem.–Eur. J., 2011, 17, 7366–7373 CrossRef.
-
(a) Z. Q. Liu, D. H. Zhang, S. Han, C. Li, B. Lei, W. G. Lu, J. Y. Fang and C. W. Zhou, J. Am. Chem. Soc., 2005, 127, 6–7 CrossRef CAS;
(b) C. J. Jia, L. D. Sun, Z. G. Yan, L. P. You, F. Luo, X. D. Han, Y. C. Pang, Z. Zhang and C. H. Yang, Angew. Chem., Int. Ed., 2005, 44, 4328–4333 CrossRef CAS.
- L. Vayssieres, C. Sathe, S. M. Butorin, D. K. Shuh, J. Nordgren and J. H. Guo, Adv. Mater., 2005, 17, 2320–2323 CrossRef CAS.
- Y. W. Zhu, T. Yu, C. H. Sow, Y. J. Liu, A. T. S. Wee, X. J. Xu, C. T. Lim and J. T. L. Thong, Appl. Phys. Lett., 2005, 87, 023103–023105 CrossRef.
-
(a) L. J. Zhao, H. J. Zhang, Y. Xing, S. Y. Song, S. Y. Yu, W. D. Shi, X. M. Guo, J. H. Yang, Y. Q. Lei and F. Cao, Chem. Mater., 2008, 20, 198–204 CrossRef CAS;
(b) D. Kim, N. Lee, M. Park, B. H. Kim, K. An and T. Hyeon, J. Am. Chem. Soc., 2009, 131, 454–455 CrossRef CAS.
- L. H. Zhang, J. J. Wu, H. B. Liao, Y. L. Hou and S. Gao, Chem. Commun., 2009, 4378–4380 RSC.
- Z. H. Ai, K. J. Deng, Q. F. Wan, L. Z. Zhang and S. C. Lee, J. Phys. Chem. C, 2010, 114, 6237–6242 CAS.
-
(a) L. S. Zhong, J. S. Hu, H. P. Liang, A. M. Cao, W. G. Song and L. J. Wan, Adv. Mater., 2006, 18, 2426–2431 CrossRef CAS;
(b) X. Y. Li, Z. J. Si, Y. Q. Lei, X. N. Li, J. K. Tang, S. Y. Song and H. J. Zhang, CrystEngComm, 2011, 13, 642–648 RSC.
- I. Chamritski and G. Burns, J. Phys. Chem. B, 2005, 109, 4965–4968 CrossRef CAS.
- T. Fujii, F. M. F. Groot, G. A. Sawatzky, F. C. Voogt, T. Hibma and K. Okada, Phys. Rev. B: Condens. Matter, 1999, 59, 3195–3202 CrossRef CAS.
- R. C. Jin, G. Chen, Q. Wang, J. Pei, G. Wang and L. Wang, Eur. J. Inorg. Chem., 2010, 5700–5708 CrossRef CAS.
- L. Zhang, R. He and H. C. Gu, Mater. Res. Bull., 2006, 41, 260–267 CrossRef CAS.
- Y. Chen, Y. S. Wang, Y. H. Zheng and Y. Qin, J. Phys. Chem. B, 2005, 109, 11548–11551 CrossRef.
-
(a) M. Liu, L. Y. Piao, W. M. Lu, S. T. Ju, L. Zhao, C. L. Zhou, H. L. Li and W. J. Wang, Nanoscale, 2010, 2, 1115–1117 RSC;
(b) S. H. Xuan, F. Wang, X. L. Gong, S. K. Kong, J. C. Yu and K. C. F. Leung, Chem. Commun., 2011, 47, 2514–2516 RSC;
(c) L. L. Cai, P. M. Rao and X. L. Zheng, Nano Lett., 2011, 11, 872–877 CrossRef CAS;
(d) R. Klajn, A. O. Pinchuk and B. A. Grzybowski, Small, 2008, 4, 1635–1639 CrossRef.
-
(a) G. M. Whitesides and M. Boncheva, Proc. Natl. Acad. Sci. U. S. A., 2002, 99, 4769–4774 CrossRef CAS;
(b) Y. Politi, T. Arad, E. Klein, S. Weiner and L. Addadi, Science, 2004, 306, 1161–1164 CrossRef CAS;
(c) H. Colfen and S. Mann, Angew. Chem., Int. Ed., 2003, 42, 2350–2365 CrossRef;
(d) H. Colfen and M. Antonietti, Angew. Chem., Int. Ed., 2005, 44, 5576–5591 CrossRef.
- R. E. Dunin-Borkowski, M. R. McCartney, R. B. Frankel, D. A. Bazylinski, M. Pósfai and P. R. Buseck, Science, 1998, 282, 1868–1870 CrossRef CAS.
-
B. D. Cullity and C. D. Graham, in Introduction to Magnetic Materials, IEEE Press/John Wiley & Sons, Inc., Hoboken, NJ, 2009 Search PubMed.
- K. M. Kant, K. Sethupathi and M. S. R. Rao, J. Appl. Phys., 2008, 103, 07F318 CrossRef.
- W. Wang, M. Yu, M. Batzill, J. He, U. Diebold and J. Tang, Phys. Rev. B: Condens. Matter Mater. Phys., 2006, 73, 134412 CrossRef.
-
(a) P. Li, D. E. Miser, S. Rabiei, R. T. Yadav and M. R. Hajaligol, Appl. Catal., B, 2003, 43, 151–162 CrossRef CAS;
(b) L. C. A. Oliveira, D. I. Petkowicz, A. Smaniotto and S. B. C. Pergher, Water Res., 2004, 38, 3699–3704 CrossRef CAS;
(c) R. C. Wu, J. H. Qu and Y. S. Chen, Water Res., 2005, 39, 630–638 CrossRef CAS;
(d) F. Herrera, A. Lopez, G. Mascolo, E. Albers and J. Kiwi, Appl. Catal., B, 2001, 29, 147–162 CrossRef CAS.
- Y. C. Sharma and V. Srivastava, J. Chem. Eng. Data, 2011, 56, 819–825 CrossRef CAS.
-
(a) G. A. Waychunas, C. S. Kim and J. F. Banfield, J. Nanopart. Res., 2005, 7, 409–433 CrossRef CAS;
(b) M. S. Onyango, Y. Kojima, H. Matsuda and A. Ochieng, J. Chem. Eng. Jpn., 2003, 36, 1516–1522 CrossRef CAS.
- J. S. Hu, L. S. Zhong, W. G. Song and L. J. Wan, Adv. Mater., 2008, 20, 2977–2982 CrossRef CAS.
- I. F. Nata, M. Sureshkumar and C. K. Lee, RSC Adv., 2011, 1, 625–631 RSC.
Footnote |
| † Electronic supplementary information (ESI) available: XPS and EDS results of Fe3O4 peony structures, TEM images of Fe3O4 nanoparticles synthesized without N(CH2CH2OH)3 under the same conditions and the adsorption isotherm of Cr(VI) ions for the as-prepared Fe3O4 peony structures. See DOI: 10.1039/c2ra01229d |
|
| This journal is © The Royal Society of Chemistry 2012 |
Click here to see how this site uses Cookies. View our privacy policy here. 
![[thin space (1/6-em)]](https://www.rsc.org/images/entities/char_2009.gif) 2p3/2 and Fe
2p3/2 and Fe![[thin space (1/6-em)]](https://www.rsc.org/images/entities/char_2009.gif) 2p1/2 are 710.8 and 725.1 eV, respectively. The unresolved shakeup satellite structures at the higher binding energy sides of the Fe
2p1/2 are 710.8 and 725.1 eV, respectively. The unresolved shakeup satellite structures at the higher binding energy sides of the Fe![[thin space (1/6-em)]](https://www.rsc.org/images/entities/char_2009.gif) 2p3/2 peak are fingerprints of the XPS spectrum of Fe3O4.19 Moreover, the broad Fe
2p3/2 peak are fingerprints of the XPS spectrum of Fe3O4.19 Moreover, the broad Fe![[thin space (1/6-em)]](https://www.rsc.org/images/entities/char_2009.gif) 2p signals are attributed to the coexistence of Fe3+ and Fe2+ states. These results prove the presence of Fe3+ and Fe2+ ions in the sample.
2p signals are attributed to the coexistence of Fe3+ and Fe2+ states. These results prove the presence of Fe3+ and Fe2+ ions in the sample.


