Controlled thermal decomposition of aromatic polyethers to attain nanoporous carbon materials with enhanced gas storage†
Israel
Cabasso
*,
Suoding
Li
,
Xinwei
Wang
and
Youxin
Yuan
The Michael Szwarc Polymer Research Institute and Department of Chemistry State University of New York—esf, Syracuse, NY 13210, USA. E-mail: icabasso@syr.edu
First published on 22nd February 2012
Abstract
Reported is the development of nanostructured synthetic carbon materials that have been synthesized by thermal-decomposition of aromatic rich polyethers: poly(ether ether ketone) (PEEK) and poly(2,6-dimethyl-1,4-phenylene oxide) (PPO). These polymer based nanostructured carbons are efficacious for gas adsorption and storage and have Brunauer–Emmett–Teller (BET) surface areas of more than 3000 m2 g−1, and average pore diameters of ≤20 Å. Surface area, pore characteristics, and other critical variables for selecting porous materials of high gas adsorption capacities are presented. Analysis of the fragments evolved under various carbonization temperatures, and the correlation between the activation and carbonization temperatures provides a mechanistic perspective of the pore evolution during activation. Correlations between gas (N2 and H2) adsorption capacity and porous texture of the materials have been established. The materials possess excellent hydrogen storage properties, with hydrogen storage capacity up to ∼7.0 wt% (gravimetric) and ∼42 g H2 L−1 (volumetric) at −196 °C and 4.5 MPa.
Introduction
The adsorption of small molecules in a porous material requires strict control and tuning of the synthesis and preparation of the porous structure. The structural design of porous materials has been studied for a variety of applications including: lithium batteries, electrical double layer capacitors, catalyst supports and molecular sieves. Numerous studies have shown the influence of the pore's parameters (such as, size and volume) on the adsorption of H2, CH4 and other gases. For example, narrow micropores <2 nm and a strong interaction between the pore walls play a crucial role in the effectiveness of hydrogen uptake.1–7 The hydrogen storage capacity has been an issue of concern to the U.S. DOE (as part of its fuel cell program) that helps to develop materials like MOFs, carbon-aerogels, zeolites and nanostructured synthetic carbons, all with a reported surface area of >3000 m2 g−1. In this regard the thermal conversion of organic polymers into a porous synthetic carbon with high surface area, drew our attention. While many polymers can be converted to porous material or carbonated species, our interest has been focused on aromatic polymers.3,4,7 The general concept is to take advantage of the fact that aromatic polymer precursors are carbon rich (∼80 wt%) and in which the aromatic rings are regularly structured as the building blocks of the macromolecular chain.1,4,7 The chemical structures of such aromatic rich polyethers: PPO [poly(2,6-dimethyl-1,4-phenylene oxide)], and PEEK [poly(ether ether ketone)], are shown below.Both polymers are commercial thermo-plastics, and are excellent precursor candidates to be tailored into highly porous materials upon thermal-decomposition. Several conditions have to be met in order to realize a high yield material conversion. The most important of these is avoiding excessive chemical or thermal degradation of the polymer in the carbonization step. Chemical crosslinking, and/or induction of a high crystalline fraction, have shown to be very effective in retaining aromatic rich carbon structures. PEEK is a semicrystalline polymer, comprised of a rigid benzene ring structure connected by keto- and ether- linkages, showing a weak glass transition signal at Tg ∼140–150 °C, and a high melting temperature Tm ∼339 °C ascribed to the ∼27% crystalline structure. PEEK's highly crystalline fraction allows carbonization to take place with a high material yield and without extensive pretreatment (e.g., crosslinking) of the polymer. PPO, however, a linear amorphous polymer with a high glass transition temperature (Tg ∼230 °C), needs to be thermally or chemically crosslinked before the thermal decomposition process.
Carbonization into a highly porous material is a multistep process. In this study the decomposition of the polymer is done primarily in two stages, carbonization followed by activation. In our previous study,1 we investigated the surface morphology and the pore development mechanism of activated PPO–carbon materials. The results indicated that at the early stage of activation the pore size distribution is broad. As the activation proceeds, the population of micropores (<2 nm), micropore volume, and the surface area increase significantly.1,8,9 We recognized however, that in order to produce porous materials with the desired properties, analysis and identification of the parameters that control the thermal decomposition process is required for optimization of the polymer–carbon synthesis.
Thus, analysis of the fragments evolved from the PPO and PEEK under various carbonization temperatures was performed by applying pyrolytic mass spectroscopy (Py-MS) techniques throughout the thermal decomposition. Further correlation between the activation and carbonization temperatures is also reported here. This provided us with a mechanistic perspective of the pore evolution during activation that could be correlated between the gas adsorption capacities and the porous texture of the materials (i.e., surface area, pore volume and pore size).
Based on this finding, unique morphologies of polymer based carbon materials which have been characterized by high surface area (up to ∼3400 m2 g−1), high micropore volume (up to ∼1.3 cm3 g−1) and a very narrow pore size distribution were tailored. The hydrogen adsorption capacities (at 4.5 MPa and −196 °C) were obtained as high as ∼7.0 wt% (gravimetric) and 42 g H2 L−1 (volumetric).
Experimental
Materials
Polymers: commercial grade powder poly(ether ether ketone) (PEEK, Victrex 450 P, Victrex USA Inc.), and poly(2,6-dimetyl-1,4-phenylene oxide) (PPO, GE, Mw of 350![[thin space (1/6-em)]](https://www.rsc.org/images/entities/char_2009.gif) 000 and Mn of 47
000 and Mn of 47![[thin space (1/6-em)]](https://www.rsc.org/images/entities/char_2009.gif) 000) were used without further purification. Compressed nitrogen (Haun Welding Supply, Inc.) was used in the carbonization and activation of carbon. 5N purity nitrogen was used to measure the surface characteristics and pore structure. 5N purity hydrogen was used for H2 adsorption measurement. Potassium hydroxide (97%, Mallinckrodt Baker, Inc.) was used as the activation agent.
000) were used without further purification. Compressed nitrogen (Haun Welding Supply, Inc.) was used in the carbonization and activation of carbon. 5N purity nitrogen was used to measure the surface characteristics and pore structure. 5N purity hydrogen was used for H2 adsorption measurement. Potassium hydroxide (97%, Mallinckrodt Baker, Inc.) was used as the activation agent.
Characterization
The carbonization behavior of polymers was investigated with a thermogravimetric analyzer (TGA 2950 TA Instrument®) and Py-MS technique (direct pyrolysis in a high temperature probe (Model HPP4, SIS®) which was fitted into the ionization chamber of a HP5989B mass spectrometer). The thermogravimetric data was obtained at a heating rate of 10 °C min−1 in a nitrogen atmosphere. The Py-MS analysis was conducted by loading ∼1–2 mg of polymer powder into the tip of the quartz probe, followed by direct insertion into the mass spectrometer. The probe was heated at a rate of 10 °C min−1 from 50 °C to 700 °C (monitored by a PC-2 temperature controller). The thermal degradation products diffused into the ionization chamber of the mass analyzer (10−6–10−7 mmHg vacuum), and data was collected in a mass scan range of m/z ∼16–1000.Wide angle X-ray diffraction (WAXD) of the polymer–carbon powders was conducted on a Rigaku MD-200 instrument using Cu–Kα radiation (λ = 0.15406 nm) at 50 kV and 100 mA in a fixed slit mode, with a step size of 0.05°.
High resolution transmission electron microscopy (HRTEM) images were acquired in a Hitachi HF 2000 transmission electron microscope operated at 200 kV. The sample was dissolved in methanol, sonicated and dispersed onto a Formvar C film. The images were acquired on an Orius SC 1000 CCD Camera with a pixel resolution of 3072 × 2072.
The porous textures of the carbons were analyzed by physisorption of N2 at −196 °C, on an Autosorb-1C station and a NOVA 1200 Gas Sorption Analyzer (Quantachrome®). Prior to the measurements, the specimens were degassed at 300 °C in ∼10−3 mmHg vacuum for at least 3 h. The BET surface area (SBET) was determined from nitrogen sorption data in the relative pressure range of P/P0 ∼10−4–10−1, while the micropore volume (Vmp) and the average micropore diameter (dDR) were estimated by linear fitting of a Dubinin–Radushkevich (DR) plot in the relative pressure range of P/P0 ∼10−6–10−1. Total pore volume was calculated from the adsorption at P/P0 ∼1. The pore size distribution was derived from nitrogen isotherms using the quenching solid density function theory (QSDFT) (Quantachrome® Software Autosorb V1.54).
Hydrogen uptake assessment
The hydrogen storage capacity was determined on an Autosorb-1 analyzer at −196 °C over the pressure range of 0–0.1 MPa in cryogenic temperatures (liquid nitrogen). Samples (0.2–0.3 g) were degassed at 300 °C under 10−3 mmHg vacuum for at least 3 h before loading into the analysis station. High pressure hydrogen uptake was performed using both the gravimetric and volumetric methods over the pressure range 0–4.5 MPa at −196 °C. The volumetric analysis was determined using Sievert's method with approximately 0.5–1.0 g samples. The gravimetric capacity, WH2 (g H2.ad 100 g−1 carbon), was determined by using the maximum hydrogen sorption data. Volumetric capacity, VH2 (g H2 L−1 carbon), was calculated from the product of the materials-based gravimetric capacity, WH2, and the density of the materials (g mL−1). The skeleton density of activated carbons was taken as the density of graphite ∼2.2 g mL−1.10Carbon preparation
PEEK powder was thermally oxidized in air for 15 h at 320 °C. Subsequently, the polymer was carbonized in a nitrogen atmosphere at a heating rate of 10 °C min−1 to the final carbonization temperature Tc (550 °C–1100 °C, Table 1). The carbon was maintained at Tc for 2 h under a nitrogen stream (20 L min−1). For activation, the carbon that was prepared at different carbonization temperatures was pulverized and ground with potassium hydroxide (KOH![[thin space (1/6-em)]](https://www.rsc.org/images/entities/char_2009.gif) :
:![[thin space (1/6-em)]](https://www.rsc.org/images/entities/char_2009.gif) carbon molar ratio ∼0.2
carbon molar ratio ∼0.2![[thin space (1/6-em)]](https://www.rsc.org/images/entities/char_2009.gif) :
:![[thin space (1/6-em)]](https://www.rsc.org/images/entities/char_2009.gif) 1.0–1.4
1.0–1.4![[thin space (1/6-em)]](https://www.rsc.org/images/entities/char_2009.gif) :
:![[thin space (1/6-em)]](https://www.rsc.org/images/entities/char_2009.gif) 1.0). This paste was activated in a nitrogen-purged furnace under the following conditions: 150 °C held for 0.5 h, and ramped to the final activation temperature (Ta ∼650 °C–850 °C), held at Ta for 2 h, with heating rate 10 °C min−1. The activated carbon was washed thoroughly with deionization water and dried in a vacuum oven at 80 °C for at least 12 h. The preparation procedure of the carbon from PPO was described in our previous report.1
1.0). This paste was activated in a nitrogen-purged furnace under the following conditions: 150 °C held for 0.5 h, and ramped to the final activation temperature (Ta ∼650 °C–850 °C), held at Ta for 2 h, with heating rate 10 °C min−1. The activated carbon was washed thoroughly with deionization water and dried in a vacuum oven at 80 °C for at least 12 h. The preparation procedure of the carbon from PPO was described in our previous report.1
| Sample | T c (°C)a | SBET (m2 g−1) | L DR (Å)a | Yield (wt%) | L a (Å)a | L c (Å)a | d 002 (Å)a | X-ray parallelism indicator R | |
|---|---|---|---|---|---|---|---|---|---|
| a L a—mean layer diameter; Lc—stack thickness; d002—interlayer spacing, determined from X-ray diffraction; LDR—pore width determined by N2 isotherm; Tc—carbonization temperature. | |||||||||
| CPK-550 | 550 | — | — | 67 | 20.6 | 7.9 | 4.41 | 1.38 | |
| CPK-600 | 600 | 405 | 9.7 | 58 | 20.8 | 8.0 | 4.30 | 1.30 | |
| CPK-700 | 700 | 474 | 10.2 | 54 | 22.3 | 8.6 | 4.08 | 1.44 | |
| CPK-850 | 850 | 518 | 11.9 | 51 | 32.1 | 8.6 | 3.90 | 1.71 | |
| CPK-1000 | 1000 | 368 | 10.0 | 51 | 33.5 | 8.9 | 3.89 | 1.73 | |
| CPK-1100 | 1100 | 90 | 6.8 | 50 | 36.2 | 9.2 | 3.90 | 1.71 | |
All the carbons were tested for durability at elevated temperatures up to 350 °C, 150 h. No surface structure change was detected. The activated carbons were also tested periodically (over the course of two years) for hydrogen adsorption. No noticeable change in hydrogen uptake was found over a pressure range of 0.1 MPa to 6 MPa.7
Results and discussions
Formation and characterization of carbon material
The carbonization of PEEK and PPO was investigated by TGA and Py-MS techniques that often were run concurrently (Fig. 1). The decomposition of PEEK starts at ∼510 °C and reaches the maximum at ∼574 °C, as revealed by the derivative TGA (DTG) curve. The main decomposition occurs between 510 °C and 600 °C with approximately 40 wt% mass loss, an additional ∼13 wt% mass loss incurs up to 850 °C (Fig. 1A insert), resulting in a total carbon yield of ∼47 wt%.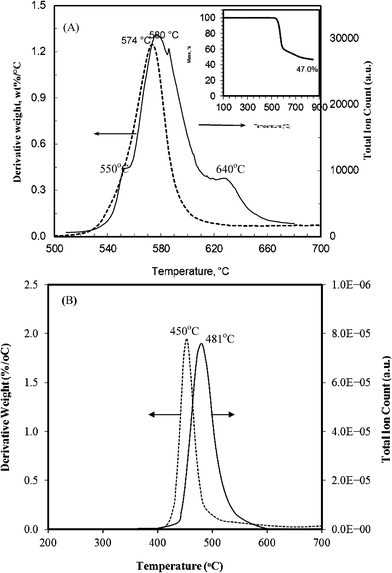 | ||
| Fig. 1 Comparison of DTG (dash line) and TIC (solid line) decomposition profiles of PEEK (A), and PPO (B). (Insert in (A) is TGA curve.) | ||
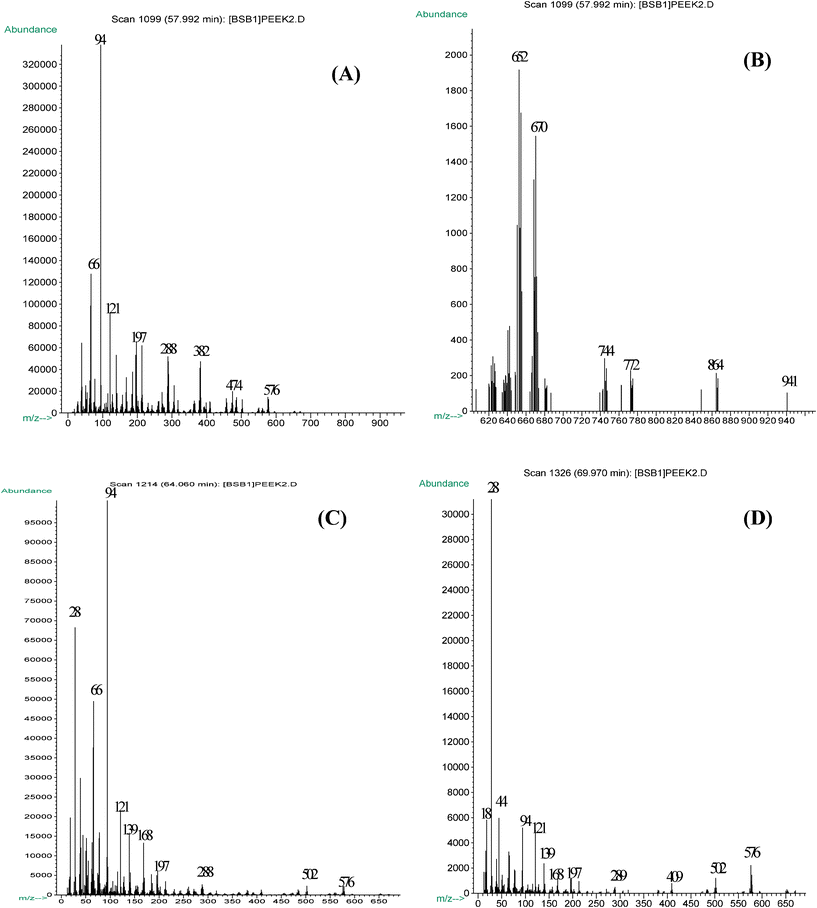
The total ion count (TIC) plot (Fig. 1A) exhibits a major decomposition peak at 580 °C and two shoulder peaks at 550 °C and 640 °C, suggesting that the decomposition of PEEK proceeds in three stages. The major decomposition pattern observed in the TIC plot is comparable to that revealed by the DTG curve. The slight shift that is observed at the higher temperatures is likely due to the dissimilar heat transfer in the high vacuum which was employed in the Py-MS experiment; in contrast TGA was operated under a nitrogen atmosphere. A similar phenomenon was observed for the thermal decomposition of PPO (Fig. 1B). The initial decomposition of the PEEK, below 550 °C (Supporting Information Fig. S1†), is characterized by three evolution products: a substantial amount of m/z 94 (phenol), along with m/z 121 (HOC6H5CO+) and m/z 168 (possibly dibenzofuran), as shown in the following:
The phenol is most likely a product of chain-end cleavage. The abundance of the phenol peak is much higher than that of the dimer ion m/z 576 (two repeat units), which implies that the cleavage of the chain end dominates the initial stages of PEEK decomposition. The appearance of benzofuran suggests that intra-chain crosslinking occurred at the very beginning of the decomposition (note that dibenzofuran appeared also during PPO decomposition.8)
The initial stage in which the formation of porous carbon particles of interest was recorded was marked at ∼580 °C (Fig. 2, A and B). Carbons which were collected at 580–600 °C (∼60% carbon yield) exhibit a much higher surface area ∼400 m2 g−1 (Table 1) compared to the pristine polymer powder, (SBET∼6 m2 g−1). At this temperature, the entire polymer material decomposes and converts to carbon.
The major decomposition products include: phenol (m/z ∼94), –CO–C6H4OH (m/z ∼121), –C6H4–CO–C6H4OH (m/z ∼197), and a modest portion of monomeric (M, m/z ∼288), and dimeric (M2, m/z ∼576) fragmental units. Very low amounts of other large fragments, M–C6H4OH (m/z ∼382), C6H5O–M–C6H4OH (m/z ∼474), as well as m/z 652, 670, 744, 772, 864, 941 were also detected. It should be pointed out that the secondary degradation of long chains are responsible, in part, for the abundance of fragments that are detected at or below m/z = 197. In addition, the series degradation and chain end scission contributes largely to the formation of small fragments.
The proposed thermal decomposition of PEEK, in a temperature range of 550–600 °C, follows a random chain scission mechanism where chain cleavage occurs primarily at six different positions as shown in Scheme 1.
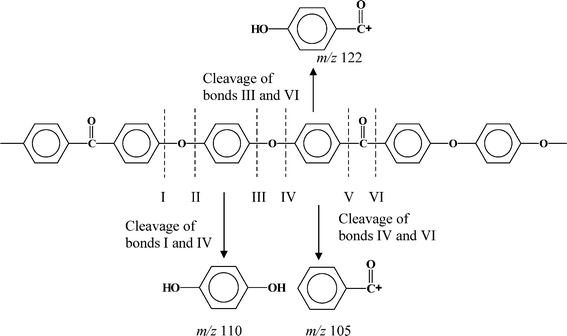 | ||
| Scheme 1 The possible cleavage positions of PEEK bonds. | ||
The abundance of each compound as recorded in the mass spectra at different temperatures allows a qualitative assessment of the relative strength of each bond under thermal conditions. Thus for example, the bond cleavage between: IV and VI, I and IV, III and VI generated the species, m/z 105, m/z 110 and m/z 121, respectively. The bond IV is more stable than III since the amount of m/z 121 generates more than m/z 105. The larger amount of the hydroquinone (m/z 110) compared to ion m/z 105 suggests the bond VI is more stable than bonds I and IV (since I and IV are equal in the molecular chain). Therefore, the carbonyl link (VI) is more stable than ether links (III and IV). This assessment indicates that the order of bond stability is: VI > IV > III and II (the later generates the phenol ion m/z 94). One possible reason for this difference in the cleavage of carbonyl versus ether linkages is the fact that the carbonyl group has a strong electronegative characteristic that can delocalize the p-electrons of the aromatic rings.11
Above 640 °C (Fig. 2C), the abundance of the large fragments (m/z 288–576) decreases, partially due to the crosslinking of the polymer chains. However, evolution of small species (m/z ≤ 168) remains relatively high. At the final decomposition stages, which are characterized by an additional mass loss of ∼10%, are likely due to the removal of dangling bonds, bridging moieties and edge functionalities of the nascent graphene sheets.
One of the most important features of this carbonization process is the retention of benzene rings as the building block of the matrix, an assessment which provides some insight into carbon formation and its morphological properties, which can be followed through the evolution of phenol (m/z 94) and carbon monoxide, CO (m/z 28) (Fig. 3). At 580 °C, phenol is the main pyrolysis product. At 640 °C, the abundance ratio of phenol to CO is ∼2, and decreases to ∼0.2 at 700 °C. The CO evolution increases above 620 °C, and reaches a maximum at ∼ 650 °C. Beyond 650 °C most of the benzene rings are part of the matrix, or embedded in a semicrystalline graphite array and the nascent porous carbon. The CO that is produced at high temperatures is primarily generated from the crosslinked structures.
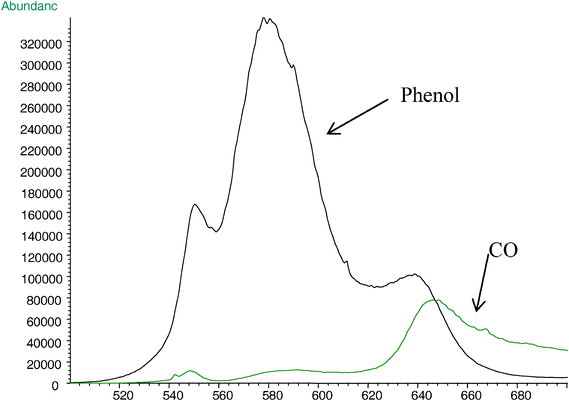 | ||
| Fig. 3 Single ion current profiles of decomposition products: phenol (m/z 94) and CO (m/z 28) in the pyrolysis of PEEK (heating rate is 10 °C min−1). | ||
The above observation points out the differences in the thermal degradation of PEEK during the carbonization process. A large amount of aromatic fragments can be generated and evolved as gas at relatively low temperatures. However, in order to obtain a high carbon yield and retain aromatic moieties in the product, control of the pyrolysis process and its kinetics is necessary. Some refinement of this process was achieved in the carbonization of PPO, this aromatic polyether is pyrolyzed almost completely into large volatile fragments at rather low temperatures, less than 500 °C (Fig. 1B); the formation of such fragments requires only sequential cleavage of two bonds along the macromolecular chain. A heavy crosslinking is called for in order to increase the number of bonds, and decreases the concentration of volatiles. A process was developed in which the polymer is crosslinked by oxygen, or air, near its glass transition temperature (Tg). In this process the crosslinking density is easily controlled by the oxidation time. This process does not alter the mechanism of the thermal-decomposition, but the chain scission process is restricted.1,9
Unlike the amorphous PPO, PEEK is a semicrystalline material with a wide distribution of crystallite sizes, which increases by annealing (at elevated temperatures and extended time), however, annealing also causes chemical crosslinking. Thus, annealing at 320 °C produces fluorenone-type structures formed through cyclization. The amount of these structures increases linearly with time. X-ray diffraction patterns of pre-crosslinked carbon matrices revealed that disordered carbons contain more organized carbon domains and randomly arranged single layer graphene sheets. The structural parameters of the domains (La—mean layer diameter, Lc—stacking thickness, calculated from Scherrer's equation12) are shown in Table 1, which exhibit that as the carbonization temperature Tc ascends from 550 °C to 1100 °C, the La and Lc progressively increase from ∼20 Å to ∼36 Å and ∼ 7.9 Å to 9.2 Å, respectively. It should be noted that uncertainties in assessing the true values of domain size13 render such an analysis limited due to defects and distortion of the crystal structure, size distribution, and the presence of “unorganized” carbon. Thus, the dimension parameters shown in Table 1 should only be used as statistically averaged reference values. Similar findings were observed by Emmerich who studied the graphitization behavior by heat treatment of coke,14 at temperatures <1100 °C. Under those conditions, the crystallite growth is mainly governed by incorporation of non-organized carbon into the existing graphite-like layers.
The amorphous region of carbon constitutes randomly arranged graphene fragments. Liu et al.15 defined an X-ray parallelism indicator R, to qualitatively estimate the single layer fraction of graphene sheets. R is the ratio of the height of the Bragg (002) reflection to the background, which originate from the constructive interference of parallel graphene layers, and the single layer scattering. For a disordered carbon that is entirely made of single layers, the Bragg (002) peak disappears, and therefore R = 1. Thus, carbon samples with high R values, ∼1.71–1.73, would have more of the aligned graphene layers and fewer single layer fractions, similar to our samples that were obtained at high carbonization temperatures (Tc ∼850–1100 °C, Table 1). Increased alignment of graphene sheets is suggested by the reduction of the interlayer spacing d002 from 4.4 to ∼3.9 Å (Table 1). This may be facilitated by the increased kinetic energy (with temperature) and the removal of interlayer defects. Thus, it appears that increasing the carbonization temperatures improves ordering in the structure resulting in larger carbon crystallites and more aligned graphene layers. The tendency towards greater graphitization has also been revealed by N2 adsorption analyses. The surface area and the average pore width of these carbons increase with the carbonization temperature up to Tc of 850 °C, to give SBET ∼520 m2 g−1 and LDR ∼12 Å, and then decreases to yield SBET ∼90 m2 g−1 and LDR ∼7 Å for 1100 °C (Table 1).
Not only carbonization temperature, but also activation processes can change the structure of the PEEK porous materials as evidenced by the decrease of the interlayer space (d002) from 4.08 Å of CPK-700 (non-activated) to 3.43 Å of APK-7 (activation with KOH![[thin space (1/6-em)]](https://www.rsc.org/images/entities/char_2009.gif) :
:![[thin space (1/6-em)]](https://www.rsc.org/images/entities/char_2009.gif) C 5
C 5![[thin space (1/6-em)]](https://www.rsc.org/images/entities/char_2009.gif) :
:![[thin space (1/6-em)]](https://www.rsc.org/images/entities/char_2009.gif) 1). The R values increased from 1.44 (CPK-700) to 1.7 (APK-7).
1). The R values increased from 1.44 (CPK-700) to 1.7 (APK-7).
The HRTEM images (Fig. 4) are in accordance with the XRD analysis of these materials. The non-activated carbon (CPPK-700) (Fig. 4A) is a highly porous amorphous structure containing inter-connected domains, with a great number of nanometre-size pores. After KOH activation (KOH![[thin space (1/6-em)]](https://www.rsc.org/images/entities/char_2009.gif) :
:![[thin space (1/6-em)]](https://www.rsc.org/images/entities/char_2009.gif) C is 3
C is 3![[thin space (1/6-em)]](https://www.rsc.org/images/entities/char_2009.gif) :
:![[thin space (1/6-em)]](https://www.rsc.org/images/entities/char_2009.gif) 1) (Fig. 4B), the densified structure remains largely amorphous but is accompanied by the formation of graphitic domains 2–4 nanometres in length (the arrow points to the (110) plane). The majority of pores are in the sub nm range and are inter-connected.
1) (Fig. 4B), the densified structure remains largely amorphous but is accompanied by the formation of graphitic domains 2–4 nanometres in length (the arrow points to the (110) plane). The majority of pores are in the sub nm range and are inter-connected.
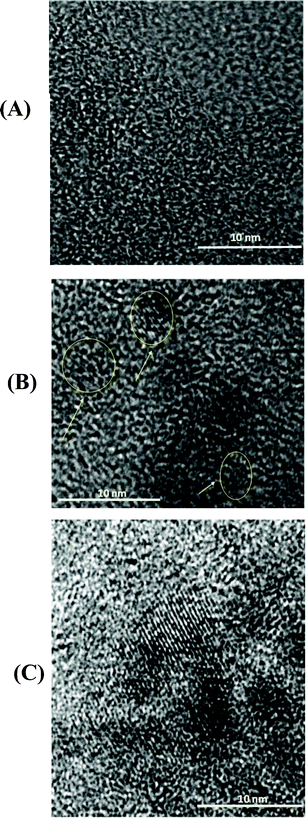 | ||
Fig. 4 HRTEM image of (A) unactivated PEEK carbon CPPK-700; (B) activated carbon with KOH![[thin space (1/6-em)]](https://www.rsc.org/images/entities/char_2009.gif) : :![[thin space (1/6-em)]](https://www.rsc.org/images/entities/char_2009.gif) C = 3 C = 3![[thin space (1/6-em)]](https://www.rsc.org/images/entities/char_2009.gif) : :![[thin space (1/6-em)]](https://www.rsc.org/images/entities/char_2009.gif) 1 (the arrow points to the (110) plane). (C) Activated carbon APK-7 with KOH 1 (the arrow points to the (110) plane). (C) Activated carbon APK-7 with KOH![[thin space (1/6-em)]](https://www.rsc.org/images/entities/char_2009.gif) : :![[thin space (1/6-em)]](https://www.rsc.org/images/entities/char_2009.gif) C = 5 C = 5![[thin space (1/6-em)]](https://www.rsc.org/images/entities/char_2009.gif) : :![[thin space (1/6-em)]](https://www.rsc.org/images/entities/char_2009.gif) 1. 1. | ||
At high degrees of activation (Fig. 4C), the carbon structure is further densified, and the degree of graphitization increased. This may be due to the reorganization of carbon layers after selective removal of amorphous carbon. The potassium derivatives react mainly with the amorphous carbon at these temperature ranges, while the organized packs of graphene sheets are relatively stable. XRD data and TEM images indicate that for both treatments, i.e., increased carbonization temperature and activation, the attack of the amorphous region is followed by the graphitic domain realignment in an ordered fashion. However, this phenomenon is different from that observed by Wang et al. In their case, more disordered graphene layer domains were detected after a high degree of activation.16
The carbon materials that were produced at different carbonization temperatures (Tc) exhibit different activation behaviors, leading to a change in the surface morphology of the final activated carbon products. Nitrogen adsorption isotherms of the activated carbons prepared at different carbonization temperatures are presented in Fig. 5. Note, since there is no perceptible hysteresis between the adsorption and desorption branches for any of these carbons, only the adsorption branch of the isotherms is shown here.
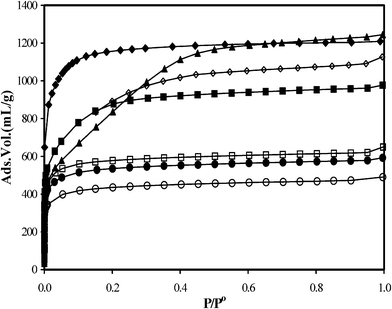 | ||
| Fig. 5 Nitrogen adsorption isotherms of activated carbons: APK-1 (◊); APK-2 (▲); APK-3 (■); APK-4(□); APK-5 (●), APK-6 (○) and APPO (◆) the isotherms were measured at 77 K. | ||
All the isotherms clearly show the Type-I sorption (IUPAC classification) with a sharp rise of nitrogen uptake at a relative pressure P/P0 ≤ 0.01, indicative of their microporous nature (similar plots characterize the PPO carbon1). The activated carbons APK-1 and APPO show nitrogen adsorption up to ∼1200 mL (STP) g−1. In contrast, structurally more ordered carbon like APK-6 exhibits the lowest nitrogen adsorption ∼400 mL (STP) g−1, indicating a modest pore development. Whereas, carbon that was produced at a low carbonization temperature (Tc), as shown in Table 2, has a much higher burnoff (loss of material during activation) than that prepared at high temperatures. This is not an unusual property of the materials, especially for those carbon samples that were carbonized below the activation temperature (800 °C in this case). However, it is of great importance in selecting the carbonized material, that when activated, it will yield a high surface area. The activated carbon APK-3, prepared at a carbonization temperature, Tc ∼700 °C, has the largest surface area (3100 m2 g−1) at a relatively low burnoff ∼33 wt%. In comparison, those derived from samples carbonized at higher Tc (i.e., 800 °C and above), for instance APK-4 and APK-5, possess lower surface areas.
| Samples | T c (°C) | T a (°C) | Burnoff (wt%) | SBET (m2 g−1) | V tp (mL g−1) | V mp (mL g−1) | d DR (Å) |
|---|---|---|---|---|---|---|---|
| APK-1 | 550 | 800 | 64 | 3030 | 1.75 | 1.20 | 19.1 |
| APK-2 | 600 | 800 | 55 | 3050 | 1.81 | 1.23 | 20.0 |
| APK-3 | 700 | 800 | 33 | 3100 | 1.51 | 1.23 | 18.7 |
| APK-4 | 850 | 800 | 28 | 2210 | 1.00 | 0.95 | 15.7 |
| APK-5 | 1000 | 800 | 26 | 2035 | 0.91 | 0.84 | 15.0 |
| APK-6 | 1100 | 800 | 26 | 1660 | 0.76 | 0.67 | 14.3 |
| APK-7 | 700 | 650 | — | 2406 | 0.91 | 0.75 | 16.8 |
| APK-8 | 700 | 700 | — | 2495 | 1.03 | 0.97 | 16.7 |
| APK-9 | 700 | 750 | — | 2591 | 1.20 | 1.13 | 17.9 |
| APK-10 | 700 | 850 | — | 2610 | 1.38 | 1.32 | 17.6 |
It is reasoned that a high carbonization temperature causes “heat induced structure ordering”,17–19 which increases the sizes of the carbon crystals (or semi-crystals) and lowers the fraction of amorphous structures. Meanwhile, the average micropore diameter (dDR) shows the reverse trend. For example, APK-5 has dDR ∼15 Å, as compared to APK-3 (dDR ∼18.7 Å). It should be born in mind that “pore diameter” and “surface area” are two critical parameters for selecting porous materials, including carbon, as gas adsorption storage candidates.
The pore size distribution (PSD) of these carbons is shown in Fig. 6. The activated carbons APK-1 (prepared at Tc = 550 °C) and APK-2 (prepared at Tc = 600 °C), exhibit a fairly broad PSD span from ∼6 Å to 35 Å. In comparison, the structurally more ordered APK-6 (prepared at Tc = 1100 °C) constitutes mostly micropores with an average pore width of 14.3 Å, much smaller than sample APK-2 (∼20 Å, Table 2).
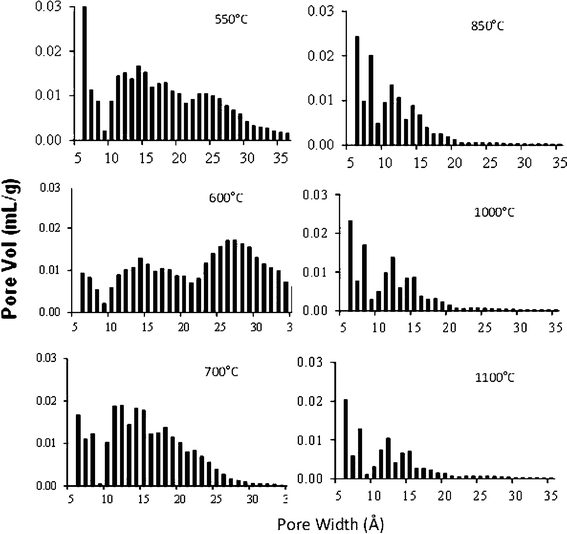 | ||
| Fig. 6 QSDFT pore size distribution of PEEK activated carbons prepared at different carbonization temperatures. All the carbons were prepared at same activation temperature 800 °C. | ||
Not only the carbonization temperature, but also the activation temperature impacts the porosity of the carbon. Fig. 7 illustrates the porous texture formation as a result of activating the carbon CPK-700 (SBET ∼520 m2 g−1 and dDR ∼12 Å) at elevated activation temperatures, Ta, 650–850 °C. Increasing the activation temperatures (up to 800 °C) broadens the PSD, and augments of the surface area and leads to a larger average pore diameter (Table 2). Thus, activated carbon (APK-7) that had been obtained at Ta ∼650 °C achieved dDR ∼16.8 Å and SBET ∼2400 m2 g−1, while those that were produced at higher temperatures, Ta upto 800 °C, yielded an increase of SBET to ∼3100 m2 g−1 and dDR to ∼19 Å (APK-3). Further increase of the activation temperature (e.g., 850 °C) leads to a surface area decrease and PSD contraction.
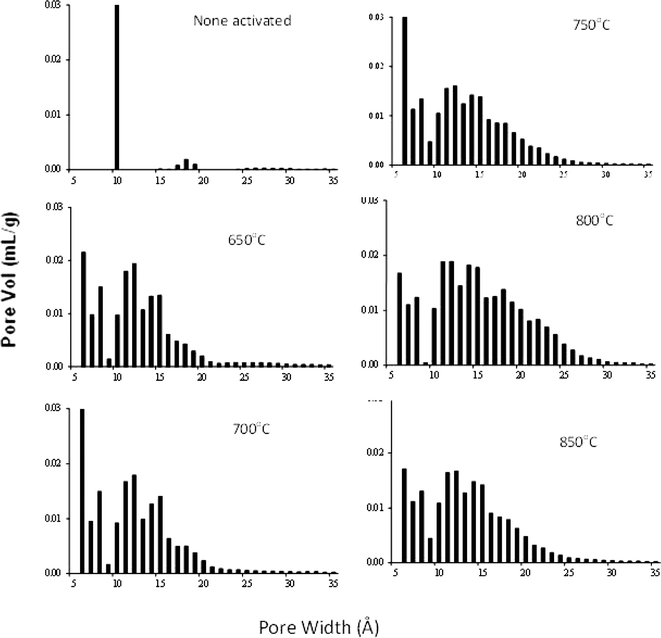 | ||
Fig. 7 QSDFT pore size distribution of PEEK carbons prepared at different activation temperatures. Activated carbons were prepared at KOH![[thin space (1/6-em)]](https://www.rsc.org/images/entities/char_2009.gif) : :![[thin space (1/6-em)]](https://www.rsc.org/images/entities/char_2009.gif) CPK700 = 1.2 CPK700 = 1.2![[thin space (1/6-em)]](https://www.rsc.org/images/entities/char_2009.gif) : :![[thin space (1/6-em)]](https://www.rsc.org/images/entities/char_2009.gif) 1 (mol 1 (mol![[thin space (1/6-em)]](https://www.rsc.org/images/entities/char_2009.gif) : :![[thin space (1/6-em)]](https://www.rsc.org/images/entities/char_2009.gif) mol). All the carbons were prepared at the same carbonization temperature 700 °C. mol). All the carbons were prepared at the same carbonization temperature 700 °C. | ||
Dai et al.20 had suggested earlier that below 700 °C the products of the activation agent KOH (e.g., K2CO3, K2O) are “less fluid and reactive”, which partially limits the activation at the small micropores’ surface. Above 730 °C, a more reactive liquid-phase potassium is being formed leading to a further developed and enhanced pore structure, and broadened porosity. However, this hypothesis remains a conjecture to be proven.
The large number of experimental data allows us to visualize the pore evolution process, through statistic correlation of the pore characteristic parameters of the carbon (SBET, dDR, Vmp, and PSD). Correlation of the surface area (SBET) with micropore volume (Vmp) of over 60 carbon specimens is given in Fig. 8. It shows that carbons with Vmp ≤ 1.0 cm3 g−1, SBET increase almost linearly with micropore volume, with a slope of approximately 2430 m2 mL−1. This value is very close to Stoeckli's estimation (∼2220 m2 mL−1)21 indicating that the surface area originates primarily from micropore walls. This is consistent with the fact that these carbons all exhibit Type-I nitrogen isotherms. At Vmp > 1.0 mL g−1, SBET increases with Vmp, but at progressively slower rates, probably due to the presence of large micropores.
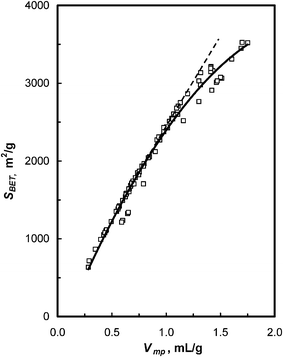 | ||
| Fig. 8 Plot of surface area (SBET) versus micropore volume (Vmp) of polymer-based carbons. | ||
The above correlation shows that surface area, SBET, could be used as an indicator for pore development progress (Fig. 9). Two opposite trends are observed: as SBET increases up to SBET < 1400 m2 g−1 (Stage I) dDR decreases down to ∼8 Å, however, as the activation progresses (SBET > 1400 m2 g−1, Stage II), dDR increases along with SBET up to 22 Å. Xing et al.22 studied the activation of petroleum-based carbon microbeads, and suggested that pore evolution involves dominant vertical pore development in the early stage, followed by the horizontal pore enlargement process. Following this hypothesis, it can be reasoned that during KOH activation of polymer-based carbon the small micropores, in particular sub-micropores (below 10 Å), are dominantly formed at the early stage, which would keep the average pore diameter small. As the activation proceeds, the density of small pores increased. Also, adjacent pore walls gradually burn off, resulting in an increase of the larger pore population.
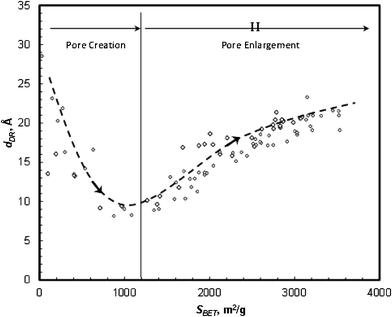 | ||
| Fig. 9 Correlation of pore diameter (dDR) versus surface area (SBET) of polymer-based carbons. | ||
This pore evolution mechanism was further explored by taking snapshots of pore size distribution at progressively increased burnoff (BO) of the carbons, as is delineated in Fig. 10. The non-activated carbon (BO ∼0%) exhibits a very low porosity (Vmp ∼0.2 cm3 g−1), with a PSD span from 6 Å to 18 Å. At low burnoff, BO < 33%, sub-micropores (below 10 Å) form almost exclusively. At BO > 40%, large micropores (10–20 Å) emerge, either by expansion of individual sub-micropores, or by the fusion of two or more sub-micropores; thus, broadening the pore size distribution. At this stage, the sub-micropore volume starts to decline, while large micropores and small mesopores (20–30 Å) increased significantly; indicating that the formation of new sub-micropores is progressively low while the average pore width continuously increased as the activation proceeded.
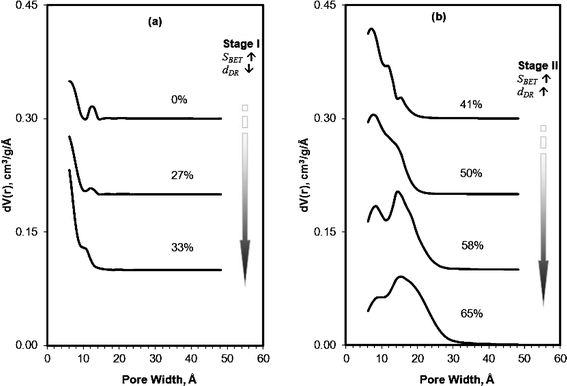 | ||
Fig. 10 QSDFT pore size distribution of PEEK carbons prepared with different burnoff. The burnoff was controlled by activation of CPK700 at increased KOH![[thin space (1/6-em)]](https://www.rsc.org/images/entities/char_2009.gif) : :![[thin space (1/6-em)]](https://www.rsc.org/images/entities/char_2009.gif) C ratios 0 C ratios 0![[thin space (1/6-em)]](https://www.rsc.org/images/entities/char_2009.gif) : :![[thin space (1/6-em)]](https://www.rsc.org/images/entities/char_2009.gif) 1, 1 1, 1![[thin space (1/6-em)]](https://www.rsc.org/images/entities/char_2009.gif) : :![[thin space (1/6-em)]](https://www.rsc.org/images/entities/char_2009.gif) 1, 2 1, 2![[thin space (1/6-em)]](https://www.rsc.org/images/entities/char_2009.gif) : :![[thin space (1/6-em)]](https://www.rsc.org/images/entities/char_2009.gif) 1, 3 1, 3![[thin space (1/6-em)]](https://www.rsc.org/images/entities/char_2009.gif) : :![[thin space (1/6-em)]](https://www.rsc.org/images/entities/char_2009.gif) 1, 4 1, 4![[thin space (1/6-em)]](https://www.rsc.org/images/entities/char_2009.gif) : :![[thin space (1/6-em)]](https://www.rsc.org/images/entities/char_2009.gif) 1, 8 1, 8![[thin space (1/6-em)]](https://www.rsc.org/images/entities/char_2009.gif) : :![[thin space (1/6-em)]](https://www.rsc.org/images/entities/char_2009.gif) 1, 12 1, 12![[thin space (1/6-em)]](https://www.rsc.org/images/entities/char_2009.gif) : :![[thin space (1/6-em)]](https://www.rsc.org/images/entities/char_2009.gif) 1 (w 1 (w![[thin space (1/6-em)]](https://www.rsc.org/images/entities/char_2009.gif) : :![[thin space (1/6-em)]](https://www.rsc.org/images/entities/char_2009.gif) w). The curves are offset by an interval of 0.10 cm3 g−1 Å−1 for clarity. w). The curves are offset by an interval of 0.10 cm3 g−1 Å−1 for clarity. | ||
Hydrogen uptake versus porous textures of activated carbons
The hydrogen adsorption capacity of these carbon materials (from 10−6 to 0.1 MPa, at −196 °C) was measured by the volumetric method. The correlation of the surface area with hydrogen storage capacity is illustrated in Fig. 11a. All the carbon samples that were used to construct this figure have been selected from a family of highly microporous and narrow micropore size distribution PEEK–carbons with SBET∼800–3300 m2 g−1, Vmp ∼0.6–1.7 cm3 g−1.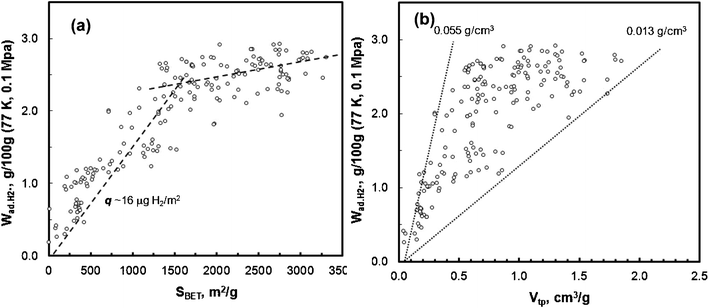 | ||
| Fig. 11 The relationships between hydrogen adsorption and: (a) BET surface area, and (b) total pore volume. (−196 °C and 0.1 MPa.) | ||
Two distinct regions are depicted in Fig. 11a. For carbons with SBET ≤ 1400 m2 g−1, hydrogen adsorption increases linearly with SBET, up to  ∼2.7 wt%, at an average surface coverage ∼16.0 μg H2 m−2 (the slope). A more modest increase with greater scatter of hydrogen uptake, was obtained for the carbons with higher surface area, SBET > 1400 m2 g−1; the overall hydrogen uptake reaches 2.95 wt%, which is close to that reported for the carbide-derived carbons (3.0 wt%).23 Recently, Thomas24 compared the hydrogen uptake of various nanostructured carbon adsorbents measured by various research groups25–30 (including single wall carbon nanotubes, multi-wall carbon nanotubes, carbon nanohorns, template ordered mesoporous carbon, nanofibers, carbide-derived carbons, and commercial activated carbons). These carbons exhibit a similar linear correlation of hydrogen uptake versus surface area, but with greater scatter in the data regardless of their origin. The impact of total pore volume on hydrogen uptake at −196 °C at 0.1 MPa is presented in Fig. 11b. The hydrogen uptake shows increases in pore volume, but with large scattering. The calculated hydrogen density in pores varies from 0.013 g cm−3 to 0.055 g cm−3, which is within the similar range of other types of nanostructured carbon materials (0.010–0.048 g cm−3).24
While hydrogen uptake shows a general upward trend with surface area and pore volume, these correlations are subjected to a wide data scattering, in particular for carbons with a high surface area and pore volume, which often exhibits a broadened pore size distribution. Therefore, the impact of pore size on hydrogen uptake efficiency was assessed by taking into consideration two normalized terms: hydrogen uptake per unit surface area, q, (μg H2 m−2) and adsorbed hydrogen density in the pores, ρH2 (μg H2 cm−3). The hydrogen density in the pores was calculated from dividing the total hydrogen uptake, Wad.H2 (gravimetric adsorption capacity) by the total pore volume, Vtp (determined by the nitrogen sorption).31Fig. 12a presents the correlation of hydrogen uptake per unit surface area with an average pore size. It reveals that q increases from ∼7.1 to 21.9 μg m−2 as dDR decreases from ∼22 to ∼8 Å. The highest hydrogen uptake, ∼21.9 μg m−2, is attained by carbons with dDR ∼8 Å, approaching the saturated monolayer hydrogen coverage on the carbon graphene sheet (22.8 μg m−2).32 Hydrogen density was found to increase as the pore size is reduced. The highest hydrogen density obtained was ∼0.055 g cm−3, below liquid hydrogen density, 0.071 g cm−3 (Fig. 12b). A recent study of coordination-framework materials on H2 adsorption by Lin et al.33 has shown a similar phenomenon. The computed hydrogen density confined in ideal slit pores as presented by Kowalczyk et al.5,34 (using the FH-GCMC method) is also shown in Fig. 12b (solid line). The experimental hydrogen density in this work was found to be higher than the computed value at the corresponding pore size. For example, the experimental hydrogen density in the pores of dDR ∼10 Å is 0.046 g cm−3, while the computed value is 0.031 g cm−3. The inherent heterogeneity of pore structure and the unaccounted pore volume that is inaccessible by the nitrogen sorption could produce this discrepancy. From the other point of view, Jagiello et al.35 predicted a substantially higher hydrogen density in small slit pores (below 7 Å) using the non-local density function theory. For example, in 0.3 nm; 0.4 nm; 0.5 nm; and 0.7 nm slit pores, the calculated H2 density is ∼0.08, ∼0.06, ∼0.054 and ∼0.046 g cm−3, respectively, which are more in line with our experimental values. The increased hydrogen uptake efficiency in small pores is ascribed to the enhanced hydrogen–carbon wall interaction.
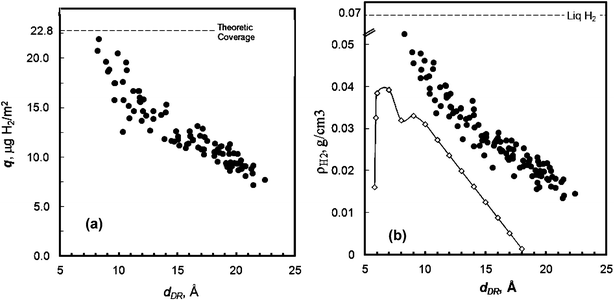 | ||
| Fig. 12 (a) Plot of hydrogen uptake per unit surface area versus pore size (−196 °C and 0.1 MPa.) (b) Hydrogen density in pores as a function of pore size. (•) Experiment data, (-◊-) computed density in ideal slit pores taken from Kowalczyk, et al.5,34 | ||
The hydrogen isotherms over a pressure range of 0–4.5 MPa, at −196 °C for selected highly microporous carbons (SBET ∼2000–3400 m2 g−1, Vmp ∼0.84–1.70 cm3 g−1, dDR ∼15.0–20.0 Å, see Table 3) are shown in Fig. 13.
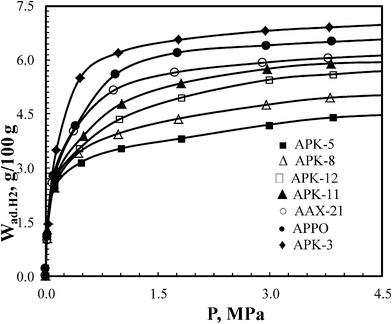 | ||
| Fig. 13 Hydrogen uptake of polymer-based carbon over a pressure range of 10−6 to 4.5 MPa (at −196 °C). | ||
| Sample | SBET (m2 g−1) | V tp (cm3 g−1) | V mp (cm3 g−1) | d DR (Å) | Maximum H2 uptake at −196 °Ca | |
|---|---|---|---|---|---|---|
| g/100 g | g/L | |||||
| a H2 uptake (excess hydrogen capacity) measured at 4.5 MPa. b PPO based carbon. | ||||||
| APK-5 | 2035 | 0.9 | 0.84 | 15.0 | 4.5 | 32.1 |
| APK-11 | 2200 | 0.92 | 0.90 | 15.9 | 5.9 | 41.5 |
| APK-8 | 2495 | 1.03 | 0.97 | 16.7 | 4.9 | 32.0 |
| APK-12 | 2720 | 1.24 | 1.12 | 17.7 | 5.7 | 32.8 |
| APK- 3 | 3100 | 1.51 | 1.23 | 18.7 | 7.0 | 34.8 |
| APPOb | 3450 | 2.05 | 1.72 | 19.4 | 6.7 | 26.3 |
The data shows that some PPO and PEEK-based carbons exhibit hydrogen uptake (excess!) comparable or even superior to AX-21 (a commercial carbon standard). The gravimetric and volumetric uptakes of these materials are summarized in Table 3. The maximum volumetric uptake ∼41.5 g H2 L−1 was attained with carbons of SBET 2200 m2 g−1, like APK-11, and gravimetric uptake of ∼7.0 wt% was obtained for carbons with a surface area of ∼3100 m2 g−1, such as APK-3, at −196 °C and 4.5 MPa. These performances are among the best reported by a porous sorbent (carbon aerogels,36 metal organic frameworks,34,35 super-activated carbons37 and zeolite-template ordered carbons38) under the same adsorption conditions.
Conclusions
This work shows that highly porous carbons can be attained by pyrolyzing aromatic rich polyether like poly(2,6-dimethyl-1,4-phenylene oxide) (PPO) and poly(ether ether ketone) (PEEK). Activation of these carbons produces high surface area carbons matrices exceeding SBET ∼3000 m2 g−1, with a narrow pore size distribution in the microporous region. However, it is not enough for a polymeric material to be rich in aromatic benzene units and be adequate for the production of high performing carbon, with a high adsorption capacity as demonstrated here by the PPO and PEEK. The carbonization of the polymer must be a high yielding reaction. This requires that most of the aromatic fragments that are generated during the pyrolysis, be integrated into the solid carbon matrix, while the non-aromatic fragments should be cleaved and evaporated.The carbonization process can be controlled to yield carbon products with a variety of surface properties. However, the mechanism of activation of the carbon, by activation reagents like KOH, which thermally and chemically decompose the carbon matrix is not clear and is still being studied in this laboratory. The activation is performed on a carbon matrix that does not contain small molecular fragments, a random distraction of the matrix can be avoided and the progress in porosity and surface properties can be monitored. The correlation between hydrogen uptake per unit surface area (q) and the average pore size revealed that q increases from ∼7.1 to 21.9 μg m−2 as dDR decreases from ∼22 to ∼8 Å. An enhanced gravimetric hydrogen uptake of ∼7.0 wt% for APK-3 and a volumetric hydrogen capacity of ∼41.5 g H2 L−1 for APK-11 were successfully achieved at −196 °C and 4.5 MPa.
The correlation between the pore creation (and enlargement) for the activated carbon (Fig. 9) and the hydrogen adsorption capacity (Fig. 11a) indicate that if surface area would increase SBET ≫ 1400 m2 g−1, while pore diameter is kept low <1 nm, the hydrogen uptake increase could be much higher than what seems to be an upper limit of ∼3.0 wt%. Polymer based activated carbons of this type (i.e. the carbon made of rich aromatic polyethers) may also possess wide applications in fields such as, catalysis, CO2 emission and other contemporary applications.
Acknowledgements
This project is sponsored by the Department of Energy in Hydrogen and Fuel Cell Projects under award #DE-FG36-05GO15009. We also thank Dr. Fan Chinbay of Gas Technology Institute, Inc., Dr. Richard Chahine of the University of Quebec at Tri River, Canada and Mr. John D. Bullis of QuantaPhi Corporation for conducting high pressure hydrogen uptake measurements. Evans Analytical Group is acknowledged for performing HRTEM imaging of these nanostructured carbons.References
- Y. Yuan, I. Cabasso and H. Liu, J. Phys. Chem. B, 2008, 112, 14364 CrossRef CAS.
- F. Suarze-Garcia, E. Vilaplana-Ortego, M. Kunowsky, M. Kimura, A. Oya and A. Linares-Solamo, Int. J. Hydrogen Energy, 2009, 34, 9141–9150 CrossRef.
- J. B. Parra, C. O. Ania, A. Arenillas, F. Rubiera, J. M. Palacios and J. J. Pis, J. Alloys Compd., 2004, 379, 280 CrossRef CAS.
- S. Li. PhD Thesis. Nanostrouctural activated carbons for hydrogen storage.State University of New York—ESF, Syracuse NY. 2007 Search PubMed.
- P. Kowalczyk, R. Holyst, A. P. Terzyk and P. A. Gauden, Langmuir, 2006, 22, 1970 CrossRef CAS.
- P. Kowalczyk, R. Holyst, M. Terrones and H. Terrones, Phys. Chem. Chem. Phys., 2007, 9, 1786 RSC.
- I. Cabasso, In DOE Annual merit review highlights hydrogen and fuel cell, DOE, Washington, DC., 2005, 2006 ibd, 2007 ibd, 2006 ibd, 2009 ibd, 2010 Search PubMed.
- H. Liu. PhD Thesis. Carbon materials based on poly(phenylene oxide): preparation, characterization and application in electrochemical devices, State University of New York—ESF, Syracuse NY. 2000 Search PubMed.
- H. Liu, I. Cabasso and Y. Yuan, High surface area carbon material base on poly(2,6-dimethyl-1,4-phenylene oxide)—oxdiation and decomposition mechanisms Search PubMed , In preparation.
- L. Zhou, Y. Zhou and Y. Sun, Int. J. Hydrogen Energy, 2004, 29, 319–322 CrossRef CAS.
- A. Abate, I. Blanco, A. Orestano, A. Pollicino and A. Recca, Polym. Degrad. Stab., 2003, 80, 333 CrossRef.
- M. S. Seehra and A. S. Pavlovic, Carbon, 1993, 31, 557 CrossRef CAS.
- V. S. Babu and M. S. Seehra, Carbon, 1996, 34, 1259 CrossRef CAS.
- F. G. Emmerich, Carbon, 1995, 33, 1709 CrossRef CAS.
- Y. Liu, J. S. Xue, T. Zheng and J. R. Dahn, Carbon, 1996, 34, 193 CrossRef CAS.
- H. Wang, Q. Guo and J. Hu, J. Am. Chem. Soc., 2009, 131, 7016–7022 CrossRef CAS.
- B. Feng, S. K. Bhatia and J. C. Barry, Carbon, 2002, 40, 481 CrossRef CAS.
- M. Lu, C. Kong, V. Sahajwalla and D. Harris, Fuel, 2002, 81, 1215 CrossRef.
- O. Senneca, P. Russo, P. Salatino and S. Masi, Carbon, 1997, 35, 141 CrossRef CAS.
- X. D. Dai, X. M. Liu, L. Qian, K. Qiao and Z. F. Yan, Energy Fuels, 2008, 22, 3420 CrossRef CAS.
- F. Stoeckli and T. Centeno, Carbon, 2005, 43, 1184 CrossRef CAS.
- W. Xing, M. Zhang and Z. Yan, Wuli Huaxue Xuebao, 2002, 18, 340 CAS.
- Y. Gogotsi, R. K. Dash, G. Yushin, T. Yildirim, G. Laudisio and J. E. Fischer, J. Am. Chem. Soc., 2005, 127, 16006 CrossRef CAS.
- K. M. Thomas, Catal. Today, 2007, 120, 389 CrossRef CAS.
- R. Gadiou, S. Saadallah, T. Piquero, P. David, J. Parmentier and C. Vix-Guterl, Microporous Mesoporous Mater., 2005, 79, 121 CrossRef CAS.
- R. Gadiou, N. Texier-Mandoki, T. Piquero, S. Saadallah, J. Parmentier, J. Patarin, P. David and C. Vix-Guterl, Adsorption, 2005, 11, 823 CrossRef.
- M. G. Nijkamp, J. Raaymakers, A. J. van Dillen and K. P. de Jong, Appl. Phys. A: Mater. Sci. Process., 2001, 72, 619 CrossRef CAS.
- N. Texier-Mandoki, J. P. Dentzer, T. S. Saadallah, P. David and C. Vix-Guterl, Carbon, 2004, 42, 2735 CrossRef.
- X. B. Zhao, B. Xiao, A. J. Fletcher and K. M. Thomas, J. Phys. Chem. B, 2005, 109, 8880 CrossRef CAS.
- L. Zhou, Y. Zhou and Y. Sun, Int. J. Hydrogen Energy, 2006, 31, 259 CrossRef CAS.
- K. Kadono, H. Kajiura and M. Shiraishi, Appl. Phys. Lett., 2003, 83, 3392 CrossRef CAS.
- A. Zuttel, Naturwissenschaften, 2004, 91, 157 CrossRef.
- X. Lin, J. Jia, X. B. Zhao, K. M. Thomas, A. J. Blake, G. Walker, N. R. Champness, P. Hubberstey and M. Schroder, Angew. Chem., Int. Ed., 2006, 45, 7358 CrossRef CAS.
- P. Kowalczyk, H. Tanaka, R. Holyst, K. Kaneko, T. Ohmori and J. Miyamoto, J. Phys. Chem. B, 2005, 109, 17174 CrossRef CAS.
- J. Jagiello, A. Anson and M. T. Martinez, J. Phys. Chem. B, 2006, 110, 4531 CrossRef CAS.
- H. Kabbour, T. F. Baumann, J. H. Satcher Jr., A. Saulnier and C. C. Ahn, Chem. Mater., 2006, 18, 6085 CrossRef CAS.
- M. Jorda-Beneyto, F. Suarez-Garcia, D. Lozano-Castelló, D. Cazorla-Amoros and A. Linares-Solano, Carbon, 2007, 45, 293 CrossRef CAS.
- Z. Yang, Y. Xia and R. Mokaya, J. Am. Chem. Soc., 2007, 129, 1673 CrossRef CAS.
Footnote |
| † Electronic Supplementary Information (ESI) available. See DOI: 10.1039/c2ra20057k/ |
| This journal is © The Royal Society of Chemistry 2012 |


