A solid oxide cell yielding high power density below 600 °C†
Zhongliang
Zhan
*a,
Da
Han
a,
Tianzhi
Wu
a,
Xiaofeng
Ye
a,
Shaorong
Wang
a,
Tinglian
Wen
a,
Sungmee
Cho
b and
Scott A.
Barnett
b
aCAS Key Laboratory of Materials for Energy Conversion, Shanghai Institute of Ceramics, Chinese Academy of Sciences (SICCAS), 1295 Dingxi Road, Shanghai, 200050, P. R. China. E-mail: zzhan@mail.sic.ac.cn; Fax: 86-21-6998-7669; Tel: 86-21-6998-7669
bDepartment of Materials Science and Engineering, Northwestern University, 2220 Campus Drive, Evanston, IL 60208, USA
First published on 8th March 2012
Abstract
Here we report solid oxide cells with thin strontium- and magnesium-doped lanthanum gallate electrolytes that yield power densities of 1.06 W cm−2 at 550 °C and 0.81 W cm−2 at 500 °C when operated on humidified hydrogen and ambient air. Cost-effective ceramic processing and chemical solution impregnation methods were utilized, yielding a dual micron- and nano-scale architecture that is essential for achieving good low-temperature performance.
Solid oxide cells (SOCs) have critical applications including clean efficient electricity generation1 and production of fuels from renewable electricity.2–4 It is well known that reducing SOC operating temperature requires alternatives to the materials that work well at ≥750 °C: yttria-stabilized zirconia (YSZ) electrolyte, Ni–YSZ anode, and La0.8Sr0.2MnO3 (LSM) cathode.5 (La,Sr)(Ga,Mg)O3 (LSGM) was chosen as the electrolyte for the present cells because its conductivity is sufficient for SOCs to produce high power down to at least 550 °C. For example, the conductivity at 550 °C is 0.012 S cm−1,6 yielding an acceptable resistance REL = 0.125 Ω cm2 for a practical electrolyte thickness of 15 μm. LSGM has negligibly low electronic conductivity,6 enabling SOCs that produce high open-circuit potential and hence can achieve high efficiency, unlike a widely-investigated alternative, ceria doped with Gd or Sm.7–9
Progress in thin LSGM-electrolyte SOCs has been limited by material compatibility issues.10,11 Interdiffusion of Ni during high-temperature co-firing with Ni-based anodes causes electronic conductivity or reactions that produce new undesirable low-conductivity phases.11 La loss from LSGM during co-firing with some electrodes can result in the formation of non-perovskite phases.6,12 LSGM thin electrolyte cells have been fabricated by co-firing with thin La0.4Ce0.6O2-δ (LDC) barrier layers,11 avoiding La loss and reducing Ni migration from the Ni–LDC support, but the LDC conductivity was too low to allow good cell performance at ≤600 °C.11 Thus, in order to achieve really good LSGM-based SOCs, it is critical to avoid the LSGM–electrode interactions that occur during high temperature co-firing. In one case, LSGM-electrolyte cells were fabricated using low temperature pulsed-laser deposition,13,14 a method that is relatively expensive and hence problematic since cost is critical for making commercially-viable SOCs. More recently, a solid oxide cell power density of 1 W cm−2 was achieved down to 650 °C by high temperature firing of a porous/dense LSGM bi-layer and then adding the active anode and cathode materials at a lower temperature.15 In the present work, 1 W cm−2 was achieved at a much lower operating temperature than previously possible, 550 °C, utilizing cost-effective ceramic processing and chemical solution impregnation techniques.
Low-temperature SOCs with thin LSGM electrolytes were fabricated by first preparing LSGM tri-layers: thick porous support, thin dense layer, and thin porous layer. The tri-layer structure was produced by laminating three tape-cast ceramic green tapes, with 40 wt% starch filler used as the fugitive material for the two porous layers. The laminated green tapes were co-fired at 1450 °C to produce the final ceramic structures. Although this tri-layer approach was pioneered for YSZ electrolyte cells as a means for eliminating Ni from anodes;16 here we have used it to enable the inclusion of Ni in the anodes without LSGM interactions.
The addition of the cathode catalyst, either (Sm0.5Sr0.5)CoO3 (SSC) or a (Sm0.5Sr0.5)CoO3–Sm0.2Ce0.8O1.9 (SSC–SDC) composite in a weight ratio of 70![[thin space (1/6-em)]](https://www.rsc.org/images/entities/char_2009.gif) :
:![[thin space (1/6-em)]](https://www.rsc.org/images/entities/char_2009.gif) 30, was the next step in the fuel cell fabrication procedure. Nitrate solutions containing Sm(NO3)3·6H2O, Sr(NO3)2 and Co(NO3)2·6H2O, and in some cases Ce(NO3)3·6H2O in appropriate ratios were impregnated into the porous LSGM backbones and dried. After firing at 850 °C for 4 h, the predominant phases observed were perovskite structure SSC and fluorite-structure SDC, with the minor impurity phases Co3O4, SmCoO3, and SrCoO3.17 Finally, nickel oxide was added to the porous LSGM supports by impregnating with an aqueous nickel nitrate solution followed by calcination in air at 700 °C for 30 min. The ultimate loading of the infiltrated catalysts in the porous LSGM layers were controlled by varying the number of impregnation/firing cycles in each step.
30, was the next step in the fuel cell fabrication procedure. Nitrate solutions containing Sm(NO3)3·6H2O, Sr(NO3)2 and Co(NO3)2·6H2O, and in some cases Ce(NO3)3·6H2O in appropriate ratios were impregnated into the porous LSGM backbones and dried. After firing at 850 °C for 4 h, the predominant phases observed were perovskite structure SSC and fluorite-structure SDC, with the minor impurity phases Co3O4, SmCoO3, and SrCoO3.17 Finally, nickel oxide was added to the porous LSGM supports by impregnating with an aqueous nickel nitrate solution followed by calcination in air at 700 °C for 30 min. The ultimate loading of the infiltrated catalysts in the porous LSGM layers were controlled by varying the number of impregnation/firing cycles in each step.
The SOCs were tested using a standard geometry18 at temperatures from 450 °C to 600 °C. Current–voltage curves and electrochemical impedance spectra were obtained using an IM6 Electrochemical Workstation (ZAHNER, Germany) with the cathode exposed to ambient air and the anode to humidified (3% H2O) hydrogen at a flow rate of 100 mL min−1. The individual electrode polarization resistances were determined by testing symmetric cells with the same catalysts impregnated into the both porous LSGM layers. Humidified hydrogen and ambient air were used for the measurement of the anode and cathode polarization resistance, respectively. The cell structure was examined after testing using scanning electron microscopy (SEM) in a Hitachi S-4800-II microscope.
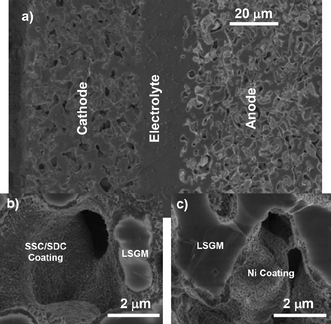
Fig. 1a shows an SEM micrograph of tri-layer porous/dense/porous LSGM structures. The porous layers had an average pore size of ∼3 μm and a pore volume fraction of ∼55%. On the air electrode side, the LSGM pore surfaces had a nano-porous coating of Sm0.5Sr0.5CoO3 (SSC) (and in some cases Sm0.2Ce0.8O1.9 (SDC)), as shown in Fig. 1b. The fuel electrode side was coated with nano-porous Ni (Fig. 1c). The average diameters of Ni and SSC particles were ≈50 nm and ≈60 nm, respectively (Supplementary Fig. S1a and S1b†). This nano-scale structure, with a high surface area that promotes fast oxygen exchange at the cathode and fuel oxidation reactions at the anode, is enabled by the present processing scheme where there are no high-temperature processing steps after infiltration (the highest temperature step is calcination, done at 850 °C).
 | ||
| Fig. 1 Cross-sectional scanning electron microscope (SEM) images showing an operated thin LSGM electrolyte cell: (a) a low magnification survey image, (b) a higher magnification view of the cathode and (c) a higher magnification view of the anode. | ||
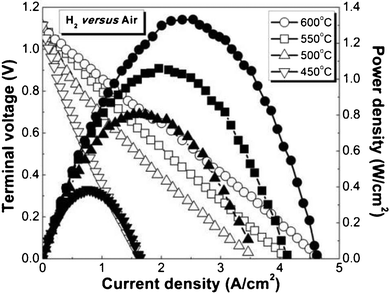
Fig. 2 shows cell voltages and power densities plotted versus current densities, measured at temperatures of 450–600 °C with humidifed hydrogen in the anode and ambient air in the cathode. This was amongst the best SOCs tested. The open circuit voltage (OCV) values increased from 1.101 to 1.114 V with decreasing temperature, within 20 mV of the calculated Nernst potentials. This is critical because it shows the potential for high efficiency, and indicates that the processing yielded a ≈15 μm thick LSGM layer that was both gas tight and free of Ni impurities that can introduce electronic conductivity. The maximum power densities were 1.33, 1.06, 0.81 and 0.39 W cm−2 at 600, 550, 500 and 450 °C, respectively. At any given temperature, these values are higher than the best previously reported SOCs operated with air as the oxidant (Supplementary Fig. S2†). Although there are prior reports of pulsed laser deposited LSGM-electrolyte cells that produced a higher power density at 600 °C (but lower than the present values at <600 °C), they were obtained with pure oxygen rather than air, which boosts cathode performance. Furthermore, they had low OCV values, apparently because they required a bi-layer LSGM–SDC electrolyte.13,14 Preliminary life testing of the present cells over ∼200 h showed promising results, although longer tests will be needed to better assess durability. There was no detectable change in resistance for electrodes maintained without current at 500 °C. A full cell operated at 550 °C at ∼1 A cm−2 showed a 10–15% resistance increase, much of which appeared to be the initial cell break-in.
 | ||
| Fig. 2 Voltage and power density versus current density, measured in humidifed hydrogen fuel and ambient air at 450–600 °C, from a thin LSGM electrolyte cell with electrode loadings VNi = 7.2% and VSSC–SDC = 12.9%. | ||
Electrochemical impedance spectroscopy (EIS) measurements were performed to obtain insight into cell electrochemical characteristics. It can be challenging to separate anode and cathode responses in EIS data from full SOCs. Thus, we have taken advantage of the present tri-layer LSGM structures to prepare cells with the same electrode material on both sides, i.e., symmetric anode/electrolyte/anode and cathode/electrolyte/cathode cells. In order to ensure symmetry, the porous layer thicknesses were identical, 150 μm, in these cells. Data were collected under uniform atmosphere-humidified hydrogen for Ni anodes and ambient air for SSC–SDC cathodes. This allows an unambiguous determination of the polarization resistance (Rp) of each electrode under typical SOC operating environments.
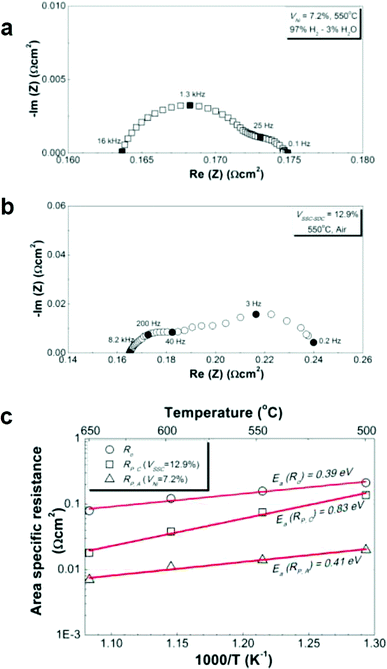
Representative Nyquist plots of the EIS data at 550 °C are shown in Fig. 3a for symmetric anode cells at VNi = 7.2% and in Fig. 3b for symmetric cathode cells at VSSC–SDC = 12.9%. The higher-frequency real-axis intercept resistances were almost the same for both cells, ≈0.16 Ω cm2. Fig. 3c summarizes the ohmic resistance values (Ro) derived from the EIS data at varied temperatures. The Ro values are slightly larger than the expected electrolyte resistance for a 15 μm thick LSGM layer,6 and the apparent activation energy (0.39 eV) is lower than reported for LSGM (0.9–1.0 eV)6,19 or the present measured bulk conductivity value of 0.80 eV (Supplementary Fig. S3†). The higher than expected Ro may arise from current collection losses in the testing setup, which can yield a low apparent activation energy.20
 | ||
| Fig. 3 Representative impedance spectra measured at 550 °C from (a) symmetric anode cells with Ni catalyst loading VNi = 7.2% in humidified hydrogen, or (b) symmetric cathode cells with SSC–SDC catalyst loading VSSC–SDC = 12.9% in ambient air. (c) Ohmic, Ni anode, and SSC–SDC cathode polarization resistances plotted versus inverse temperature. | ||
Electrode polarization resistances were obtained by taking the differences between the higher and lower frequency intercepts in Fig. 3a and 3b. The anode polarization resistance was RP,A = 0.014 Ω cm2 at 550 °C. The low RP,A of infiltrated Ni–LSGM anodes has previously been explained by the very high density of three-phase (Ni–LSGM–pore) boundaries in the nano-porous structure.15 Micron-scale electrodes have higher RP,A values, e.g., >0.15 Ω cm2 at 750 °C for Ni–YSZ,21 due to much lower three-phase boundary densities. The cathode polarization resistance was RP,C = 0.075 Ω cm2 at 550 °C. This value compares very favorably with the lowest reported resistance values for SOC cathodes, e.g., 0.2 Ω cm2 at 550 °C for (Ba,Sr)(Co,Fe)O3 cathodes7 and 0.1 Ω cm2 at 550 °C for SSC infiltrated into SDC scaffolds.22
Comparison of RP,A and RP,C with Ro, in Fig. 3c, shows that Ro is the dominant loss at temperatures down to 500 °C. The cathode polarization becomes predominant at lower temperatures (not shown). The RP,C values were ∼2–10 times higher than the RP,A values over the temperature range of 500–650 °C. The activation energy for the cathode reaction, 0.83 eV, is higher than for the anode reaction, 0.41 eV. This indicates that the cathode becomes increasingly important in determining the fuel cell performance as the temperature is reduced. Optimization of the cathode composition is thus critical for achieving good low-temperature performance shown above, and is detailed below.
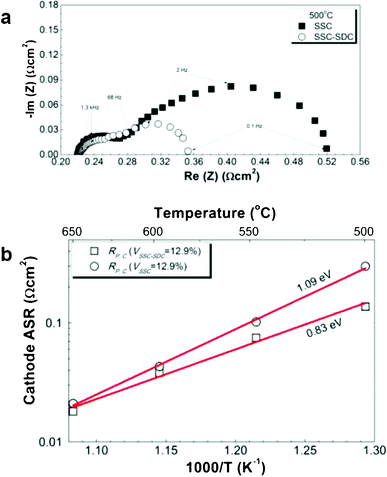
Fig. 4a compares the Nyquist plots of EIS data, taken in air at 500 °C, for symmetric cathode cells made with infiltrated SSC or the SSC–SDC composite. Fig. 4b shows the total cathode polarization resistance values derived from the EIS data. The SSC–SDC value at 500 °C, 0.13 Ω cm2, was much smaller than the pure SSC value, 0.30 Ω cm2, but the improvement was less at higher temperatures. Indeed, the RP,C activation energy of 1.09 eV for SSC was much higher than for the SSC–SDC cathode. Not surprisingly, cells with pure SSC infiltrated cathodes (VSSC = 12.9%) provided lower maximum power densities, especially at lower temperatures: 1.30, 0.93 and 0.48 W cm−2 at 600, 550 and 500 °C, respectively (Supplementary, Fig. S4†).
 | ||
| Fig. 4 (a) Comparison of impedance spectra measured in air at 500 °C from symmetric cathode cells with SSC or SSC–SDC catalysts at comparable total loadings, and (b) comparison of SSC and SSC–SDC cathode polarization resistances plotted versus inverse temperature. | ||
Fig. 4a shows that the EIS response consisted of a larger low-frequency arc and a smaller high-frequency arc for both compositions, consistent with the result shown in Fig. 3b. Based on prior results from similar mixed ion and electronic conducting cathode materials,23 the high-frequency arc can be attributed to the charge transfer reaction at the SSC–LSGM interface, while the low-frequency arc can be attributed to oxygen surface exchange and bulk oxygen ion diffusion at the SSC–vapor interface. The SSC–SDC cathode had a substantially reduced lower-frequency arc but a similar higher-frequency arc, suggesting that the addition of SDC accelerated the kinetics for oxygen surface exchange and bulk diffusion. This can be explained by the smaller particle size in the SSC–SDC versus SSC cathodes (Supplementary Fig. S1b and S1c†), yielding more SSC surface area for oxygen exchange.17 The addition of SDC may yield smaller particle size by suppressing agglomeration and coarsening of SSC nanoparticles during the repeated impregnation/calcination cycles. The faster oxygen exchange can also explain the lower observed activation energy, as it tends to increase the importance of the lower activation energy oxygen diffusion process.17 The faster oxygen transport in SDC, indicated by its smaller activation energy of 0.85 eV compared with 1.46 eV for SSC,24,25 can also help explain the results in Fig. 4b.
In summary, our results demonstrate a materials set and straightforward process for producing good reduced-temperature SOCs, with considerable potential for improvement. In particular, an improved process yielding a thinner (∼5 μm) electrolyte would increase the power density by as much as 40%. The present processing scheme also makes it possible to improve the electrode nano-structure and introduce improved electrolyte or electrode materials as they are developed. These results will also help motivate new research on associated materials—seals, interconnectors, and the SOC balance of plant—needed to implement these SOCs in full-scale reduced-temperature systems featuring reduced cost and improved lifetime.
Acknowledgements
The authors gratefully acknowledge the financial support of the National Basic Research Program of China under contract No. 2012CB215400, the National Science Foundation of China under contract No. 51072219, Science and Technology Commission of Shanghai Municipality under contract No. 09JC1415200 and 11PJ1410300, the 100 Talents Program of Chinese Academy of Sciences, Chinese Academy of Sciences visiting professorship for senior international scientists under grant No. 2010T1G09. The authors at Northwestern University gratefully acknowledge financial support from the National Science Foundation Energy for Sustainability program, Department of Energy Basic Energy Sciences, and the Global Climate and Energy Project.References
- B. C. H. Steele and A. Heinzel, Nature, 2001, 414, 345–352 CrossRef CAS.
- A. Hauch, S. D. Ebbesen, S. H. Jensen and M. Mogensen, J. Mater. Chem., 2008, 18, 2331–2340 RSC.
- M. Mogensen, S. H. Jensen, A. Hauch, I. Chorkendorff and T. Jacobsen, Ceram. Eng. Sci. Proc., 2008, 28, 91–101 CAS.
- D. M. Bierschenk, J. R. Wilson and S. A. Barnett, Energy Environ. Sci., 2011, 4, 944–951 CAS.
- E. D. Wachsman and K. T. Lee, Science, 2011, 334, 935–939 CrossRef CAS.
- K. Q. Huang and J. B. Goodenough, J. Alloys Compd., 2000, 303, 454–464 CrossRef.
- Z. P. Shao and S. M. Haile, Nature, 2004, 431, 170–173 CrossRef CAS.
- Z. L. Zhan and S. A. Barnett, Science, 2005, 308, 844–847 CrossRef CAS.
- J. Wright and A. V. Virkar, J. Power Sources, 2011, 196, 6118–6124 CrossRef CAS.
- J. B. Goodenough, Annu. Rev. Mater. Res., 2003, 33, 91–128 CrossRef CAS.
- Y. B. Lin and S. A. Barnett, Electrochem. Solid-State Lett., 2006, 9, A285–A288 CrossRef CAS.
- K. Huang, J. Wan and J. B. Goodenough, J. Mater. Sci., 2001, 36, 1093–1098 CrossRef CAS.
- J. W. Yan, H. Matsumoto, M. Enoki and T. Ishihara, Electrochem. Solid-State Lett., 2005, 8, A389–A391 CrossRef CAS.
- J. Yan, H. Matsumoto, T. Akbay, T. Yamada and T. Ishihara, J. Power Sources, 2006, 157, 714–719 CrossRef CAS.
- Z. L. Zhan, D. M. Bierschenk, J. S. Cronin and S. A. Barnett, Energy Environ. Sci., 2011, 4, 3951–3954 CAS.
- S. McIntosh and R. J. Gorte, Chem. Rev., 2004, 104, 4845–4865 CrossRef CAS.
- J. D. Nicholas and S. A. Barnett, J. Electrochem. Soc., 2010, 157, B536–B541 CrossRef CAS.
- M. R. Pillai, D. M. Bierschenk and S. A. Barnett, Catal. Lett., 2008, 121, 19–23 CrossRef CAS.
- B. W. Liu and Y. Zhang, J. Alloys Compd., 2008, 458, 383–389 CrossRef CAS.
- T. Tsai and S. A. Barnett, Solid State Ionics, 1997, 98, 191 CrossRef CAS.
- A. Hagen, Y. L. Liu, R. Barfod and P. V. Hendriksen, ECS Trans., 2007, 7, 301–309 CrossRef.
- F. Zhao, Z. Y. Wang, M. F. Liu, L. Zhang, C. R. Xia and F. L. Chen, J. Power Sources, 2008, 185, 13–18 CrossRef CAS.
- S. B. Adler, X. Y. Chen and J. R. Wilson, J. Catal., 2007, 245, 91–109 CrossRef CAS.
- Z. L. Zhan, T. L. Wen, H. Y. Tu and Z. Y. Lu, J. Electrochem. Soc., 2001, 148, A427–A432 CrossRef CAS.
- S. Kim, Y. L. Yang, A. J. Jacobson and B. Abeles, Solid State Ionics, 1998, 106, 189–195 CrossRef CAS.
Footnote |
| † Electronic Supplementary Information (ESI) available: high magnification SEM micrographs of the electrodes, comparison of different low temperature SOCs, LSGM conductivity, and performance for a thin LSGM electrolyte fuel cell with VNi = 7.2% and VSSC = 12.9%. See DOI: 10.1039/c2ra20413d/ |
| This journal is © The Royal Society of Chemistry 2012 |
