Fe2O3 nanoparticles coated on ferrocene-encapsulated single-walled carbon nanotubes as stable anode materials for long-term cycling†
Jiaxin
Li
,
Yi
Zhao
,
Yunhai
Ding
and
Lunhui
Guan
*
Fujian Institute of Research on the Structure of Matter, Chinese Academy of Sciences, Fuzhou, 350002, China. E-mail: guanlh@fjirsm.ac.cn; Tel: 86-591-83832979.; Fax: 86-591-83792835
First published on 23rd February 2012
Abstract
Ferrocene-encapsulated single-walled carbon nanotubes (Fc@SWCNTs) uniformly coated with Fe2O3 (Fe2O3/Fc@SWCNTs) were synthesized and investigated as an anode material for lithium-ion batteries. The anode delivered a reversible capacity of ∼460 mA h g−1 after more than 600 cycles, even when measured at 1300 mA g−1, indicating the longest cycling performance for Fe2O3 anodes ever reported.
Introduction
Interest in the development of lithium-ion batteries (LIBs) with high power and energy density has increased considerably because of environmental problems and fossil fuel depletion.1–6 Anodes of nanostructured materials can provide multiple advantages such as a short path distance for Li ions and electron transport, a higher contact area with the electrolyte, and better accommodation of the strain caused by lithiation or delithiation.5 Nanostructured metal oxides, especially Fe2O3 materials, have theoretical capacities as high as 1007 mA h g−1, a low cost and environmental friendliness, and have been widely investigated as promising anode materials for high energy density LIBs.7–13 However, volume expansion, aggregation and intrinsically low electronic conductivity during the cycling process commonly result in rapid fading of capacities for Fe2O3 anodes. To solve these problems, researchers have mainly focused on synthesizing new nanostructures of Fe2O3 such as nanorods,14 nanosheets,15 nanoflowers,16–17 and nanocapsules,18 with the utilization of various carbonaceous materials as buffer carriers for the Fe2O3 nanoparticles (NPs),19 which allow for the rapid transport of Li ions and improve the cycling stabilities.Recently, buffer carriers including carbon nanofibers,20 carbon nanotubes,21,22 and graphene sheets,4,23–25 have been mixed with Fe2O3 materials to improve their electrochemical performance. A Fe2O3/SWCNT composite showed a reversible specific capacity approaching 600 mA h g−1 after 100 cycles at a discharge current density of 100 mA g−1,22 Fe2O3 NPs anchored on graphene sheets exhibited a high reversible capacity of 590 mA h g−1 at 1007 mA g−1,23 and a steady specific capacity of 800 mA h g−1 for a Fe2O3/C composite was obtained at a current density of 200 mA g−1 after 50 cycles.26 However, the cyclabilities of most Fe2O3 anodes modified with carbonaceous carriers presented a specific decreasing trend after several decades of cycles. The most promising way to improve their cyclabilities is to search for an effective buffer carrier. Based on our previous reports,27,28 ferrocene-encapsulated single-walled carbon nanotubes (Fc@SWCNTs) are a promising component for high-performance anode materials because of their excellent conductivity and large reversible capacity.
Here, we used Fc@SWCNTs as high-performance carriers for Fe2O3 NPs, forming a Fe2O3/Fc@SWCNT composite via a single hydrothermal method. The Fe2O3/Fc@SWCNT composite showed excellent electrochemical performance, including a specific reversible capacity of ∼460 mA h g−1 measured at 1300 mA g−1 with a very high cycling performance (more than 650 cycles). In addition, the mechanism for the enhanced performance that resulted from the Fc@SWCNT carrier was investigated by electrochemical impedance spectroscopy (EIS).
Experimental
All chemicals were of analytical grade and were used as received. The details for the preparation of the SWCNTs and the Fc@SWCNTs were presented in our earlier work.27 Briefly, Fc was introduced into the inner cavity of SWCNTs in the vapor phase. A single hydrothermal process was adopted to prepare Fe2O3 NPs, Fe2O3/SWCNTs and Fe2O3/Fc@SWCNTs. 0.60 mmol phenylphosphonic acid and 0.60 mmol Fe(NO3)3·9H2O were dispersed in de-ionized water and sonicated to form a homogeneous solution. About 40 mg of Fc@SWCNTs or 27 mg of SWCNTs was added and the mixtures were sonicated until they dispersed uniformly. Then, 600 mg (NH2)2CO was added before transferring the mixture to an autoclave and incubating it at 180 °C for 36 h. The final precipitates, Fe2O3/Fc@SWCNTs and Fe2O3/SWCNTs, were respectively filtered and washed several times with de-ionized water, then dried at 80 °C overnight. Fe2O3 NPs were prepared by the same method without Fc@SWCNTs or SWCNTs. The samples were characterized by transmission electron microscopy (TEM), X-ray diffraction (XRD), Raman detection and so on.The electrochemical behaviors were measured in a CR2025 coin-type cell assembled in a dry argon-filled glove box. The test cell consisted of a working electrode (about 1.1 mg cm−2) and a lithium sheet which were separated by a Celgard 2300 membrane and a electrolyte of 1 M LiPF6 in EC![[thin space (1/6-em)]](https://www.rsc.org/images/entities/char_2009.gif) :
:![[thin space (1/6-em)]](https://www.rsc.org/images/entities/char_2009.gif) EMC
EMC![[thin space (1/6-em)]](https://www.rsc.org/images/entities/char_2009.gif) :
:![[thin space (1/6-em)]](https://www.rsc.org/images/entities/char_2009.gif) DMC (1
DMC (1![[thin space (1/6-em)]](https://www.rsc.org/images/entities/char_2009.gif) :
:![[thin space (1/6-em)]](https://www.rsc.org/images/entities/char_2009.gif) 1
1![[thin space (1/6-em)]](https://www.rsc.org/images/entities/char_2009.gif) :
:![[thin space (1/6-em)]](https://www.rsc.org/images/entities/char_2009.gif) 1 in volume). The working electrode consisted of 75 wt% active material, 15 wt% acetylene black, and 10 wt% polyvinylidene difluoride. Cyclic voltammetry tests were operated on a CHI660C Electrochemical Workstation with a scan rate of 0.30 mV s−1. The cells were cycled by LAND 2001A at room temperature. EIS was carried out by applying an AC voltage of 5 mV over the frequency range from 1 mHz to 100 kHz.
1 in volume). The working electrode consisted of 75 wt% active material, 15 wt% acetylene black, and 10 wt% polyvinylidene difluoride. Cyclic voltammetry tests were operated on a CHI660C Electrochemical Workstation with a scan rate of 0.30 mV s−1. The cells were cycled by LAND 2001A at room temperature. EIS was carried out by applying an AC voltage of 5 mV over the frequency range from 1 mHz to 100 kHz.
Results and discussion
Fig. 1 shows the typical X-ray diffraction (XRD) patterns of the SWCNTs, Fc@SWCNTs and the Fe2O3/Fc@SWCNTs. Compared with a SWCNT sample, the peak at 5.8° marked with a #, which was ascribed to hexagonally packed SWNTs, disappeared in Fc@SWCNT because of the contribution of the reduced structure factor of Fc molecules inside the tube.29 The result confirms that the Fc molecules filled the tubes of the Fc@SWCNTs. The doping result is also supported by the Raman test shown in Fig. S1 (see ESI†). From Fig. 1, the XRD pattern taken from the Fe2O3/Fc@SWCNTs can be consistently indexed to the rhombohedral phase of hematite, α-Fe2O3 (JCPDS 33-0664). The size of the Fe2O3 NPs was calculated using the Scherrer formula and was found to be between 7 and 10 nm.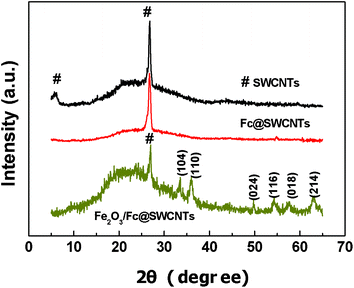 | ||
| Fig. 1 X-Ray diffraction patterns of SWCNTs, Fc@SWCNTs and Fe2O3/Fc@SWCNTs. | ||
Typical low-resolution and high-resolution TEM images for the Fe2O3/Fc@SWCNT composite are presented in Fig. 2. In the current study, the loading ratio of Fe2O3 NPs is ∼60 wt% for the best cell performance. Fe2O3 NPs are uniformly distributed on the surface of the Fc@SWCNTs in the composite. Most of the nanotubes or nanotube bundles in the composite have been fully coated with Fe2O3 NPs. The corresponding selected area electron diffraction (SAED) pattern showing the crystalline nature of the Fe2O3 NPs is shown in the inset of Fig. 2. The regular interplanar spacing of 0.25 nm for α-Fe2O3 ascribed to the 110 plane can be observed. The size of the Fe2O3 NPs (see Fig. 2b) is 7–10 nm, which is consistent with the XRD result.
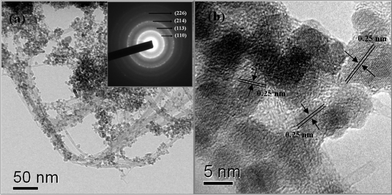 | ||
| Fig. 2 Transmission electron microscopy (TEM) and high-resolution TEM (HR-TEM) images, and a selected area electron diffraction (SAED) pattern of the Fe2O3/Fc@SWCNTs. | ||
Fig. 3 shows the discharge–charge voltage profiles and cyclic voltammetry (CV) curves for the first 4 cycles of the Fe2O3/Fc@SWCNT electrode between 0.05 and 3.0 V (versus Li+/Li). The discharge–charge profiles measured at 100 mA g−1 in Fig. 3a show similar features to those of nanostructured Fe2O3 reported previously.14,26 From the first discharge voltage profile, the regions from I to III are corresponding to the reduction reaction of Fe3+ to Fe0. An extended voltage plateau below 0.75 V (region IV) followed by a gradual drop in voltage until the end of discharge process, is attributed to the formation of the solid electrolyte interface (SEI) layer or further Li ion storage by an interfacial reaction due to the charge separation at the metal/Li2O phase boundary. On the contrary, the sloped regions from 1.0 to 2.1 V shown in charge voltage profiles are attributed to the reverse reaction of Fe0 to Fe3+. The reaction mechanism of Li and Fe2O3 could be described as follows:30
| Fe2O3 + 2Li+ + 2e− → Li2(Fe2O3) | (1) |
| Li2(Fe2O3) + 4Li+ + 4e− → 2Fe0 + 3Li2O | (2) |
| 2Fe0 + 2xLi2O ↔ 2FeOx + 4xLi+ + 4xe− | (3) |
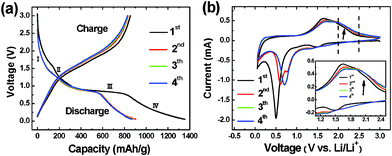 | ||
| Fig. 3 Discharge–charge curves (a) and cyclic voltammetry curves (b) of Li insertion/extraction into/from Fe2O3/Fc@SWCNT electrodes. The inset in (b) shows enlargements of particular potential regions. | ||
These electrochemical reactions are consistent with the CV result (0.30 mV s−1) of the Fe2O3/Fc@SWCNT electrode shown in Fig. 3b. It is noted that peaks marked by an arrow appearing from 1.90 to 2.40 V on anodic CV curves are more pronounced compared with other reports on Fe2O3 anodes. We attribute these distinct peaks and the excess Li capacities to reversible Li diffusion into or out of the interior space of the Fc@SWCNT buffer carrier.27
Fig. 4 presents the cycling performance of a Fe2O3/Fc@SWCNT electrode discharged and charged at various rates. The Fe2O3/Fc@SWCNT composite shows excellent capacity retention at different rates. After 65 cycles, a large reversible capacity of 960 mA h g−1 was obtained, which remained even after 35 cycles when the rate was reduced back to 100 mA g−1, demonstrating a magnificently high-rate performance.
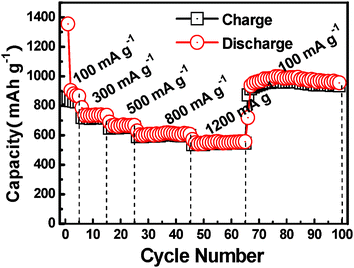 | ||
| Fig. 4 Cycling performance of a Fe2O3/Fc@SWCNT electrode measured at various discharge–charge rates. | ||
The long-term cycling performance of a Fe2O3/Fc@SWCNT electrode is shown in Fig. 5. The first discharge and charge steps deliver specific capacities of 1380 and 920 mA h g−1, corresponding to a Coulombic efficiency of 67%. The initial irreversible capacities are large which is mainly caused by the decomposition of the electrolyte and the formation of a SEI layer. The discharge capacities of the electrode in the 4th, 33rd and 53rd cycle measured at 400 mA g−1 are 740, 710 and 690 mA h g−1, showing a good capacity retention of 93%. After 53 cycles, the cell was further evaluated for long-term cycling capability. When this cell was tested with a higher current density of 1300 mA g−1, even for more than 650 cycles, the reversible specific capacity still stabilized at 460 mA h g−1. The electrochemical performance for Fe2O3 NPs attached on Fc@SWCNTs is much better than that of empty SWCNTs (see Fig. S2, ESI†). Moreover, Fe2O3 NPs without any carriers sharply deteriorated by the obvious disconnection of the material. The capacity of the Fe2O3 NPs dropped rapidly to a 20 mA h g−1 after only 10 cycles (see Fig. S1, ESI†). Thus, the results for this composite are much better than in some of the latest reports on graphene sheet carriers and so on.22–24 The improved electrochemical performance for the Fe2O3/Fc@SWCNT composite can be attributed to the unique structure of the Fc@SWCNTs, which may contribute positively to Li ion diffusion and Fe2O3 NP stabilization.
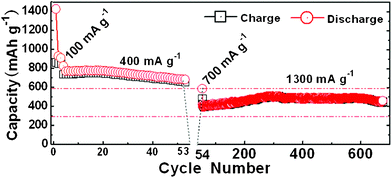 | ||
| Fig. 5 Ultra-long-term cycling of a Fe2O3/Fc@SWCNT electrode. | ||
The Fc@SWCNT carrier plays a key role for improving the electrochemical performance of Fe2O3 NPs. The mechanism of how the Fc@SWCNT carrier influences on the electrochemical performance of its composite in LIBs has been tentatively investigated. Fig. 6 presents typical Nyquist plots obtained after electrochemical tests on the electrodes made from Fc@SWCNTs and SWCNTs. The details for the preparation of the Fc@SWCNT and SWCNT electrodes were shown in our recent work.27 The conductivity of the Fc@SWCNTs is much better than that of the SWCNTs after the electrochemical testing. As seen from the insets in Fig. 6, the similar Nyquist plots for Fc@SWCNT and SWCNT electrodes both consist of three parts, essentially two semicircles followed by a one line. According to Xu et al.,31 the high-frequency semicircle is related to Li ion migration through the SEI film covering the surface of the electrode, the middle-frequency semicircle is attributed to charge transfer through the electrode/electrolyte interface, and the steep sloping line is assigned to solid-state diffusion of the Li ions in the graphite matrix. The EIS results marked with arrows in the insets indicate that the better SEI film was formed on Fc@SWCNTs, and the charge transfer process occurred much more easily at the electrode/electrolyte interface for Fc@SWCNTs. This result might be ascribed to the existence of freely-circulated Li ions in the inner channel of the Fc@SWCNT electrode. This mechanism is somewhat similar to the article reported by Kawasaki et al.32 Therefore, the excellent electrochemical performance of the Fe2O3/Fc@SWCNT composite resulted from good conductivity and electronic contact after Li ion insertion and extraction (see Fig. S3, ESI†) that could be obtained.
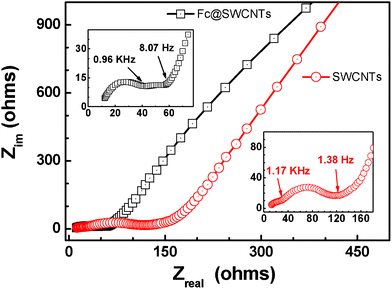 | ||
| Fig. 6 Electrochemical impedance spectra for Fc@SWCNT and SWCNT electrodes after electrochemical testing. | ||
To investigate the excellent electrochemical performance of Fe2O3/Fc@SWCNTs, we decomposed a cell after long-term cycling and analyzed the morphology of the anode by SAED and TEM. From Fig. 7, Fe2O3 NPs were still uniformly distributed on the surface of the Fc@SWCNTs. The good morphology retention after electrochemical testing shown in Fig. 7 can effectively facilitate the high stability of the Fe2O3/Fc@SWCNT composite.
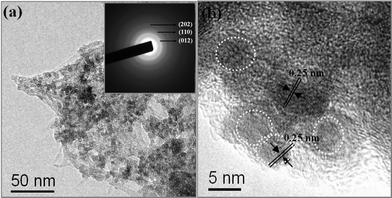 | ||
| Fig. 7 Transmission electron microscopy (TEM) and high-resolution TEM (HR-TEM) images, and a selected area electron diffraction (SAED) pattern of the Fe2O3/Fc@SWCNT composite after long-term cycling. | ||
Conclusion
A uniform Fe2O3/Fc@SWCNT composite prepared by a simple hydrothermal method was investigated as an anode material for LIBs. The composite exhibits superior LiB performance with a large reversible capacity, excellent cyclic performance, and good rate capability. Fc@SWCNTs can retain the tube structure of the composite used as a buffer carrier to alleviate the obvious disconnection of Fe2O3 NPs during cycling, and as a good conductor to improve the electrical conductivity of its electrodes. Using Fc@SWCNTs for loading anode materials including other metal oxides could be a promising route to producing advanced anodes exhibiting high energy density and a very long cyclic life for LIBs.Acknowledgements
The authors acknowledge the financial support provided by the National Key Project on Basic Research (2011CB935904) and the NSFC (91127020, 21171163).References
- Y. J. Lee, H. Yi, W. J. Kim, K. Kang, D. S. Yun, M. S. Strano, G. Ceder and A. M. Belcher, Science, 2009, 324, 1051–1055 CAS.
- J. B. Goodenough and Y. Kim, Chem. Mater., 2010, 22, 587–603 CrossRef CAS.
- L. S. Zhang, L. Y. Jiang, C. Q. Chen, W. Li, W. G. Song and Y. G. Guo, Chem. Mater., 2010, 22, 414–419 CrossRef CAS.
- Y. Sun, Q. Wu and G. Shi, Energy Environ. Sci., 2011, 4, 1113–1132 CAS.
- D. Liu and G. Cao, Energy Environ. Sci., 2010, 3, 1218–1237 CAS.
- F. Cheng, J. Liang and Z. Tao, Adv. Mater., 2011, 23, 1695–1715 CrossRef CAS.
- K. M. Nam, J. H. Shim, D. W. Han, H. S. Kwon, Y. M. Kang, Y. Li, H. Song, W. S. Seo and J. T. Park, Chem. Mater., 2010, 22, 4446–4454 CrossRef CAS.
- J. Y. Huang, L. Zhong, C. M. Wang, J. P. Sullivan, W. Xu, L. Q. Zhang, S. X. Mao, N. S. Hudak, X. H. Liu, A. Subramanian, H. Fan, L. Qi, A. Kushima and J. Li, Science, 2010, 330, 1515–1520 CrossRef CAS.
- X. Wang, X. L. Wu, Y. G. Guo, Y. Zhong, X. Cao, Y. Ma and J. Yao, Adv. Funct. Mater., 2010, 20, 1680–1686 CrossRef CAS.
- Y. Fan, H. Shao, J. Wang, L. Liu, J. Zhang and C. Cao, Chem. Commun., 2011, 47, 3469–3471 RSC.
- X. H. Xia, J. P. Tu, X. L. Wang, C. D. Gu and X. B. Zhao, J. Mater. Chem., 2011, 21, 671–679 RSC.
- W. Zhou, C. Cheng, J. Liu, Y. Y. Tay, J. Jiang, X. Jia, J. Zhang, H. Gong, H. H. Hang, T. Yu and H. J. Fan, Adv. Funct. Mater., 2011, 21, 2439–2445 CrossRef CAS.
- S. L. Chou, J. Z. Wang, D. Wexler, K. Konstantinov, C. Zhong, H. K. Liu and S. X. Dou, J. Mater. Chem., 2010, 20, 2092–2098 RSC.
- H. Liu, G. Wang, J. Park, J. Wang and C. Zhang, Electrochim. Acta, 2009, 54, 1733–1736 CrossRef CAS.
- L. Yang, Q. Gao, Y. Zhang, Y. Tang and Y. Wu, Electrochem. Commun., 2008, 10, 118–122 CrossRef CAS.
- Y. Han, Y. Wang, L. Li, Y. Wang, L. Jiao, H. Yuan and S. Liu, Electrochim. Acta, 2011, 56, 3175–3181 CrossRef CAS.
- W. Zhou, L. Lin, W. Wang, L. Zhang, Q. Wu, J. Li and L. Guo, J. Phys. Chem. C, 2011, 115, 7126–7133 CAS.
- H. S. Kim, Y. Piao, S. H. Kang, T. Hyeon and Y. E. Sung, Electrochem. Commun., 2010, 12, 382–385 CrossRef CAS.
- D. S. Su and R. Schlögl, Chem. Sus. Chem., 2010, 3, 136–168 CrossRef CAS.
- B. T. Hang, T. Doi, S. Okada and J. Yamaki, J. Power Sources, 2007, 174, 493–500 CrossRef CAS.
- C. Ban, Z. Wu, D. T. Gillaspie, L. Chen, Y. Yan, J. L. Blackburn and A. C. Dillon, Adv. Mater., 2010, 22, E145–E149 CrossRef CAS.
- Y. Zhao, J. Li, C. Wu and L. Guan, Nanoscale. Res. Lett., 2011, 6, 71–75 CAS.
- J. Zhu, T. Zhu, X. Zhou, Y. Zhang, X. W. Lou, X. Chen, H. Zhang, H. H. Hng and Q. Yan, Nanoscale, 2011, 3, 1084–1089 RSC.
- X. Zhu, Y. Zhu, S. Murali, M. D. Stoller and R. S. Ruoff, ACS Nano, 2011, 5, 3333–3338 CrossRef CAS.
- G. Wang, T. Liu, Y. Luo, Y. Zhao, Z. Ren, J. Bai and H. Wang, J. Alloys Compd., 2011, 24, L216–L220 CrossRef.
- F. Cheng, K. Huang, S. Liu, J. Liu and R. Deng, Electrochim. Acta, 2011, 56, 5593–5595 CrossRef CAS.
- J. X. Li, Y. Zhao and L. H. Guan, Electrochem. Commun., 2010, 12, 592–595 CrossRef CAS.
- J. Li, Y. Zhao, N. Wang and L. Guan, Chem. Commun., 2011, 47, 5238–5240 RSC.
- J. Cambedouzou, V. Pichot, S. Rols, P. Launois, P. Petit, R. Klement, H. Kataura and R. Almairac, Eur. Phys. J. B, 2004, 42, 31–45 CrossRef CAS.
- P. Zhang, Z. P. Guo and H. K. Liu, Electrochim. Acta, 2011, 55, 8521–8526 CrossRef.
- S. D. Xu, Q. C. Zhuang, L. L. Tian, Y. P. Qin, L. Fang and S. G. Sun, J. Phys. Chem. C, 2011, 115, 9210–9219 CAS.
- S. Kawasaki, Y. Iwai and M. Hirose, Carbon, 2009, 47, 1081–1086 CrossRef CAS.
Footnote |
| † Electronic supplementary information (ESI) available: See DOI: 10.1039/c2ra20071f |
| This journal is © The Royal Society of Chemistry 2012 |
