Nanosize effects of sulfonated carbon nanofiber fabrics for high capacity ion-exchanger†
Shinji
Imaizumi
,
Hidetoshi
Matsumoto
*,
Minoru
Ashizawa
,
Mie
Minagawa
and
Akihiko
Tanioka
*
Department of Organic and Polymeric Materials, Tokyo Institute of Technology, Mail Box S8-27, 2-12-1 Ookayma, Meguro-ku, Tokyo 152-8552, Japan. E-mail: matsumoto.h.ac@mm.titech.ac.jp; tanioka.a.aa@m.titech.ac.jp; Fax: +81-3-5734-3640 (HM); Fax: +81-3-5734-2876 (AT); Tel: +81-3-5734-3640 (HM) Tel: +81-3-5734-2426 (AT)
First published on 20th January 2012
Abstract
In the present paper, we report a novel ion-exchange carbon nanomaterial, surface sulfonated carbon nanofiber (S-CNF) fabrics, with a high surface area and high ion-exchange and adsorption capacities. S-CNF fabrics bearing SO3H groups were prepared by electrospinning, successive carbonization and sulfonation. We observed a nanosize effect, in which the surface area, and ion-exchange and adsorption capacities significantly increase with a decrease in the fiber diameter. The prepared fabrics with a diameter of 80 nm had the maximum values for the total pore surface area of 32.2 m2 g−1, the ion-exchange capacity of 2.94 mmol g−1, and an adsorption capacity of 943.1 mg g−1 for methylene blue (MB). The MB adsorption capacity is two times higher than that of commercial activated carbons. These results highlight the fact that the surface functionalized CNF fabrics with ionic groups are promising materials for high-capacity ion-exchangers.
Introduction
Electrospinning is a straightforward and versatile method for forming continuous thin fibers based on an electrohydrodynamic process.1–4 This method has the following advantages: (i) ability to produce thin fibers with diameters in the micrometre and nanometre ranges; (ii) the one-step forming of two- or three-dimensional nanofiber network assemblies (nanofiber fabrics); and (iii) applicability to a broad spectrum of molecules, such as inorganic molecules, synthetic and biological polymers, proteins, and DNA. Electrospun nanofibers or nanofiber fabrics with high surface areas have recently attracted much attention for various practical applications, such as high performance filter media, protective clothes, battery separator and electrode materials, composites, drug delivery systems, and biomaterial scaffolds for tissue engineering. The combination of the nanofibrous morphology and the surface ion-exchange groups produces nanostructured ion-exchangers with high surface areas and high ion-exchange and adsorption capacities. Recently, some researchers reported the preparation of ion-exchange nanofibers by electrospinning. We have prepared ion-exchange nanofibers by electrospinning from biological polymers—chitosan and chondroitin sulfate—and synthetic polymers—polystyrene (PS) and poly(4-vinylpyridine) (P4VP).5,6 More recently, Elabd et al. reported that the proton conductivity of perfluorocarbon ion-exchanger (Nafion®) nanofibers sharply increased by decreasing the fiber diameter down to a nanometre-scale (the maximum conductivity of 1.5 S cm−1 for the nanofiber with a diameter of 400 nm is higher than that of 0.1 S cm−1 for the bulk film).7 However, the ion-exchange and adsorption capacities of nanoscale ion-exchange fibers have not been addressed. We now show the nanosize-enhanced properties of ion-exchange fibers.Carbon nanofibers (CNFs) have attracted much attention in many fields such as electrodes, capacitors, catalyst supports, sorbents, filter media, and reinforcement because of their high surface area, low density, good electrical and thermal conductivities, good mechanical strength and chemical stability.8–11 Our previous study showed that the phenolic resin-based CNF fabrics with a thinner diameter gave a higher specific surface area, good handling characteristics and flexibility, and higher battery performances.12,13 The surface functionalization of the CNFs also broadens their applications; the introduction of ion-exchange groups on the surface of the carbon nanomaterials realizes high-capacity adsorbents and high-activity catalysts.14–16 In addition, hydrophobic CNFs provide a platform suitable for verification of the nanosize effect on the surface functionality of ion-exchange nanofibers. The carbon matrix suppresses the water-swelling-induced morphological change of the nanofibers, which is commonly observed in polyelectrolyte nanofibers, and enables us to more correctly examine the nano-size effect on the properties of ion-exchange CNFs.
In the present study, we prepared sulfonated CNF (S-CNF) fabrics with various fiber diameters ranging from 80 nm to 1.45 μm by the sulfonation of the phenolic resin-based CNFs, and then characterized their physicochemical and adsorption properties. The aims of the present study are (i) to prepare S-CNF fabrics with various diameters by electrospinning, successive carbonization and sulfonation; and (ii) to investigate the relationship between the fiber diameter of the S-CNF fabrics and their physicochemical and adsorption properties.
Results and discussion
For electrospinning, the fiber diameter depends on the solution properties (e.g., viscosity, conductivity, surface tension, permittivity, and boiling point) and/or operating conditions (e.g., applied voltage, nozzle-to-target distance, and flow rate). Particularly, the viscosity and electrical conductivity of the spinning solutions are crucial factors for controlling the fiber diameter.12 In the present study, CNFs with diameters ranging from 80 nm to 1.45 μm were prepared by electrospinning from the phenolic resin (PhR, carbon precursor)/poly(vinyl butyral) (PVB, electrospinnable carrier polymer)/methanol (MeOH, solvent) solutions. For the preparation of thinner fibers, two kinds of weak electrolytes, pyridine (Py) and sodium carbonate (Na2CO3), were added to the spinning solution (the composition and properties of the spinning solutions, C1–C5, are listed in Table S1†). We succeeded in preparing smooth fibers with a finite fiber diameter distribution. We selected five kinds of CNF fabrics with average diameters (D) of 80 ± 20 nm, 120 ± 20 nm, 220 ± 70 nm, 340 ± 100 nm, and 1.45 ± 0.4 μm for sulfonation (the effects of the solution viscosity and conductivity on the fiber diameter of the CNFs are shown in Fig. S1 and S2,† respectively). Sulfonation of the CNF fabrics was carried out by using fuming sulfuric acid (experimental details are included in the ESI†). Fig. 1 shows the surface SEM images of the CNF and S-CNF fabrics. The difference in the surface morphologies between the CNF and S-CNF fabrics cannot be found.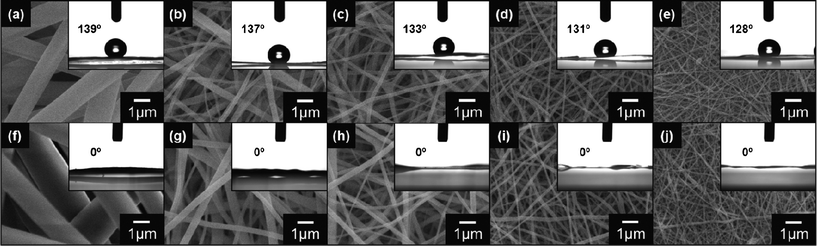 | ||
| Fig. 1 Surface SEM images of the CNF fabrics from the (a) C1, (b) C2, (c) C3, (d) C4, and (e) C5 solutions and the S-CNF fabrics from the (f) C1, (g) C2, (h) C3, (i) C4, and (j) C5 solutions. The insets are the shapes of 2 μL water droplets and contact angles on the corresponding fabric surfaces. | ||
To confirm the sulfonation of the CNF fabrics, Fourier transform infrared spectroscopy (FT-IR), X-ray photoelectron spectroscopy (XPS), and water contact angle (CA) measurements were carried out. Fig. 2 shows the FT-IR spectra of the CNFs and S-CNFs with diameters ranging from 80 nm–1.45 μm. All the S-CNF fabrics showed similar spectra. The vibration bands at 1040 cm−1 (SO3− stretching) and 1403 cm−1 (O![[double bond, length as m-dash]](https://www.rsc.org/images/entities/char_e001.gif) SO stretching in SO3H) in the spectra showed that the resulting material possesses SO3H groups.15 The peaks at 1468 cm−1, which indicate the C–H bending of the CNF fabric, disappeared after the sulfonation. In addition, the XPS S2p peak at 168 eV for the S-CNF fabrics is attributed to the SO3H groups (Fig. S3†). These results demonstrated that the SO3H groups replaced the hydrogen at the edges of the carbon structures via the sulfonation.
SO stretching in SO3H) in the spectra showed that the resulting material possesses SO3H groups.15 The peaks at 1468 cm−1, which indicate the C–H bending of the CNF fabric, disappeared after the sulfonation. In addition, the XPS S2p peak at 168 eV for the S-CNF fabrics is attributed to the SO3H groups (Fig. S3†). These results demonstrated that the SO3H groups replaced the hydrogen at the edges of the carbon structures via the sulfonation.
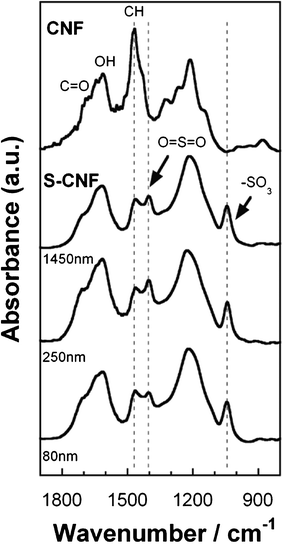 | ||
| Fig. 2 FT-IR spectra for the S-CNFs of various diameters. | ||
The CAs for all the fabrics shown in Fig. 1 (insets) clearly revealed the difference in the wettability between the CNF and the S-CNF fabrics. The surface of the CNF fabrics showed hydrophobic properties; the CA is 133.5 ± 4.3°. In contrast, after the sulfonation, the S-CNF fabrics had superhydrophilic surfaces; the water contact angle is 0°. These results suggest that the prepared S-CNF fabrics possess a high number of surface hydrophilic groups, such as SO3H groups, due to the sulfonation.
To elucidate the internal structure of the S-CNFs, Raman spectroscopy measurements were performed. Fig. 3 shows the Raman spectra of the S-CNF fabrics. The typical peaks are a D-band around 1360 cm−1 corresponding to the amorphous carbon and structural defect (A1g D breathing mode), and a G-band around 1580 cm−1 corresponding to the graphite structures and the tangential shearing mode of the carbon atom (E2g G mode). The relative intensity ratio of the D-band to the G-band, ID/IG, indicates the amount of structurally ordered graphite crystallites in the carbonaceous materials.17,18 The ID/IG ratio for all the samples was around 0.68. This indicates that the fiber diameter does not significantly influence the degree of graphitization in the CNFs and the amorphous structures (disordered carbonaceous components) are maintained in the CNFs.
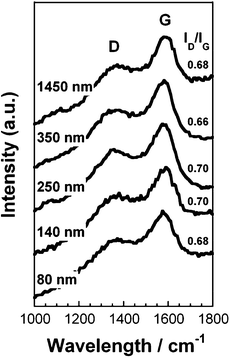 | ||
| Fig. 3 Raman spectra for the S-CNF fabrics of various diameters. | ||
The physicochemical properties of the S-CNF fabrics (total pore surface area, ion-exchange capacity, and BET specific surface area) are shown in Fig. 4. The total pore surface area estimated by mercury porosimetry measurements increased with a decrease in the fiber diameter (Fig. 4a). It was in the range of 3.0–32.2 m2 g−1. The theoretical curve obtained from eqn (S1)† agreed well the experimental results, and the bulk density obtained from the curve is 1.54 g cm−3 which is equal to that of commercial glassy carbon fibers forming amorphous structures (1.4–1.6 g cm−1).19 This curve supports the fact that the fiber-diameter dependence of the total pore surface area is a typical trend for nanofibers, and predicts that the total pore surface area would dramatically increase when the fiber is thinner (<50 nm). On the other hand, the BET specific surface area of the fabrics did not dramatically increase with a decrease in the fiber diameter (Fig. S4†). It was in the range of 390–480 m2g−1, which compares to that of a phenolic resin-based activated carbon,20 and much higher than the total pore surface area. The difference between the total pore surface area and BET specific surface area is due to the differences in the characterization methods. Mercury porosimetry is commonly used for the characterization of meso- and macroporous structures and cannot detect small pores with a size of less than 3 nm, but the BET specific surface area reflects the contributions of very small pores with diameters of less than 3 nm in the fabrics.
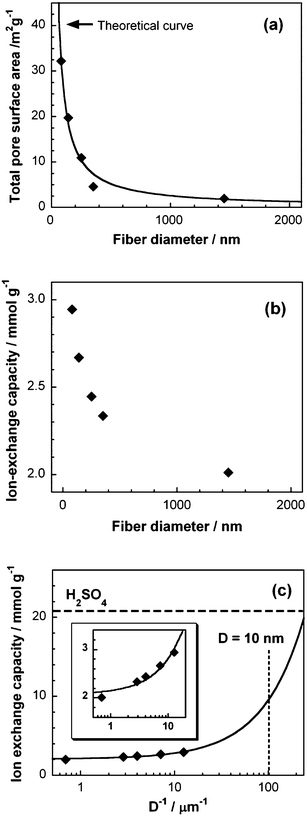 | ||
| Fig. 4 Effect of the fiber diameter on (a) total pore surface area, (b) ion-exchange capacity of the S-CNF fabrics, and (c) ion-exchange capacity for the S-CNF fabrics as a function of the reciprocal fiber diameter. (inset) Enlarged view for the low values of the reciprocal fiber diameter. | ||
The ion-exchange capacity (IEC) of the S-CNF fabrics increased with a decrease in the fiber diameter (Fig. 4b). This is due to the surface area effect of the nanofibers. The maximum value of the IEC of the 80-nm S-CNFs (2.94 mmol g−1) is three times higher than the other commercial ion-exchange materials such as Nafion® (1.0 mmol g−1).21 In addition, by using linear-approximation of the experimental results, we can roughly estimate the IEC of the S-CNF fabrics with very thin diameters (<50 nm); the IEC of the S-CNFs with D = 10 nm and D = 5 nm would be 10 mmol g−1 and 17.5 mmol g−1, respectively (see Fig. 4c). These predictions support the potentiality of S-CNFs.
On the other hand, the zeta potential for the S-CNF fabrics, which reflects the surface charge density, did not show any fiber diameter dependence (Fig. S5†). These results supported the fact that the sulfonation can introduce sulfonic acid into the vicinity of the fabric surface with a constant charge density (apparent charge density estimated from zeta potential using eqn (S2)† ≈ 0.47 μC cm−2).
The adsorption test of the S-CNF fabric was carried out using the cationic dye methylene blue (MB) as the adsorbent (experimental details are included in the ESI†). As shown in Fig. 5, the color of the 100 mg L−1 MB solution disappeared after treatment with the S-CNF fabric of D = 1.45 μm, and the color of the fabric also changed from dark-brown to blue. This demonstrates that the S-CNF fabric can efficiently adsorb dye molecules. For comparison, adsorption experiments for pristine CNFs were carried out. The adsorption capacities of all the pristine CNFs were quite low (Fig. S6†). This shows that there are only a few adsorption sites on the pristine CNF.
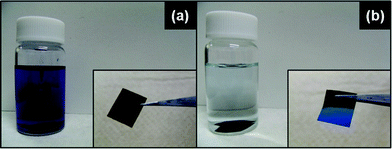 | ||
| Fig. 5 MB solutions (a) before and (b) after the treatment with the S-CNF fabric (D = 1.45 μm) for 150 h. Insets are the S-CNF fabrics (a) before and (b) after the treatment. | ||
To analyze the adsorption behavior in detail, the adsorption isotherms for the MB adsorption over the S-CNFs were obtained after adsorption for 150 h, and the results are shown in Fig. 6a. The amounts of the adsorbed MB over the S-CNF fabrics increased with a decrease in the diameter of the fabrics. The adsorption isotherms of the S-CNF fabrics have been plotted (see Fig. S7†) and analyzed using the following Langmuir model:22–24
 | (1) |
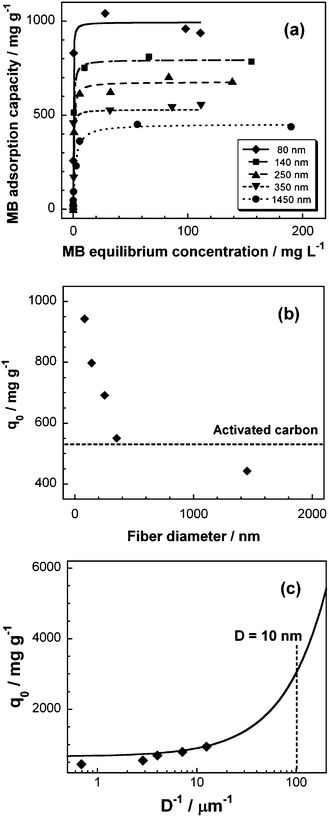 | ||
| Fig. 6 (a) Adsorption isotherms for MB adsorption over the S-CNF fabrics of various diameters and (b) effect of the fiber diameter on the MB adsorption capacity of the S-CNF fabrics, and (c) MB adsorption capacity for the S-CNF fabrics as a function of the reciprocal fiber diameter. | ||
| S-CNF diameter/nm | q 0/mg g−1 | b/L mg−1 | R 2 |
|---|---|---|---|
| 1450 | 443.1 | 1.04 | 0.998 |
| 350 | 550.7 | 1.05 | 0.992 |
| 250 | 691.9 | 1.06 | 0.999 |
| 140 | 798.0 | 1.04 | 0.997 |
| 80 | 943.1 | 1.15 | 0.994 |
Fig. 6b shows the effect of the fiber diameter on the adsorption capacity of the S-CNFs. The maximum adsorption capacity (q0) of the S-CNFs significantly increased with a decrease in the diameter of the S-CNFs. This is also due to the surface area effect of the nanofibers (shown in Fig. 4). The MB adsorption capacity of the 80-nm S-CNF (943.1 mg g−1) was twice as high as the value for the commercial activated carbon (541.5 mg g−1, see Fig. S8†). On the other hand, the affinity coefficient (b) between the sorbent active sites and the adsorbate did not show any fiber diameter dependence (Table 1). This also supported the fact that the fiber diameter dependence of the MB adsorption is based on the surface area effect of the nanofibers. We compared the experimental value of the adsorption capacity (qExp) with the theoretical results (qTheo) calculated by the following equation:
| qTheo = MW × CIEC × 1000 | (2) |
Temperature is also an important factor for the adsorption behavior. The adsorption treatments at high temperature improved the equilibrium capacity of the adsorbent (see Fig. S9, detailed discussions are included in the ESI†). The thermal stabilities of the S-CNFs and CNFs were examined by thermogravimetric (TG) analysis (see Fig. S10†). From the TG curve, we can find that the S-CNFs showed good thermal stabilities below 200 °C. The carbon-based ion-exchange nanofibers with a good heat resistance are promising materials for highly-efficient adsorption processes.
Conclusions
We have prepared a novel ion-exchange carbon nanomaterial, i.e., surface sulfonated carbon nanofiber fabrics, with diameters of 80 nm–1.45 μm by electrospinning, carbonization, and sulfonation. In addition, we have experimentally verified the nanosize effect on the properties of the fabrics in which the surface area, ion-exchange capacity (IEC), and adsorption capacity significantly increased with the decreasing fiber diameter. The maximum MB adsorption capacity was 943.1 mg g−1, which was two times higher than that of the commercial activated carbon. In addition, CNF fabrics can provide excellent chemical, mechanical, and thermal stabilities and good handling characteristics. They do not need any separation process after immersion of the sample in the liquid media for adsorption or other reaction processes. High-capacity ion-exchange nanofiber fabrics are potentially applicable in the fields of biotechnology, pharmaceutical processing, producing ultrapure water for the semiconductor industry, catalytic conversion processing, battery technologies, and radioactive and hazardous waste treatment. Our predictions demonstrate that decreasing the fiber diameter dramatically improves the property of the fabrics when the diameter is less than 50 nm (Fig. 4c and 6c). Further studies on the preparation of S-CNF fabrics with diameters less than 50 nm are now in progress and the results will be reported.Experimental
Materials
The phenolic resin (PhR, novolac resin, MW = 4000–5000) was obtained from Gunei Chemical Industry, Japan. Poly(vinyl butyral) with a molecular weight of 340![[thin space (1/6-em)]](https://www.rsc.org/images/entities/char_2009.gif) 000 was purchased from Wako, Japan. Methanol (MeOH), pyridine (Py), and sodium carbonate (Na2CO3) of extra-pure grade were obtained from Wako, Japan. These reagents were used without further purification. Fuming sulfuric acid (15 wt.% SO3) was obtained from Sigma-Aldrich. Methylene blue (MB) was obtained from Wako, Japan. The activated carbon (Darco® G-60) was obtained from Wako, Japan.
000 was purchased from Wako, Japan. Methanol (MeOH), pyridine (Py), and sodium carbonate (Na2CO3) of extra-pure grade were obtained from Wako, Japan. These reagents were used without further purification. Fuming sulfuric acid (15 wt.% SO3) was obtained from Sigma-Aldrich. Methylene blue (MB) was obtained from Wako, Japan. The activated carbon (Darco® G-60) was obtained from Wako, Japan.
Preparation of carbon nanofiber fabrics
The electrospinning setup is the same as that previously described.12 The electrospinning device consists of a syringe-type infusion pump (MCIP-III, Minato Concept, Japan), a high voltage regulated DC power supply (HDV-20 K 7.5 STD Pulse Electronic Engineering, Japan), and a grounded substrate (aluminium sheet, 100 × 100 mm2 area). The polymer solutions were contained in a syringe with a stainless steel nozzle (0.5 mm internal diameter). The applied voltage was 15 kV, the distance between the tip of the nozzle and the collector was 100 mm, and the flow rate of the solution was about 0.01 mL min−1. All spinnings were carried out at 25 ± 1 °C and at less than 35% relative humidity. The as-spun phenolic resin fabrics were cured by adding formaldehyde and then carbonized at 400 °C in a ceramic furnace for 2 h under a continuous nitrogen purge.12Sulfonation of carbon nanofiber fabrics
The carbon nanofiber fabrics were immersed in fuming sulfuric acid (15 wt.% SO3) at 90 °C under an argon gas atmosphere for 10 h. The prepared fabrics were thoroughly washed with deionized water to remove any excess sulfuric acid in the fabrics.Characterization
The surface morphologies of the carbon nanofiber (CNF) fabrics and sulfonated carbon nanofiber (S-CNF) fabrics were observed using a scanning electron microscope (SEM, SM-200, Topcon, Japan) operated at 10 kV. All SEM samples were sputter-coated with Au. The contact angles of the CNF and S-CNF fabrics were measured using a contact angle measurement system (DropMaster 500, Kyowa Interface Science, Japan). The volume of the water droplets for the measurements was 2 μL. All measurements were carried out at five or more different points for each sample. Infrared spectra of the S-CNF fabrics were measured by the KBr pellet method using a Fourier transform infrared spectrometer (FT/IR-410, JASCO, Japan) with 64 scans at a 1 cm−1 resolution from 4000 to 400 cm−1. For measuring X-ray photoelectron spectra (XPS), we used scanning ESCA microprobe (Quantum-2000, ULVAC-PHI, Japan). The Raman spectra of the S-CNF fabrics were excited by 514.5 nm radiations from an Ar ion laser at 10 mW and obtained with a 60 s integration time using a laser Raman spectrometer (NRS-2100, JASCO, Japan). The total pore surface areas and the Brunauer–Emmett–Teller (BET) specific surface areas25 of the S-CNF fabrics were determined by mercury porosimetry measurements using an instrument (Auto Pore 9520, Micromeritics, USA) and N2 adsorption isotherms measured at 77 K using an adsorption apparatus (ASAP 2010, Micromeritics, USA), respectively. The ion-exchange capacity of the S-CNF fabrics was determined by the potentiometric titrations. The potentiometric titration was performed using an automatic titrator (DMS Titrino 716, Metrohm, Switzerland) connected to a combined pH glass electrode (#6.0258.010, Metrohm, Switzerland) as previously described.6 To evaluate the surface charge density of the S-CNF fabrics, the streaming potential measurements were carried out using an electrokinetic analyzer (SurPASS, Anton Paar GmbH, Austria) equipped with a clamping cell as previously described.26 A background electrolyte of a 1 mmol L−1 KCl solution was used. The S-CNF test fabrics (1 × 1 cm2) were immersed in 15 ml each of 1, 2, 5, 10, 50, 75, 100, 150, 200, 250, 300 mg L−1 MB/phosphate equimolal pH standard solutions (pH 6.86, in 25 °C, TOA-DKK, Japan) and the adsorption experiments were carried out in a reciprocating shaker for 150 h. The dye adsorption was determined by a UV-visible double beam spectrometer (U-2800, Hitachi, Japan).Acknowledgements
The authors thank Mr Masaru Kimura, Gun Ei Chemical Industry Co., Ltd., and Mr Takuro Niimura and Mr Kenichi Suzuki, Tokyo Institute of Technology, for their helpful comments on the preparation and functionalization of carbon nanofibers. This study was partly supported by a Grant-in-Aid for Young Scientists (B) (No. 20710105) from the Ministry of Education, Culture, Sports, Science, and Technology, Japan and “the NEDO Special Course for Innovations in Nanofibers” from the New Energy and Industrial Technology Department Organization, NEDO, Japan. Shinji Imaizumi was supported by a Japan Society for Promotion of Science, JSPS, Fellowship for Young Scientists (DC2, No. 239234).References
- J. Doshi and D. H. Reneker, J. Electrost., 1995, 35, 151–160 CrossRef CAS.
- D. Li and Y. Xia, Adv. Mater., 2004, 16, 1151–1170 CrossRef CAS.
- A. Greiner and J. H. Wendorff, Angew. Chem., Int. Ed., 2007, 46, 5670–5703 CrossRef CAS.
- K. Yoon, B. S. Hsiao and B. Chu, J. Mater. Chem., 2008, 18, 5326–5334 RSC.
- H. Seo, H. Matsumoto, S. Hara, M. Minagawa, A. Tanioka, H. Yako, Y. Yamagata and K. Inoue, Polym. J., 2005, 37, 391–398 CrossRef CAS.
- H. Matsumoto, Y. Wakamatsu, M. Minagawa and A. Tanioka, J. Colloid Interface Sci., 2006, 293, 143–150 CrossRef CAS.
- B. Dong, L. Gwee, D. Salas-de la Cruz, K. I. Winey and Y. A. Elabd, Nano Lett., 2010, 10, 3785–3790 CrossRef CAS.
- S. J. Tans, A. R. M. Verschueren and C. Dekker, Nature, 1998, 393, 49–52 CrossRef CAS.
- A. C. Dillon, K. M. Jones, T. A. Bekkedahl, C. H. Kiang, D. S. Bethune and M. J. Heben, Nature, 1997, 386, 377–379 CrossRef CAS.
- Y. Hu, P. Adelhelm, B. Smarsly, S. Hore, M. Antonietti and J. Maier, Adv. Funct. Mater., 2007, 17, 1873–1878 CrossRef CAS.
- C. Kim and K. S. Yang, Appl. Phys. Lett., 2003, 83, 1216–1218 CrossRef CAS.
- S. Imaizumi, H. Matsumoto, K. Suzuki, M. Minagawa, M. Kimura and A. Tanioka, Polym. J., 2009, 41, 1124–1128 CrossRef CAS.
- P. Hiralal, S. Imaizumi, H. E. Unalan, H. Matsumoto, M. Minagawa, M. Rouvala, A. Tanioka and G. A. J. Amaratunga, ACS Nano, 2010, 4, 2730–2734 CrossRef CAS.
- M. Toda, A. Takagaki, M. Okamura, J. N. Kondo, S. Hayashi, K. Domen and M. Hara, Nature, 2005, 438, 178–178 CrossRef CAS.
- S. Suganuma, K. Nakajima, M. Kitano, D. Yamaguchi, H. Kato, S. Hayashi and M. Hara, J. Am. Chem. Soc., 2008, 130, 12787–12793 CrossRef CAS.
- L. Dai and A. W. H. Mau, Adv. Mater., 2008, 13, 899–913 CrossRef.
- T. Jawhari, A. Roid and J. Casado, Carbon, 1995, 33, 1561–1565 CrossRef CAS.
- P. C. Eklund, J. M. Holden and R. A. Jishi, Carbon, 1995, 33, 959–972 CrossRef CAS.
- Tokai Carbon Co., Ltd. (Japan), http://www.tokaicarbon.co.jp/en/products/fine_carbon/gc.html.
- K. Suzuki, H. Matsumoto, M. Minagawa, M. Kimura and A. Tanioka, Polym. J., 2007, 39, 1128–1134 CrossRef CAS.
- S. Saga, H. Matsumoto, K. Saito, M. Minagawa and A. Tanioka, J. Power Sources, 2008, 176, 16–22 CrossRef CAS.
- K. R. Hall, L. C. Eagleton, A. Acrivos and T. Vermeulen, Ind. Eng. Chem. Fundam., 1966, 5, 212–223 CAS.
- M. Vijayaraj, R. Gadiou, K. Anselme, C. Ghimbeu, C. V. Guterl, H. Orikasa, T. Kyotani and S. Ittisanronnachai, Adv. Funct. Mater., 2010, 20, 2489–2499 CrossRef CAS.
- E. Haque, J. W. Jun and S. H. Jhung, J. Hazard. Mater., 2011, 185, 507–511 CrossRef CAS.
- S. Brunauer, P. H. Emmett and E. Teller, J. Am. Chem. Soc., 1938, 60, 309–319 CrossRef CAS.
- H. Matsumoto, H. Yako, M. Minagawa and A. Tanioka, J. Colloid Interface Sci., 2007, 310, 678–681 CrossRef CAS.
Footnote |
| † Electronic supplementary information (ESI) available: (S1) The effect of the solution viscosity on the fiber diameters of the CNFs; (S2) The effect of the solution conductivity on the fiber diameter of the CNFs; (S3) The XPS S2p spectra of the CNF and the S-CNF; (S4) BET specific surface area for the S-CNFs as a function of the fiber diameter; (S5) Zeta potential for the S-CNFs as a function of the fiber diameter; (S6) Adsorption isotherms for MB adsorption over the pristine CNF and S-CNF; (S7) Langmuir plots of the isotherms for the S-CNFs of various diameters; (S8) Adsorption isotherms for MB adsorption over the activated carbon; (S9) Effect of temperature on the MB adsorption capacity of the S-CNFs; (S10) Thermogravimetric curves for the CNFs and the S-CNFs. See DOI: 10.1039/c2ra20103h |
| This journal is © The Royal Society of Chemistry 2012 |