Resolving the structure of a model hydrophobic surface: DODAB monolayers on mica
Nitya Nand
Gosvami
a,
Edward
Parsons
a,
Christian
Marcovich
cd,
Max L.
Berkowitz
b,
Bart W.
Hoogenboom
*c and
Susan
Perkin
*a
aDepartment of Chemistry, University College London, 20 Gordon Street, London, WC1H 0AJ, United Kingdom. E-mail: susan.perkin@ucl.ac.uk (SP)
bDepartment of Chemistry, University of North Carolina at Chapel Hill, Chapel Hill, North Carolina, 27599, USA
cLondon Centre for Nanotechnology and Department of Physics and Astronomy, University College London, 17-19 Gordon Street, London, WC1H 0AH, United Kingdom. E-mail: b.hoogenboom@ucl.ac.uk (BWH)
dEcole Polytechnique, F-91128, Palaisaeu, CEDEX, France
First published on 22nd March 2012
Abstract
The properties and interactions of hydrophobic surfaces in water are determining factors in a wide range of industrial applications, and represent a fundamental scientific problem that is far from solved. Langmuir–Blodgett (LB) lipid monolayers have often been used as model hydrophobic surfaces, but are only metastable, which compromises the interpretation of experiments. Using frequency-modulation atomic force microscopy (FM-AFM), we find that LB-deposited monolayers of dioctadecyldimethylammonium bromide (DODAB) on mica undergo two transitions upon immersion in water: (i) a rapid molecular rearrangement from a complete monolayer coverage to a more densely packed monolayer with holes exposing the mica substrate, followed by; (ii) a gradual flipping of lipids in the monolayer to form bilayers, at a timescale of many days, orders of magnitudes slower than previously reported. The (meta)stability of the monolayer shows little dependence on the deposition pressure (5–25 mN m−1), but strongly depends on the cleanliness of the preparation and, in AFM experiments, is reduced from days to minutes when the force applied by the AFM tip is not kept to well below 1 nN. When properly prepared and analysed, the DODAB/mica surface thus yields a well-defined structure of sufficient stability to study intersurface forces, albeit with a heterogeneity that gives rise to very distinct forces above the bare mica on one hand, and on the monolayer and bilayer areas on the other.
Introduction
Hydrophobic forces are accountable for a range of biologically and technologically important phenomena such as self-assembly and protein folding.1 Between macroscopic hydrophobic surfaces, long-range and attractive interactions have been observed. However, despite decades of studies on the nature of this long-range attraction, a clear picture is yet to emerge.1–4 It is believed that the stability of hydrophobic surfaces under water plays a significant role in hydrophobic interactions5–7 and that non-uniformity of surface charge may be the origin of long-range forces between apparently hydrophobic surfaces. Several approaches have been adopted to create hydrophobic model surfaces, including the deposition of a variety of lipids on mica using solution spreading5,8 or the Langmuir–Blodgett (LB) technique,9 and more recently the deposition of silanes on plasma activated mica surfaces.10 The LB technique is the most commonly used method due to its simplicity and its ability to produce single or multiple molecular layers of a large variety of amphiphilic molecules. Amphiphilic DODAB is commercially available with high purity and forms monolayer and bilayer films on mica surfaces.11 DODAB films on mica have therefore often been used as model hydrophobic surfaces in experiments using techniques such as the surface force balance (SFB).9,12,13 In early studies using DODAB films on mica, it was assumed that the films are stable in water during the entire duration of the experiment.9 However, in a more recent study,14 it was claimed that the monolayer of DODAB rearranges under water to form a bilayer within ∼90 min, leaving the mica surface covered with patches of positively charged bilayer. The observed long-range interactions between such surfaces would therefore be of electrostatic rather than of hydrophobic origin. This interpretation is supported by experiments on silane films on plasma-treated mica surfaces which do not rearrange under water and exhibit shorter-range attractions,3 further indicating the importance of stability of the deposited film. To understand the true nature of hydrophobic interactions, it is therefore of prime importance that the model surfaces used are characterized in terms of their nano-scale structure, their stability, and local variations in electrostatic forces.Various techniques have been employed in the past to characterize lipid layers supported on solid surfaces, including contact angle goniometry,15,16 ellipsometry,17 X-ray reflectivity,18 neutron reflection19 and atomic force microscopy (AFM).20,21 AFM provides the most powerful tool to visualize the three dimensional structure of such films with high spatial resolution. On some films, contact-mode AFM has even achieved molecular resolution.11 However, due to the relatively large normal pressures and shear forces exerted by the probing tip in such an experiment, it is not trivial to avoid mechanical deformation of the monolayer. Recently, frequency-modulation AFM (FM-AFM) has emerged as a powerful tool to study soft samples such as lipids22 and biological molecules23,24 in liquid environment, with high resolution and precise control of the applied forces.
To solve the above-mentioned controversy on the nature of the DODAB films in water, we here use minimally invasive FM-AFM to monitor the nano-scale structure and stability of LB-deposited DODAB films on mica, as a function of time after immersion in water and as a function of deposition pressure. We highlight different factors that can affect the (meta)stability of the DODAB monolayer films. Finally, we perform force spectroscopy to investigate the local variation in tip-surface interactions.
Experimental method
A commercially available LB trough (NIMA Technology-model 601M-B) was used for monolayer deposition. The trough was thoroughly cleaned with chloroform and absolute ethanol using soft tissues (Kimtech Science-75512) and was rinsed several times with ultrapure water (Barnstead Nanopure system) with total organic content (TOC) reading, which provides pure water with resistivity higher than 18 MΩ cm−1 and TOC reading < 1 ppb. This was repeated until the surface pressure of the water remained constant on changing its surface area by completely opening and closing the barriers. The mica (special V2 grade, S&J Trading Inc.) was cut into the desired shape and was cleaved just prior to dipping inside the LB trough. All glassware was cleaned using piranha solution for 3 h, followed by thorough rinsing with ultrapure water and absolute ethanol. DODAB (Acros Chemicals, 99+% purity) was dissolved in pure chloroform (Merck, 99.9% purity) to prepare a 1 mM solution and was introduced into the LB trough using a syringe. The set up was left for 15 min after DODAB addition to allow for the solvent to evaporate.The barriers were then closed slowly to reduce the DODAB-covered area with a constant speed of 5 cm2 min−1. The change in pressure and area was recorded as a function of time. Fig. 1 shows the surface pressure and area between the barriers during compression and deposition of an LB film of DODAB. The barriers were closed, causing the surface pressure to gradually increase, until the desired deposition pressure was reached (5, 15 or 25 mN m−1).
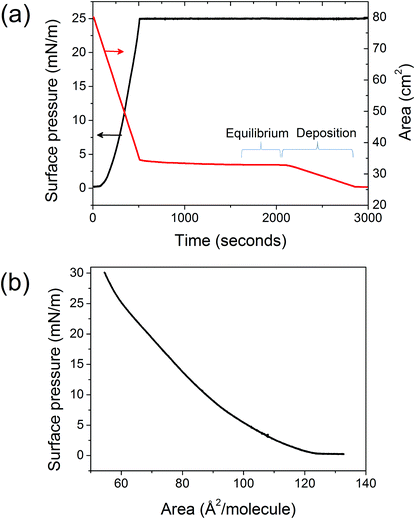 | ||
| Fig. 1 LB deposition of DODAB monolayer on mica: (a) area between the barriers of the LB trough and the surface pressure, both as a function of time, as the barriers are slowly closed to compress the DODAB monolayer to the desired pressure (25 mN m−1). (b) Surface pressure versus area isotherm obtained for the DODAB monolayer on the water surface in the LB trough. | ||
The choice of barrier material was found to be an important factor in these experiments. When, in initial experiments, hydrophobic barriers made of Teflon were used, the area between the barriers dropped for several tens of minutes before it attained a constant value. In some cases, no equilibrium was reached at all. The drop in area was several cm2 compared to a total area of ∼30–40 cm2. The rather variable, long settling time and large drop in area are possibly due to leakage of the lipid molecules from underneath the barriers.25 However, with hydrophilic barriers made of Delrin, the settling time and drop in area were significantly reduced, respectively, from thousands to few hundred seconds and from several cm2 to ∼1 cm2. Therefore, in this paper we only present data for samples which were prepared using the Delrin barriers in the LB trough, with the exception of the data in Fig. 4 (see text below).
The pressure was then maintained at a constant value using a software controlled feedback mechanism until the deposition was completed. The deposition was started only when the area became constant (appears as a horizontal line in Fig. 1 (a)), indicating that the monolayer had reached equilibrium. The pulling rate of the dipper during deposition was chosen to be slow enough (1 mm min−1) to maintain the equilibrium. The sample was then glued on top of a magnetic disk for AFM imaging using a small drop of superglue (Loctite-406).
Commercial AFMs (Veeco Multimode IV and JPK Nanowizard I) were used for imaging DODAB in tapping mode in air and in contact mode in water. Tapping mode was found to be suitable for imaging in air, as it minimizes shear forces and their impact on the soft monolayer, in contrast to contact mode. FM-AFM imaging under water was performed on a microscope with a homebuilt interferometric detection system for cantilever deflection, which gives significantly higher signal-to-noise ratio than commercial AFMs,26 routinely yielding atomic-resolution images of mica in aqueous solution. Further details of the setup can be found elsewhere.23,26–28 Commercially available AFM cantilevers were used (Nanosensors PPP-NCH) for imaging in tapping mode in air as well as in FM mode in water, and triangular silicon nitride cantilevers (Bruker AFM Probes-MLCT) were used for imaging in contact mode and for force spectroscopy under water. Contact-mode force spectroscopy data were analyzed and averaged in Matlab. Imaging forces in FM-AFM were determined by converting the frequency shifts into tip-sample forces, as explained elsewhere.29 For imaging in water, a drop of pure water (∼200 μl) was placed on the surface of the sample and the AFM fluid cell was also filled through its flow channels. The flow channels were occasionally refilled with ultrapure water, in order to compensate for the water evaporated during the measurement. The imaging amplitude was kept between 1–3 nm, which was found to be suitable to obtain stable and high-contrast images of the DODAB films on mica.
Results
The AFM images of DODAB, deposited at 25 mN m−1, with corresponding height profiles are shown in Fig. 2(a), (b) and (c), acquired using tapping mode in air and FM mode in water. In air, DODAB forms a smooth and uniform film with almost 100% coverage (Fig. 2(a)). The roughness of the film in air is 5 Å peak-to-peak, indicating a highly uniform and clean film. After adding water to the layer, the uniform layer is seen to reorganize into two distinct stages at two very different timescales. The first reorganization occurs within 10 min, which was the typical time required between the addition of water and the first recorded AFM images. This reorganization leads to compaction of the DODAB monolayer as shown in Fig. 2(b). The surface coverage of DODAB shrinks to ∼90% as a result of this rearrangement, and exposed mica can be observed as holes within the monolayer. This suggests that the DODAB molecules tend to pack more densely under water in order to minimize the interaction of their hydrophobic tails with the polar water molecules. The second reorganization occurs much more slowly (see below for a more quantitative analysis) and can be seen as a roundening and smoothing of the hole shapes, in addition to the appearance of bilayers (brighter patches, corresponding to ∼9% of the total area after ∼7 days in water), as shown in Fig. 2(c). The bilayer transition always takes place in the vicinity of the holes in the DODAB film, which leads to an increase of bare-mica area as the bilayer growth progresses. Fig. 2(d), (e) and (f) show simplified schematics of probable molecular arrangements of DODAB molecules that correspond to the AFM images.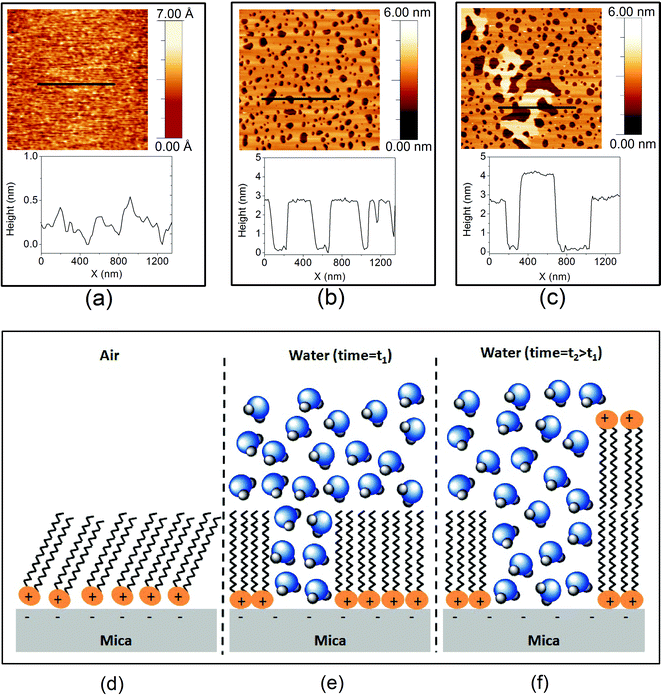 | ||
| Fig. 2 AFM images and topographic line-profiles for DODAB, a) 3 × 3 μm2 area imaged in air, b) 3 × 3 μm2 area imaged 30 min after immersion in pure water and c) 3 × 3 μm2 area imaged after ∼7 days of immersion in water. Bottom, schematic showing a proposed molecular arrangement of the DODAB on mica (see text, not to scale and ignoring bilayer edge effects); d) in air, e) under pure water and f) after prolonged immersion in water. | ||
The percentages of bare mica, monolayer and bilayer coverage were calculated from a statistical analysis of the images. As shown in Fig. 3(a), the height data for each image were plotted in a histogram and the main peaks were fitted to Gaussian curves. The area under each Gaussian curve corresponds to one type of surface coverage and was used to determine the relative proportions of bare mica, monolayer and bilayer on the surface. Similar analyses were performed for several other DODAB samples, prepared at different surface pressures using the same method. Fig. 3(b) shows surface coverage of the DODAB monolayer on mica for three different deposition pressures (5, 15 and 25 mN m−1). It is evident that the higher surface pressure used for deposition results in higher surface coverage of DODAB monolayer on mica. It is also important to explore how the deposition pressure of DODAB will affect the monolayer stability in water, as different deposition pressures result in different amounts of holes (i.e., regions of exposed mica), which appear to act as nucleation sites for the bilayer switching. Fig. 3(c) shows the results from the analysis of AFM images that were acquired for DODAB deposited at three different surface pressures. Two samples for each deposition pressure were imaged under water as a function of time. For all the samples, there was no bilayer formation observed over several hours of AFM imaging after the immersion in water. The images were acquired within 10–20 min after addition of water and continued for several hours, after which the sample was stored in a sealed container and immersed under a water droplet overnight. After AFM imaging the next day, all the samples were stored under water for another week and then imaged again. It was ensured that once the water drop was placed on the sample surface, it was kept immersed under water and the containers were air sealed and wet tissue was placed next to the sample to ensure minimal evaporation of the droplet. Except for one sample, none of the other samples showed any bilayer formation after overnight immersion in water, which suggests that a variation in deposition pressure between 5–25 mN m−1 has no dramatic effect on monolayer to bilayer transition kinetics. After 7 days of immersion, most of the samples showed patches of bilayers, covering <25% of the surface and showing significant variations between the different samples, but no clear correlation between bilayer coverage and deposition pressure.
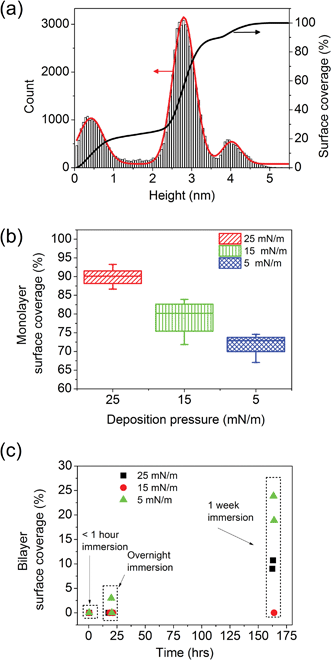 | ||
| Fig. 3 (a) Histogram showing the height distribution (for each pixel of a 256 × 256 pixels image) of a 3 × 3 μm2 mica surface covered with DODAB monolayer and bilayer after ∼7 days of immersion in water. Three clear peaks can be distinguished, corresponding to mica, DODAB monolayers and DODAB bilayers. The red curve shows the Gaussian fits to the peaks. (b) Monolayer coverage on mica for DODAB samples deposited at three different surface pressures, within an hour after immersion in water (data is shown for four samples for each surface pressure and the error bars indicate the range of monolayer surface coverage observed). (c) Bilayer coverage as a function of time after immersion in water for DODAB samples prepared at three different deposition pressures (two samples per deposition pressure). | ||
In rare cases (<10% of the total number of samples investigated) and only under suboptimal deposition conditions (Teflon barriers, see methods), the monolayer-to-bilayer transition occurred significantly faster (within hours rather than days) than reported above. This suggests that clean deposition conditions are essential for obtaining reproducible transition kinetics. Though atypical in kinetics, these transitions showed similar structural changes as the other samples. Most conveniently, their kinetics enabled us to continuously follow the molecular rearrangements in the same area of the surface, i.e., without drifting too far from the initial measurement position. This could not as easily be obtained by temperature variation, as we found that a 15 degree increase in temperature for a single sample did not lead to significant change in the transition rate. Fig. 4 shows an example where the monolayer-to-bilayer transition of DODAB was thus monitored in real time on the same area of the DODAB coated surface using FM-AFM.
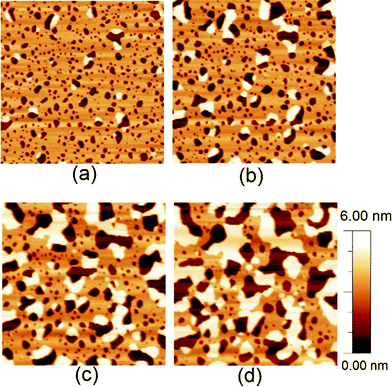 | ||
| Fig. 4 2 x 2 μm2 AFM images of the same area of DODAB-covered mica that shows atypically fast monolayer-to-bilayer switching (see text), imaged during the rearrangement from monolayer to bilayer in water. The images correspond to a) 140 min, b) 180 min, c) 270 min and d) 380 min after immersion of the surface in water. | ||
For each sample, images were acquired in several different areas to verify that the monolayer-to-bilayer switching occurred at the same rate over the whole sample and is not a local effect induced by prolonged scanning of specific areas by the AFM probe. To illustrate the importance of this in Fig. 5, we show a low-force (<1 nN) FM-AFM image of a 5 μm × 5 μm area, recorded after first scanning the central 2 μm × 2 μm area with a slightly larger force (between ∼5–10 nN). Most of the monolayer in the central region has been converted to bilayer as a result of tip-monolayer interactions. This tip-induced monolayer-to-bilayer switching occurs at a much faster rate than the true rate as observed with non-invasive imaging: within 2–3 scan frames (∼10 min) the bilayer coverage grows from ∼2.5% to ∼30%. Due to lateral drag forces, similar fast switching behaviour was observed at much lower normal forces in contact-mode AFM.
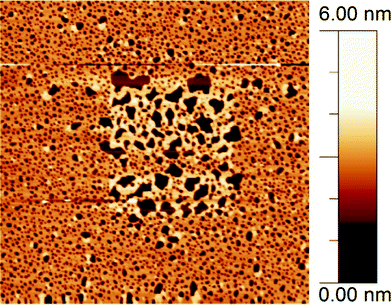 | ||
| Fig. 5 5 × 5 μm2 AFM image of DODAB film on mica, in pure water. The central 2 × 2 μm2 area was previously imaged at a higher force and shows a significantly higher proportion of bilayer coverage than the surrounding area as a result of tip-induced switching. | ||
As a next step, we explored the effect of the observed structural heterogeneity on the charge state of the surface and thus on the electrostatic interactions with the surface. We performed local (static/contact-mode) AFM force spectroscopy to measure the electrostatic interaction between the AFM tip and the different areas on the surface composed of bare mica, DODAB monolayer and DODAB bilayer. Since the silicon nitride tip is negatively charged in water,30 we expect any long-range force to be repulsive for negatively charged surfaces and attractive for positively charged surfaces. Fig. 6 shows force curves taken with the same tip and obtained on different areas of the same sample, avoiding zone boundaries between mica, monolayer, and bilayer. As expected for the negatively charged mica,30 a long-range repulsion was observed on bare mica areas, which were exposed as a result of the rearrangement of the DODAB monolayer (Fig. 6(a)). In a control experiment, we verified that freshly cleaved mica surfaces showed a similar long-range repulsion (data not shown). On the other hand, the long-range forces measured on DODAB monolayer and bilayer areas are attractive. In our data, the most striking result is the large similarity between the force curves on the DODAB monolayers and bilayers. (AFM images before and after the force spectroscopy demonstrated that the spectroscopy measurements had not locally converted monolayers into bilayers.)
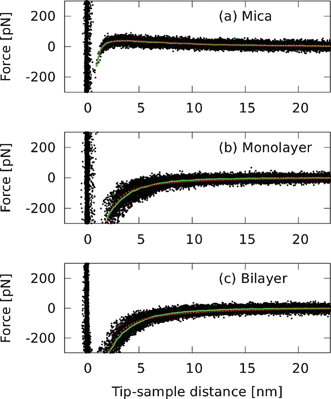 | ||
| Fig. 6 Contact-mode AFM force curves acquired on DODAB and mica surfaces using a silicon nitride tip, revealing (a) long-range repulsion on negatively charged mica surfaces and (b), (c) long-range attraction on DODAB monolayer and bilayer surfaces. The black dots are scatter plots of respectively (a) 27, (b) 29, and (c) 32 force curves, and the green line is the average taken over the part of the curves that was not affected by short-range (Pauli) repulsion and snap-in of the AFM tip to the sample. DLVO fits (see text) are indicated by red dots. | ||
The average force curves between the silicon-nitride tip and a mica surface (Fig. 6(a)) were fitted with a simple DLVO model of the form
 | (1) |
On mica the opposite signs for the attractive van der Waals and repulsive long-range electrostatic force allow for a clear distinction between these two forces, and the fitting of tip-mica interactions to such DLVO-type equations is relatively straightforward. This distinction is much less obvious on the DODAB films, however, where the long-range force is attractive as well (Fig. 6(b–c)). If we nonetheless attempt to fit the attractive tip-DODAB interaction using the same equation (the validity of which is discussed later), the results are as follows. The decay length, λ, was derived from fits to the force curves on mica, then kept fixed in the fits to the forces curves on the DODAB monolayer and bilayer, assuming that the same screening length applies on the mica and on the DODAB films. For the strengths we find F0 = 94 pN, −55 pN and −85 pN, for mica, DODAB monolayer and DODAB bilayer, respectively. HR/3 = 1.0 × 10⁻²⁷ N m2 for the monolayer and 1.2 × 10⁻²⁷ N m2 for the bilayer, i.e., 5–6 times larger than on mica. Typical errors for all values are ∼20%. Similar strengths for the screened electrostatic forces could be found when the van der Waals interaction was fitted with a short-range exponential, though the reproducibility of the fits was lower, indicating that the results could not be improved by more elaborate models than eqn (1). We also attempted to fit the attraction on monolayer and bilayer with a simple exponential (not shown), yielding decay lengths of ∼2.6 nm, in agreement with similar fits (not including van der Waals interaction) on DODAB bilayers by Rotsch et al.,30 and significantly shorter than the result on mica.
Discussion
Our results demonstrate a rearrangement of LB-deposited DODAB monolayers on mica in two distinct stages, with very different timescales, as observed by FM-AFM at low imaging forces. AFM images in Fig. 2 show the evolution of a DODAB film from a uniform monolayer in air, to ∼90% coverage monolayer within 10 min after immersion in water, and eventually to patches of bilayer after several days of immersion in water. Since the area of exposed mica increases after immersion in water, and concomitantly the area of DODAB decreases, we conclude that the (insoluble) DODAB rapidly forms a denser structure in water than in air. Longer exposure of the monolayer to water results in flipping of the molecules from a monolayer to a bilayer configuration (Fig. 3). The time scale at which this occurs, however, is many days, which is several orders of magnitude longer than was inferred from earlier AFM experiments.3,14 We have shown that tip-induced flipping (as shown in Fig. 5 for higher imaging forces) or contamination in the earlier experiments could be at the origin of this discrepancy. The monolayer-to-bilayer switching shows that the DODAB monolayer on mica is not in its equilibrium state and is kinetically trapped after LB deposition. The DODAB thus prefers to orient such that the hydrophobic chains minimize their exposure to water and the polar head groups maximize theirs. The molecular rearrangement within the DODAB monolayer and the molecular flipping to form bilayers under pure water give rise to surfaces with well-defined heterogeneity, which we find (meta)stable over the time-scale of, e.g., surface force balance experiments. The DODAB/mica surface in water therefore provides a highly appropriate model system to study fundamental forces between heterogeneously charged surfaces that exist in nature, such as protein surfaces and cell membranes.We now consider the interaction forces between the AFM tip and the mica, monolayer, and bilayer. Interactions between the AFM tip and mica surface are well accounted for by the DLVO expression (eqn (1)): the longer range force is attributed to electrostatic repulsion, and the short range attraction to van der Waals forces. The fitted screening length and Hamaker constant are consistent with previous studies.31,30 When DODAB is adsorbed to the mica, the pressure-versus-area isotherm can be used to deduce that in air the area per DODAB molecule is 60 ± 5 Å2. When fully ionized, i.e., depleted of its K+ ions, the mica surface contains one negative charge per 47.6 Å2. Given the full coverage of DODAB on mica in air, and the measured compaction of DODAB by 10% in pure water, the area per DODAB molecule in water will therefore be 54 ± 5 Å2, implying that the negative charge of the mica will be balanced by the positive head groups of the DODAB monolayer. In other words, the monolayer surface should have a significantly smaller charge density than the mica (and the DODAB bilayer). This is in agreement with our finding that long range electrostatic forces are barely distinguishable on the monolayer. The dominant interaction between tip and monolayer is a shorter range attractive interaction, as discussed below. Since the monolayer yields a nearly neutral surface, the bilayer should be positively charged. Indeed the data on the bilayer are consistent with the presence of a longer-range electrostatic attraction of similar magnitude as the repulsion on mica. But as for the monolayer, the major part of the force is a short-range attraction. With both the monolayer and bilayer, the tip experiences an attractive force about an order of magnitude larger, and shorter range than the repulsive force on mica. The short-range attraction is not satisfactorily accounted for by the van der Waals term in eqn (1) alone; an attempt to do so resulted in a Hamaker constant which is un-physically large (5–6 times larger than the value on mica). Instead, we suggest that the observed strong and short-range attraction between tip and DODAB arises from three contributing interactions: van der Waals interactions; short-range (‘real’) hydrophobic interactions arising from the water-DODAB interface energy;32 and electrostatic attraction not accounted for in the single exponential and arising from the opposite charge of the tip and surface.33 Although it is not possible to deconvolute these three effects without knowing the precise AFM tip size and geometry, our data suggest that these attractive forces dominate the tip-DODAB interaction over tip-sample distances up to 10 nm.
Conclusions
We have performed a systematic study of LB deposited monolayers of DODAB on mica surfaces in water, using FM-AFM. The monolayer, which shows a full coverage of the mica surface in air, rearranges within a few minutes after immersion in pure water, packing more closely and thus exposing patches of bare mica. The monolayers subsequently transformed into bilayers in the vicinity of exposed mica regions, at a time scale that is tens of hours for samples that were prepared under the cleanest conditions, independent of the deposition pressure over the range 5–25 mN m−1. These molecular rearrangements give rise to significant structural heterogeneity. With a negatively charged AFM tip, local force measurements show long-range repulsion (indicating negative surface charge) on the bare mica surface and attraction on monolayer and bilayer surfaces. Combined with estimates of the relative surface charge density, this suggests that the measured attractive forces on DODAB are not due to simple Debye screened electrostatics, but rather a combination of van der Waals, hydrophobic and electrostatic interactions.Acknowledgements
We gratefully acknowledge financial support from the US Office of Naval Research (N00014-10-1-0096), the UK Biotechnology and Biological Sciences Research Council (BB/G011729/1), the Leverhulme Trust (F-07 134-DK), and the Royal Society (RG080165).References
- D. Chandler, Interfaces and the driving force of hydrophobic assembly, Nature, 2005, 437(7059), 640–7 CrossRef CAS.
- M. U. Hammer et al., The search for the hydrophobic force law, Faraday Discuss., 2010, 146, 299–308 RSC.
- E. E. Meyer et al., Recent progress in understanding hydrophobic interactions, Proc. Natl. Acad. Sci. U. S. A., 2006, 103(43), 15739–46 CrossRef CAS.
- G. Hummer et al., Hydrophobic effects on a molecular scale, J. Phys. Chem. B, 1998, 102(51), 10469–82 CrossRef CAS.
- S. Perkin et al., Stability of self-assembled hydrophobic surfactant layers in water, J. Phys. Chem. B, 2005, 109(9), 3832–7 CrossRef CAS.
- S. Perkin et al., Long-range attraction between charge-mosaic surfaces across water, Phys. Rev. Lett., 2006, 96(3), 038301 CrossRef.
- J. H. Zhang et al., Effects of degassing and ionic strength on AFM force measurements in octadecyltrimethylammonium chloride solutions, Langmuir, 2005, 21(13), 5831–41 CrossRef CAS.
- G. Silbert et al., The effect of counterions on surfactant-hydrophobized surfaces, Faraday Discuss., 2010, 146, 309–24 RSC.
- H. K. Christenson et al., Cavitation and the interaction between macroscopic hydrophobic surfaces., Science, 1988, 239(4838), 390–2 CAS.
- J. Wood et al., Preparation of a robust hydrophobic monolayer on mica., Langmuir, 1994, 10(7), 2307–10 CrossRef CAS.
- A. L. Weisenhorn et al., Molecular-resolution images of Langmuir–Blodgett films and DNA by atomic force microscopy., Langmuir, 1991, 7(1), 8–12 CrossRef CAS.
- H. K. Christenson et al., Direct measurements of the force between hydrophobic surfaces in water, Adv. Colloid Interface Sci., 2001, 91(3), 391–436 CrossRef CAS.
- P. M. Claesson et al., Interactions between water-stable hydrophobic Langmuir–Blodgett monolayers on mica., J. Colloid Interface Sci., 1986, 114(1), 234–42 CrossRef CAS.
- E. E. Meyer et al., Origin of the long-range attraction between surfactant-coated surfaces, Proc. Natl. Acad. Sci. U. S. A., 2005, 102(19), 6839–42 CrossRef CAS.
- R. L. Cerro, Moving contact lines and Langmuir–Blodgett film deposition, J. Colloid Interface Sci., 2003, 257(2), 276–83 CrossRef CAS.
- Y. L. Lee, Surface characterization of octadecylamine films prepared by Langmuir–Blodgett and vacuum deposition methods by dynamic contact angle measurements, Langmuir, 1999, 15(5), 1796–801 CrossRef CAS.
- M. Benes et al., Muscovite (mica) allows the characterisation of supported Bilayers by ellipsometry and confocal fluorescence correlation spectroscopy, Biol. Chem., 2002, 383(2), 337–41 CrossRef CAS.
- J. Bolze et al., X-ray reflectivity and diffraction studies on lipid and lipopolymer Langmuir–Blodgett films under controlled humidity, J. Am. Chem. Soc., 2002, 124(32), 9412–21 Search PubMed.
- A. V. Hughes et al., Floating lipid bilayers deposited on chemically grafted phosphatidylcholine surfaces, Langmuir, 2008, 24(5), 1989–99 Search PubMed.
- Y. F. Dufrene et al., Advances in the characterization of supported lipid films with the atomic force microscope, Biochim. Biophys. Acta, Biomembr., 2000, 1509(1-2), 14–41 CrossRef CAS.
- J. A. Derose et al., Scanning tunneling and atomic-force microscopy studies of Langmuir–Blodgett films., Surf. Sci. Rep., 1995, 22(3), 73–126 CrossRef CAS.
- T. Fukuma et al., Direct Imaging of Lipid-Ion Network Formation under Physiological Conditions by Frequency Modulation Atomic Force Microscopy, Phys. Rev. Lett., 2007, 98(10), 106101 CrossRef.
- B. W. Hoogenboom et al., Quantitative dynamic-mode scanning force microscopy in liquid, Appl. Phys. Lett., 2006, 88(19), 193109 CrossRef.
- B. W. Hoogenboom et al., The supramolecular assemblies of voltage-dependent anion channels in the native membrane, J. Mol. Biol., 2007, 370(2), 246–55 Search PubMed.
- N. J. Hardy et al., Minimising monolayer collapse on Langmuir troughs, Colloids Surf., A, 2006, 284, 202–6 Search PubMed.
- B. W. Hoogenboom et al., Potential of interferometric cantilever detection and its application for SFM/AFM in liquids, Nanotechnology, 2008, 19(38), 384019 Search PubMed.
- B. W. Hoogenboom et al., A Fabry-Perot interferometer for micrometer-sized cantilevers, Appl. Phys. Lett., 2005, 86(7), 074101 Search PubMed.
- Z. Khan et al., Digitally tunable, wide-band amplitude, phase, and frequency detection for atomic-resolution scanning force microscopy, Rev. Sci. Instrum., 2010, 81(7), 073704 Search PubMed.
- J. E. Sader et al., Accurate formulas for interaction force and energy in frequency modulation force spectroscopy, Appl. Phys. Lett., 2004, 84(10), 1801–3 CrossRef CAS.
- C. Rotsch et al., Mapping local electrostatic forces with the atomic force microscope, Langmuir, 1997, 13(10), 2825–32 CrossRef CAS.
- H.-J. Butt et al., Force measurements with the atomic force microscope: Technique, interpretation and applications Surface, Surf. Sci. Rep., 2005, 59(1-6), 1–152 CrossRef CAS.
- H. Christenson et al., Direct measurements of the forces between hydrophobic surfaces in water Advances in Colloid and Interface, Science, 2001, 91, 391–436 Search PubMed.
- G. Silbert et al. , Long-ranged attraction between disordered heterogeneous surfaces, arXiv: 1109.4715v1 .
| This journal is © The Royal Society of Chemistry 2012 |
