Positron annihilation and N2 adsorption for nanopore determination in silica-polymer composites
Radosław
Zaleski
*a,
Agnieszka
Kierys
b,
Marek
Dziadosz
b,
Jacek
Goworek
b and
Istvan
Halasz
c
aM. Curie-Sklodowska University, Institute of Physics, Department of Nuclear Methods M. Curie-Sklodowska sq. 1, 20-031, Lublin, Poland. E-mail: radek@zaleski.umcs.pl; Fax: 48-815-376-191; Tel: 48-815-376-225
bM. Curie-Sklodowska University, Faculty of Chemistry, Department of Adsorption, M. Curie-Sklodowska sq. 3, 20-031, Lublin, Poland. Fax: 48-815-333-348; Tel: 48-815-375-607E-mail: jacek.goworek@umcs.lublin.pl; agnieszka.kierys@umcs.lublin.pl
cPQ Corporation, Research and Development Center, 280 Cedar Grove Road, Conshohocken, PA 19428, USA. E-mail: istvan.halasz@pqcorp.com; Fax: 1-610-825-142; Tel: 1-610-651-4696
First published on 31st January 2012
Abstract
Silica has two different, fragmented and smooth, visual appearances when deposited onto porous Amberlite polymer substrate from TEOS at acidic and basic pH, respectively. The low temperature N2 adsorption isotherms on both materials seem to be a combination of Type 1 and Type 4 isotherms with H2 hysteresis, indicating the presence of both micro (D < 2 nm diameter) and meso (2 nm < D < 50 nm) pores. Their mesopore distributions, computed by both BJH and DFT methods, show maxima near D∼5 nm with a narrower pore size distribution range than the organic support alone. For comparison, pores were also tested by positron annihilation lifetime spectroscopy (PALS) which can scan the full micro to mezo size range in one measurement without cooling and using any adsorbate molecules. These PALS results indicated the presence of D∼0.5, 0.8 and 1.5 nm diameter micropores and an average D∼5 nm diameter mesopores in both the base and the acid set materials. When the organic substrate is burned out from the two differently made composites, the new adsorption isotherms, BET surface areas, and differently measured pore sizes became distinctly different both from each other and from those of the parent materials.
1. Introduction
Nanoporous systems have many practical applications, most of which involve adsorption and diffusion of molecules.1–4 To control and optimize the related transport phenomena, one has to know the precise size and shape of the pores. This is poorly satisfied however for many silica-polymer nanocomposites, which form an interesting group of complex nanoporous materials with numerous applications.5–10 One reason for their unsatisfactory pore definition is that the routinely used nitrogen adsorption isotherms are often irreversible over these materials, which makes their interpretation unreliable. Moreover, these isotherms may exhibit H2 type hysteresis with continuously increasing adsorption and steep desorption steps, which hints at the presence of cavities or some sort of pore blocking.11–13A further, more general problem with the commonly used gas adsorption based pore characterization methods is that they rely on phase transitions in the narrow pores at temperatures near the boiling point of the adsorbates, most frequently N2, Ar, or CO2, because cooling to these very low temperatures can alter the fine molecular constitution of pore walls and the room temperature size of pores. The polar and quadrupolar character of CO2 and N2 might also cause Coulomb and/or chemical interference with atoms in the pore walls of polar materials, like many metal oxides, thereby deteriorating the system from pure physisorption. An additional problem is that the interpretation of adsorption isotherms assumes knowledge of the total adsorbed amount of gases as well as the formation sequence of an adsorbed multilayer preceding the total condensation of adsorbate molecules in the 2 nm < D < 50 nm diameter mesopores. One also has to assume in advance the type and shape of pores, e.g., straight cylindrical, slit like, micropore, and so on. The curvature of the meniscus is also guessed for the Kelvin equation based mesopore measurements, including the most popular Barrett, Joyner, Halenda14 or BJH method. Alternative interpretations of the adsorption data are based on molecular dynamics, Monte Carlo simulations, and Non-Local Density Functional Theory, NLDFT.15–19 Separate high precision sorption measurements in the 10−6 < p/p0 < 0.02 relative pressure range and adequate calculation algorithms are needed if the material contains D < 2 nm micropores.20,21
In the course of the past few years, an entirely different, efficient approach, positronium annihilation lifetime spectroscopy (PALS) has been developed and used successfully for characterizing a wide range of pores simultaneously without using any adsorbate molecules or cooling the probe .22–29 For positronium, when used as a probe molecule, the free volumes in solids look and physically indeed remain, empty. In principle the PALS probe can also be used at most practical temperatures, at which porous materials are employed. Hence their pore size data can be obtained at real conditions. To learn more about the accuracy of this method and its potential for accurate pore size measurements in silica-polymer nanocomposites, we used PALS to determine the pore sizes in mixed porous Amberlite/silica materials made by depositing silica gel onto the organic substrate at acidic and basic conditions. The same method was also used for porosity measurement on silica obtained from these nanocomposites after calcination, which are promising supports for bio-active substances in certain controlled drug release systems.30,31 In this paper we compare their PALS based porosity data with those measured by conventional low temperature N2 adsorption. It will be demonstrated that the differently made composites and pure silica gels possess distinctly different pore size distributions which can be adequately interpreted by the combined use of the adsorption and the PALS techniques.
2. Experimental section
2.1. Composite preparation
The preparation of organic/inorganic composite samples was started by thoroughly washing commercial, spherical Amberlite XAD7HP beads with distilled water as the manufacturer suggests (Rohm & Haas; today BASF). The washed beads were soaked thereafter into tetraethoxysilane (TEOS, Sigma-Aldrich, 98%), the amount of which was adjusted so that the beads just started to stick together but still preserved a loosely packed structure. This procedure caused the polymer beads to swell to more than 3 times of their dry volume. The TEOS saturated particles were transferred into aqueous ammonium hydroxide solution (200 cm3 25% NH4OH from Polish Chemical Reagents, POCH, was added to 17.5 g solid) and kept at room temperature for 24 h for gelation and ageing. Thereafter the solid spherical particles were filtered out, washed with 3 L water, and dried at 80 °C under vacuum for 12 h or longer. No aggregation among these particles was observed. This material, with silica gel made at basic conditions, was denoted as SiHP-B.In order to remove the organic substrate and prepare pure inorganic SiO2, the SiHP-B sample was calcined in air at 550 °C for at least 12 h. Thermogravimetric (TG) measurements demonstrated that fast polymer degradation starts at around 250 °C and at 600 °C this process is completed. The remaining incombustible porous silica residue, denoted as Si-B, equaled about 15% of the SiHP-B composite particles.
The above described procedure was also applied for precipitating silica from TEOS onto the Amberlite substrate at acidic conditions, for which we used pH = 0.44 HCl solution instead of NH4OH. The dry acid set composite in this case was denoted as SiHP-A and its incombustible SiO2 residue after calcination in air for at least 12 h was denoted as Si-A.
2.2. Pore size measurements
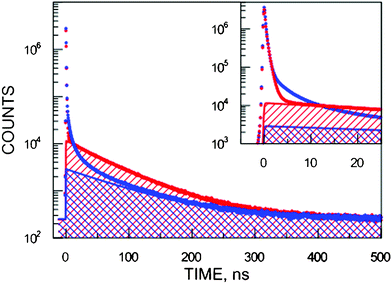 | ||
| Fig. 1 The experimental positron lifetime spectra of SiHP-A (blue lower curve) and Si-A (red upper curve). The territory of longest-lived components of SiHP-A are marked by forward slashes and those for Si-A by backward slashes. The inset magnifies the short-lived part of the spectra. | ||
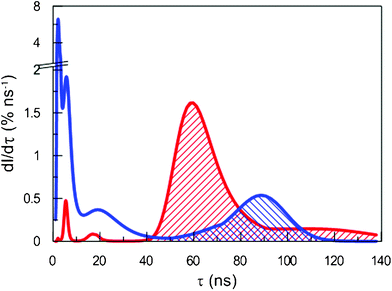 | ||
| Fig. 2 Intensity distribution of o-Ps lifetimes in SiHP-A (red; forward slash) and Si-A (blue; backward slash). | ||
To determine the specific pore sizes, one has to consider that two states of Ps exist: the singlet state with antiparallel spins (para-positronium, p-Ps) and the triplet state with parallel spins (ortho-positronium, o-Ps). The lifetime of p-Ps is about 125 ps, three orders of magnitude lower than the lifetime of o-Ps. The probability of pick-off is significantly smaller than the probability of p-Ps intrinsic annihilation. Therefore p-Ps lifetime is almost independent on its surrounding. On the other hand, the lifetime of o-Ps in matter is determined by the pick-off probability, which is related to the size of free volume that o-Ps is trapped in. Thus often several components attributed to o-Ps are observed in the positron spectra. Each corresponds to a fraction of o-Ps trapped in differently sized free volumes.
The relation between the lifetime and the free volume, i.e. pore diameter, was approximated with the extended Tao-Eldrup (ETE) model,35,36 using an EELViS computing routine.37 The ETE model takes into account the excited states of a particle in the well (i.e. Ps), contrary to commonly used Tao-Eldrup model, in which only the ground state is considered. As a result, the lifetimes for free volumes with diameters larger than 2 nm are shortened in the ETE model compared to the lifetimes computed from the Tao-Eldrup model. The ETE model is less commonly used than the Rectangular Tao-Eldrup (RTE) model developed a few years later,38 which uses easier calculations at the expense of assuming a less realistic cuboidal shaped free volume. The results of both the ETE and the RTE are similar to each other for pore sizes above 2–3 nm, but below this size differences can reach as high as 20%. In the present paper where both meso- and micropores are presented this might be even more significant since the micropores are not cuboidal. Therefore, we chose the more accurate ETE model.
Two assumptions were made: i) an empirical parameter, Δ, was selected to characterize the materials at hand (Δ = 0.166 nm for commonly used organic materials39); ii) the geometric shape of the pores was assumed to be cylindrical. Note that one can use the Δ = 0.166 nm empirical parameter both for the polymer and the silica, but this might cause a systematic shift in results. Although this error is only a few percent in the micropore range (D < 2 nm) it can reach as high as 30% at the higher end of the mesopore range (D∼50 nm). Therefore, it is better to use Δ≈0.15 for porous polymers40 and Δ≈0.19 for silica,41,42 when one knows which part of the free volume belongs to the polymer and which one to the silica.
The volume per size distribution, dV/dD, versus the D pore diameter can be derived43 from the equation:
 | (1) |
Results for samples SiHP-A and Si-A are illustrated in Fig. 3. The same computing algorithms were applied to determine the porosity for every material reported in this paper.
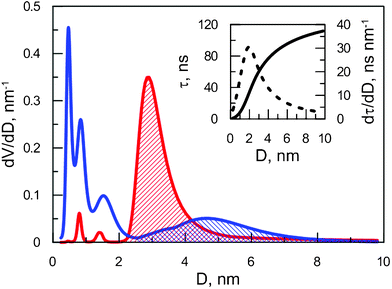 | ||
| Fig. 3 Normalized volume distribution over free volume in SiHP-A (red forward slash) and Si-A (blue backward slash). Inset: relation between the lifetime and free volume (solid line) and its derivative (dashed line) as obtained from the ETE model. | ||
In order to verify the reliability of MELT calculations and the repeatability of obtained results, we analyzed two subsequent XAD-7 measurements. Results (Fig. 4) confirm the reliability of this data analysis. The tendency of splitting a wide pore distribution into a series of narrower ones is a known phenomenon.44,45 It has to be taken into account during the interpretation of the results. All in all, this novel method to derive pore distribution from PALS data with only few and more realistic assumptions gives much more reliable results than any other method used thus far.
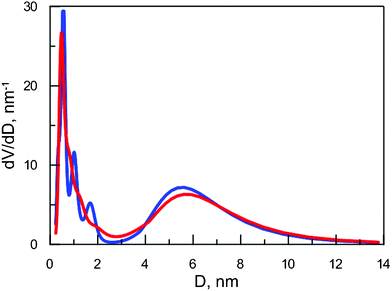 | ||
| Fig. 4 Normalized volume distribution over free volume in XAD-7 obtained from two subsequent measurements. | ||
2.3. SEM
SEM micrographs were taken using Quanta™ 3D FEG operating at 30.0 kV.2.4. 29Si NMR
Solid state 29Si Magic-Angle Spinning (MAS) NMR spectra were obtained at 59.6 MHz resonance frequency on a Bruker Avance-300 spectrometer at room temperature using 4 mm zirconia rotors with 8 kHz spinning speed. Typically 8000 scans resulted in satisfactory signal-to-noise ratio. Spectra were recorded by the CP pulse program. The chemical shifts are referenced to Q8M8 as standard material.3. Results and discussion
Amberlite polymer particles easily absorb TEOS and swell to about three times of their dry volume. The microscopic pictures in Fig. 5 illustrate that the physical appearances of gels deposited onto these particles from TEOS at acidic (SiHP-A) and basic (SiHP-B) conditions dramatically differ. The matching NMR spectra indicate that the smooth and fragmented gel structures are related to distinct molecular constitutions. This is a bit surprising, since gels are generally considered to have indistinguishably complex 3D siloxane ring structures hence their chemical constitutions have virtually never been considered as potential causes of differences in their physical properties. A recent research paper discusses these issues in details.46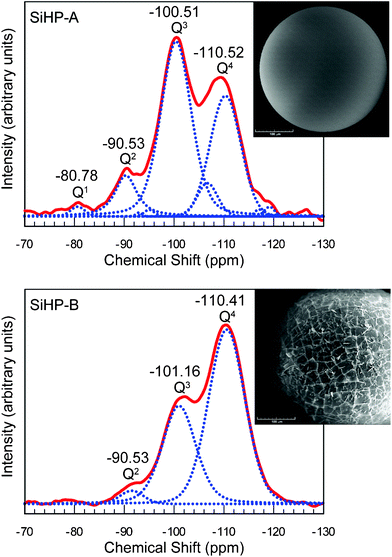 | ||
| Fig. 5 Acid (SiHP-A) and base (SiHP-B) set silica gel on Amberlite beads. The respective 29Si NMR spectra illustrate that different molecular constitutions cause the differences in physical appearance of silica gels. Spectra and pictures are from ref. 43 which also discusses the molecular structures of these and related silica gels in detail. | ||
Here we focus on another aspect of these acid and base set composites, namely that their different visual appearances and molecular constitutions are also associated with different pore size distributions. Fig. 6 shows the relevant nitrogen adsorption and desorption isotherms for the composite samples SiHP-A and SiHP-B as well as for the original Amberlite XAD7HP support (blue isotherms). One cannot help but notice that only slight differences exist between the shapes of these three isotherms especially for composite samples. In this case one can observe a linearly increasing adsorption and a sharply decreasing desorption branch. For the first sight they all can be classified as Type 4 with H2 hysteresis according to the IUPAC nomenclature.47 Such isotherms are frequent among inorganic oxide gels13 or polymers where openings of pores are smaller than pores located in particle interior.27 However, a more careful look at the initial, p/p0 < 0.02, part of these curves suggests that a significant portion of N2 has already adsorbed in this range, i.e., in the micropores. This is followed by a gradual building up of the first monolayer in the mesopores with a B turning point at around p/p0∼0.05–0.10. Thus, one can qualitatively deduct that these experimental curves are combined from Type 1 and Type 4 isotherms.
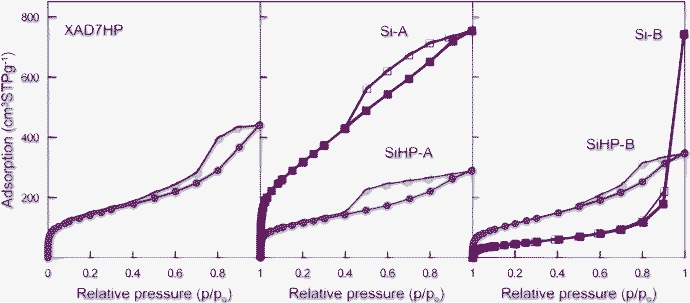 | ||
| Fig. 6 Low-temperature nitrogen adsorption (solid symbols) and desorption (open symbols) isotherms of investigated samples. The meaning of sample names is the same as in “Composite preparation” chapter. | ||
The resemblance of these three isotherms and hystereses suggests that the silica gels only slightly penetrated the mesopores of the organic substrate. Indeed, the numerical parameters in Table 1 show only slight changes in the total mesopore volume (Vp), average pore diameter (Dp), or BET surface area of the Amberlite after depositing the gels onto it under either acidic (SiHP-A) or basic conditions (SiHP-B).
| Sample name | S BET (m2 g−1) | V p (cm3 g−1) | D p (nm) |
|---|---|---|---|
| Amberlite® XAD7HP | 498 | 0.68 | 5.46 |
| SiHP-A | 393 | 0.45 | 4.58 |
| SiHP-B | 414 | 0.54 | 5.22 |
| Si-A | 1185 | 1.17 | 3.95 |
| Si-B | 169 | 1.15 | 27.22 |
However, when the organic matrix was eliminated by calcining the base set SiHP-B composite sample at 550 °C in air, its surface area dramatically dropped, presumably due to the collapse of the smaller pores as data for sample Si-B indicate. After burning out the Amberlite support at the same conditions from the acid set SiHP-A, its total pore volume and BET surface area substantially increased without measurable changes in the average mesopore diameter as data for Si-A demonstrate in Table 1. This is only possible when the microporosity increases in this material which could not be determined from these N2 adsorption data, but the roughly doubled N2 adsorption at p/p0 < 0.02 qualitatively supports this idea. In contrast, Fig. 6 also illustrates that the isotherm shape changes in the opposite way for the base set Si-B gel which acquired Type 3 or 5 characteristics in line with the macroporous nature of its fragmented structure (Fig. 3). Note that both pure silicas kept their spherical shape after calcination at 550 °C.
The mesopore size distributions (PSD) for every material investigated were computed both by BJH and NLDFT methods from the N2 adsorption data. Results on the left side of Fig. 7 indicate that the two methods give similar average pore sizes with a maximum near D∼5 nm. In the same figure PSDs calculated from PALS spectra are given on the right side. Clearly, pore volume in the mesopore part is similar compared to the narrower channels in every sample except Si-A. This sample has a relatively uniform pore distribution with D∼3 nm diameter which is very close to the meso/micro pore border hence the mesopore based BJH and DFT calculations lose accuracy. As previously predicted from the sorption isotherms (Fig. 6), every other sample contains comparable total volumes of micropores and mesopores although their average mesopore size is D∼5 nm which was also measured with PALS. The total volume of micropores similar to the total volume of mesopores is even valid for sample Si-B although a substantial part of pore volume in Si-B presumably comes from macropores (D > 50 nm), which generates the Type 3 and/or Type 5 isotherm character. Beside the hysteresis phenomenon associated with the Type 5 isotherm,47,48 its hysteresis might also hint at its minor mesopore content.
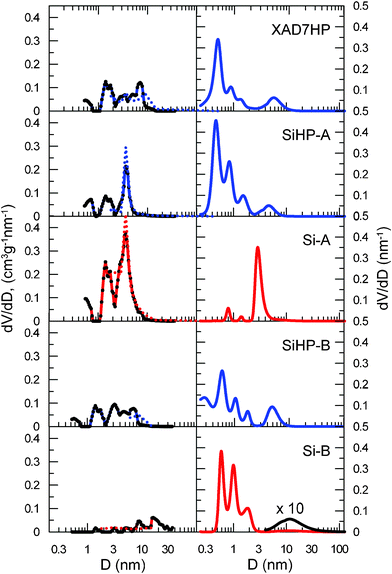 | ||
| Fig. 7 Pore size distributions derived from low-temperature nitrogen adsorption/desorption data (left side) using NLDFT (solid lines) and BJH (dotted line) calculations and measured by the PALS method (right side). Samples are named the same way as in “Composite preparation” chapter. | ||
The relative volume of D < 1.5 nm micropores in relation to mesopores found by PALS is definitely smaller for Si-A than for Si-B. This seemingly contradicts the high micropore ratio obtained from the N2 adsorption isotherms for Si-A in Fig 6. Although it is possible that Ps migrates from smaller free volumes to larger ones if they are interconnected49,50 that might result in underestimation of the volume of smaller free volumes in Si-A, it is more likely that the mentioned inaccurate pore saturation measurement in the large, D ~ 3 nm micropores causes this discrepancy. On the other hand the micropores in Si-B are probably closed, which makes them impenetrable for nitrogen, but let Ps in.
4. Summary
In summary, the variously measured data indicate that both the physical appearance and the pore size distribution are functions of the pH at which silica gels are synthesized combined with a porous organic substrate. The underlying difference in their molecular structures43,46 predetermines how the different post-treatments, like for example calcination in air, affect their final pore sizes, specific surface areas, and other physical properties.References
- A. M. Seayad and D. M. Antonelli, Adv. Mater., 2004, 16, 765–777 CrossRef CAS.
- A. Taguchi and F. Schüth, Microporous Mesoporous Mater., 2005, 77, 1–45 CrossRef CAS.
- I. I. Slowing, J. L. Vivero-Escoto, C. W. Wu and V. S. Y. Lin, Adv. Drug Delivery Rev., 2008, 60, 1278–1288 CrossRef CAS.
- P. L. Edmiston and L. A. Underwood, Sep. Purif. Technol., 2009, 66, 532–540 CrossRef CAS.
- K. Kageyama, J. Tamazawa and T. Aida, Science, 1999, 285, 2113–2115 CrossRef CAS.
- T. Vossmeyer, B. Guse, I. Besnard, R. E. Bauer, K. Müllen and A. Yasuda, Adv. Mater., 2002, 14, 238–242 CrossRef CAS.
- X. Ji, J. E. Hempsey, Q. Hu, J. He, Z. Yang and Y. Lu, Chem. Mater., 2003, 15, 3656–3662 CrossRef CAS.
- Y. Chen and H. Kim, Mater. Lett., 2007, 61, 5040–5043 CrossRef CAS.
- H. Zou, S. S. Wu and J. Shen, Chem. Rev., 2008, 108, 3893–3957 CrossRef CAS.
- A. K. Bajpai and D. D. Mishra, J. Appl. Polym. Sci., 2008, 107, 541–553 CrossRef CAS.
- A. Vishnyakov and A. V. Neimark, Langmuir, 2003, 19, 3240–3247 CrossRef CAS.
- B. Coasne, F. R. Hung, R. J.-M. Pallenq, F. R. Siperstein and K. E. Gubbins, Langmuir, 2006, 22, 194–202 CrossRef CAS.
- C. Reichenbach, G. Kalies, D. Enke and D. Klank, Langmuir, 2011, 27, 10699–10704 CrossRef CAS.
- E. P. Barrett, L. G. Joyner and P. P. Halenda, J. Am. Chem. Soc., 1951, 73, 373–380 CrossRef CAS.
- P. I. Ravikovitch and A. V. Neimark, J. Phys. Chem. B, 2001, 105, 6817–682 CrossRef CAS.
- A. V. Neimark and P. I. Ravikovitch, Micropor. Mesopor. Mater., 2001, 697, 44–45 Search PubMed.
- M. L. Occelli, J. P. Olivier, J. A. Perdigon-Melon and A. Auroux, Langmuir, 2002, 18, 9816–982 CrossRef CAS.
- A. V. Neimark, P. I. Ravikovitch and A. Vishnyakov, J. Phys.: Condens. Matter, 2003, 15, 347–365 CrossRef CAS.
- E. A. Ustinov and D. D. Do, J. Colloid Interface Sci., 2006, 297, 480–488 CrossRef CAS.
- F. Rouquerol, J. Rouquerol and K. Sing, Adsorption by Powders and Porous Solids, Acad. Press. San Diego, London, Boston, NY, Sydney, Tokyo, Toronto, 1999 Search PubMed.
- I. Halasz, M. Agarwal, B. Marcus and W. E. Cormier, Microporous Mesoporous Mater., 2005, 84, 318–331 CrossRef CAS.
- J. Wawryszczuk, J. Goworek, R. Zaleski and T. Goworek, Langmuir, 2003, 19, 2599–2605 CrossRef CAS.
- S. Thraenert, E. M. Hassan, D. Enke, D. Fuerst and R. Krause-Rehberg, Phys. Status Solidi C, 2007, 10, 3819–3822 CrossRef.
- M. Koshimizu, K. Shimokita, H. S. Zhou, I. Honma and K. Asai, J. Phys. Chem. C, 2008, 112, 8779–8783 CAS.
- S. Kunishige, M. Koshimizu and K. Asai, Radiat. Phys. Chem., 2009, 78, 1088–1091 CrossRef CAS.
- J. Kullmann, D. Enke, S. Thraenert, R. Krause-Rehberg and A. Inayat, Colloids Surf., A, 2010, 357, 17–20 CrossRef CAS.
- R. Zaleski, A. Kierys, M. Grochowicz, M. Dziadosz and J. Goworek, J. Colloid Interface Sci., 2011, 358, 268–76 CrossRef CAS.
- S. Thraenert, D. Enke, G. Dlubek and R. Krause-Rehberg, in Characterisation of Porous Solids VIII, ed. S. Kaskel, P. Llewellyn, F. Rodriguez-Reinoso and N. A. Seaton, RSC Publishing, Cambridge, 2009, pp. 94–102 Search PubMed.
- M. R. Hill, S. J. Pas, S. T. Mudie, D. F. Kennedy and A. J. Hill, J. Mater. Chem., 2009, 19, 2215–2225 RSC.
- J. M. Xue, C. H. Tan and D. Lukito, J. Biomed. Mater. Res., Part B, 2006, 78B, 417–422 CrossRef CAS.
- V. K. Rana, S. S. Park, S. Parambadath, M. J. Kim, S.-H. Kim, S. Mishra, R. P. Singh and C.-S. Ha, Med. Chem. Commun., 2011, 2, 1162 RSC.
- S. Brunauer, P. H. Emmett and E. Teller, J. Am. Chem. Soc., 1938, 60, 309–319 CrossRef CAS.
- P. Hautojarvi, A. Dupasquier (editors.) Positrons in solids, Springer-Verlag, Berlin, 1979, pp.5 Search PubMed.
- A. Shukla, M. Peter and L. Hoffmann, Nucl. Instrum. Methods Phys. Res., Sect. A, 1993, 335, 310–317 CrossRef CAS.
- T. Goworek, K. Ciesielski, B. Jasińska and J. Wawryszczuk, Chem. Phys. Lett., 1997, 272, 91–95 CrossRef CAS.
- T. Goworek, K. Ciesielski, B. Jasińska and J. Wawryszczuk, Chem. Phys., 1998, 230, 305–315 CrossRef CAS.
- R. Zaleski, EELViS, 2009, <http://eelvis.sourceforge.net> (accessed 24.02.2010).
- D. W. Gidley, W. E. Frieze, T. L. Dull, J. Sun, A. F. Yee, C. V. Nguyen and D. Y. Yoon, Appl. Phys. Lett., 2000, 76, 1282–1284 CrossRef CAS.
- H. Nakanishi, S. J. Wang and Y. C. Jean, in Positron Annihilation Studies of Fluids, ed. S. C. Sharma, World Scientific, Singapore, 1988, pp.292 Search PubMed.
- R. Zaleski, J. Goworek and M. Maciejewska, Phys. Status Solidi C, 2009, 6, 2445–2447 CrossRef CAS.
- R. Zaleski, J. Wawryszczuk and T. Goworek, Radiat. Phys. Chem., 2007, 76, 243–247 CrossRef CAS.
- S. Thränert, D. Enke, G. Dlubek and R. Krause-Rehberg, Mater. Sci. Forum, 2009, 607, 169–172 CrossRef.
- R. Zaleski, W. Stefaniak, M. Maciejewska and J. Goworek, J. Colloid Interface Sci., 2010, 343, 134–140 CrossRef CAS.
- G. Dlubek, S. Eichler, C. Hübner and C. Nagel, Phys. Status Solidi A, 1999, 174, 313–325 CrossRef CAS.
- G. Dlubek, C. Hübner and S. Eichler, Nucl. Instrum. Methods Phys. Res., Sect. B, 1998, 142, 191–202 CrossRef CAS.
- I. Halasz, A. Kierys, J. Goworek, H. Liu and R. E. Patterson, J. Phys. Chem., 2011, 115, 24788–24799 CAS.
- K. S. W. Sing, D. H. Everett, R. A. W. L. Mouscou, R. A. Pierotti, J. Rouquerol and T. Siemieniewska, Pure Appl. Chem., 1985, 57, 603–619 CrossRef CAS.
- F. Rouquerol, J. Rouquerol and K. Sing, Adsorption by Powders and Porous Solids, Acad. Press. San Diego, London, Boston, NY, Sydney, Tokyo, Toronto, 1999 Search PubMed.
- R. Zaleski and J. Wawryszczuk, Acta Physica Polonica., 2008, 113, 1543–1550 CAS.
- R. Zaleski, J. Wawryszczuk and T. Goworek, Radiat. Phys. Chem., 2007, 76, 243–247 CrossRef CAS.
| This journal is © The Royal Society of Chemistry 2012 |
