Novel magnetic-separable and efficient Au/Fe–Al–O composite for the lactonization of 1,4-butanediol to γ-butyrolactone
Jiamin
Zheng
,
Jie
Huang
,
Xian
Li
,
Wei-Lin
Dai
* and
Kangnian
Fan
Department of Chemistry and Shanghai Key Laboratory of Molecular Catalysis and Innovative Materials, Fudan University, Shanghai 200433, P. R. China. E-mail: wldai@fudan.edu.cn; Fax: (+86-21) 55665701; Tel: 86-21-55664678
First published on 6th February 2012
Abstract
Nano-sized gold catalysts have attracted much interest during recent years. Here, we report a new material to improve the catalytic activity and recyclability of gold catalysts. Multi-component Fe–Al–O oxides prepared by impregnation (γ-Fe2O3/γ-Al2O3 and Al2O3/α-Fe2O3) and encapsulation (Fe2O3@Al2O3) methods were employed as carriers for gold catalysts. The Au/Fe–Al–O composites exhibited efficient catalytic activity and selectivity for the lactonization of 1,4-butanediol to γ-butyrolactone. They could also be easily recovered due to their super-paramagnetic property. XRD, TEM, XPS and H2-TPR were used to characterize the composites. The influence of surface Fe/Al ratio on Au/(Fe2O3@Al2O3) composites was also studied by adjusting the Fe/Al molar ratio for comparison and the optimal Fe/Al ratio was found to be 1![[thin space (1/6-em)]](https://www.rsc.org/images/entities/char_2009.gif) :
:![[thin space (1/6-em)]](https://www.rsc.org/images/entities/char_2009.gif) 4. The results confirmed that higher conversion and selectivity were obtained due to the bifunctional effect of Fe2O3 and Al2O3.
4. The results confirmed that higher conversion and selectivity were obtained due to the bifunctional effect of Fe2O3 and Al2O3.
1. Introduction
Gold catalysts have been proven to be highly active in many reactions.1–4 As previously reported, gold nanoparticles also exhibit excellent catalytic activity in the aerobic oxidations of alcohols,5,6 like other supported metal catalysts.7–10 Herein, the aerobic oxidation of 1,4-butanediol to γ-butyrolactone was studied not only because γ-butyrolactone is an important chemical that can be applied as a solvent, extraction agent or intermediate for the synthesis of many compounds,11–13 but also because both its conversion and selectivity are related to the support effect and gold particle size effect according to our previous results.14–17Among many factors that affect the catalytic activity of gold catalysts,18–23 it is of great significance to work on the supports because supports working in varied modes in gold catalysis can bring about great differences in gold particle size, geometry and oxidation state.18,24 To improve the pore properties, acidic–basic properties and surface properties of mono-component supports, multi-component supports with two or more components are introduced.25 It has been reported that the addition of a second element can provide reactive oxygen species for reactions, or stabilize the active gold species, increasing the catalytic activity26 and stability27–29 in many reactions, such as CO oxidation, oxidation of saturated hydrocarbons,30–32 ammonia oxidation,33 selective reduction of NOx,34 partial oxidation of methanol,28 WGS reaction35 and aerobic alcohol oxidation.36 This kind of support material is widely used in gold catalysts, such as binary or ternary metal oxides37–39 as Ce1-xZrxO2 solid solution40,41 and Al2O3,42 Fe2O3,35 TiO228,43,44 or CeO245 modified with a main-group or transition metal oxide. G. J. Hutchings et al. recently reported that supported gold–palladium nanoparticles on carbon or TiO2 are active for the oxidation of the primary carbon–hydrogen bonds in toluene and related molecules, as well as other bimetallic gold catalysts.46,47 The influence of the gold nanoparticle size, nature of the support and influence of catalyst preparation procedure for the aerobic oxidation of alcohols were addressed to establish a detailed reaction mechanism that can help to design more active gold catalysts.48 Recently, a study on the mechanism of ethanol and glycerol oxidation to acids over supported gold catalysts was reported by R. J. Davis et al.49 M. Baumer et al. also reported an interesting preparation of nanoporous Au for selective gas-phase oxidative coupling of methanol.50 More recent developments in the selective oxidation of organic compounds by gold catalysis have occurred during the last three years.51,52
Although there are some reports about the gold-catalyzed oxidation of 1,4-butanediol to γ-butyrolactone, used both as the homogeneous one5 or the heterogeneous one,6 the multi-component support was not studied in detail. Herein, we used an environmental system for the oxidation of diols using air as the oxidizing agent. Lactones are a group of chemicals that can be applied as a solvent, extraction agent and intermediate of many biomedical products, fibers and pesticides, with wide application in agriculture, petroleum industry, pharmaceutics, resins and fibers. They can be synthesized by dehydrogenation or oxidation of the corresponding α,ω-diols and cycloketones. Current synthesis procedures involve fierce reaction conditions and oxidants, or the sacrifice of a series of cooxidants such as aldehydes, N-oxide, and so forth. Abundant wastes are also generated. Obviously, the process is not in accordance with the requirements of green chemistry and sustainable development.
In our previous studies, it was found that Au/Al2O3 shows high catalytic activity in the aerobic oxidation of 1,4-butanediol to γ-butyrolactone.17 Al2O3 is a common support for metal or metal oxide catalysts due to its stability, texture properties and unique acidic–basic properties.53 The use of Al2O3 in the modification of TiO2 has also been reported.54,55 Yet, we also found that the selectivity of Au/Al2O3 increased in the initial stage and then dropped as the reaction went on. Also, none of the Au/Al2O3 catalysts gave a lactone yield higher than 90%. In the literature, a second component was added onto the surface of Al2O3 to prepare gold catalysts on multi-component supports containing Al2O3.
Aside from the enhancement of the activity of Au/Al2O3, our efforts have been focused on the development of a supported gold catalyst that can offer high efficiency combined with better recovery properties. A suitable solution to this problem is the utilization of the magnetic separation that enables the recovery of fine gold nanoparticles with higher catalytic activity.56 For our Au/Fe–Al–O composites, separation of the substrate and recycling of the materials would be more convenient if ferromagnetic oxide is used as the support, since it can be simply collected by a permanent magnet due to its magnetic properties. Besides, iron oxide is a potential support material due to its reducibility, stability and the ability for electron transfer and Au/Fe2O3 showed high selectivity in our previous work.14,15 Furthermore, considering its industrial application, the magnetic properties of our Au/Fe–Al–O composites can better solve the troubles of mass transfer in the three-phase system via the introduction of an alternating electromagnetic field. With an externally applied magnetic field, the catalysts can be well-dispersed and stabilized in the reaction system resistant to gravity so that they can make good contacts with the reagent even in a large scale system. Therefore, the advantages of the two metal composites were combined to develop a new material for a gold catalyst with high activity and selectivity for the oxidation of diols.
We addressed the different preparation methods to obtain fine materials. In the present work, Fe–Al–O supports with different morphologies and properties were synthesized. Impregnation and encapsulation methods were employed to prepare composites for gold catalysts. The properties of Au catalysts supported on different Fe–Al–O composites and their catalytic behaviors were explored and the influence of surface Fe/Al ratio on Fe2O3@Al2O3 catalysts was also investigated by adjusting the Fe/Al molar ratio.
2. Experimental section
2.1. Preparation of multi-component Fe–Al–O composites
The Fe–Al–O supports were prepared as described elsewhere.57,58 The modified impregnation procedure is as follows: Al(NO3)3 and Fe(NO3)3 were respectively impregnated on the Fe2O3 or Al2O3 using ammonia aqueous solution as the precipitation agent, followed by calcination in air at 773 K. Samples impregnated from Fe(NO3)3 on Al2O3 are denoted as γ-Fe2O3/γ-Al2O3 and samples impregnated from Al(NO3)3 on Fe2O3 are denoted as Al2O3/α-Fe2O3.The encapsulation procedure is as follows: ammonia aqueous solution was added into FeSO4 aqueous solution. After the mixture was stirred at room temperature for 15 min, Al(NO3)3 was added dropwise and then Al(OH)3 was precipitated on Fe(OH)3. The as-prepared precipitates were collected by filtration, washed three times with deionized water and dried overnight at 373 K, followed by calcination in air. The as-obtained materials are denoted as mFe2O3@nAl2O3.
The formation process of the Au/Fe–Al–O composites is depicted in Scheme 1.
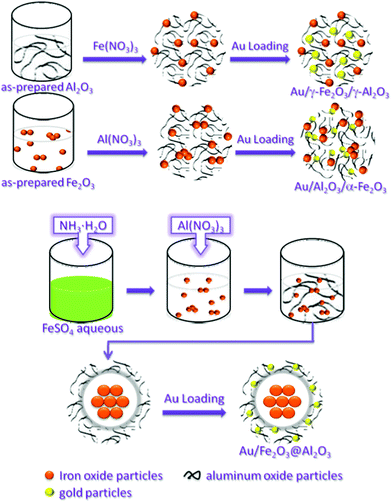 | ||
| Scheme 1 A schematic illustration showing the possible formation mechanism of Au/Fe–Al–O composites. | ||
2.2. Preparation of Au/Fe–Al–O composites
Deposition of gold onto the multi-component Fe–Al–O oxide support was carried out by the deposition–precipitation method (DP) using urea as the precipitation agent.59,60 10 mL of HAuCl4 aqueous solution (2.43 × 10⁻³ mol L−1) was added into 50 mL of deionized water, followed by the addition of 2.92 g of urea. 0.6 g of Fe–Al–O oxides support was then added into the solution. The mixture was stirred for 2 h at 353 K. The as-prepared precipitates were collected by filtration, washed three times with deionized water and dried in air overnight at 373 K, followed by calcination in air in a muffle oven for 4 h at 573 K. The catalyst supported on the Fe–Al–O oxide support is denoted as Au/Fe–Al–O.2.3. Characterization
The specific surface area of the samples was measured by nitrogen adsorption at 77 K (Micromeritics Tristar ASAP 3000) using the Brunauer–Emmett–Teller (BET) method. The gold loadings were determined by the inductively coupled plasma method (ICP, thermo E.IRIS). X-ray diffraction (XRD) patterns were recorded on a Bruker D8 Advance spectrometer with Cu-Kα radiation (λ = 0.154 nm), operated at 40 mA and 40 kV. Transmission electronic microscopy (TEM) measurement was performed on a JEOL JEM 2010 transmission electron microscope. The average size of the Au particles and their distributions were estimated by counting more than 300 Au particles. X-ray photoelectron spectra (XPS) were recorded under an ultra-high vacuum (<10−6 Pa) at a pass energy of 93.90 eV on a Perkin Elmer PHI 5000C ESCA system using Mg-Kα (1253.6 eV) anode. All binding energies were calibrated by using contaminant carbon (C1s = 284.6 eV). Temperature programmed reduction with hydrogen (H2-TPR) of the samples was carried out in a full automatic XQ TP-5080 instrument (Tianjin Xianquan Co. Ltd.). About 50 mg of catalyst was packed into a reactor with quartz tubing and pretreated with high purity argon flow at 313 K for 2 h. Reduction was carried out under a mixture of hydrogen and argon (5% H2) at a flow rate of 20 mL min−1. The temperature was linearly raised at a ramping rate of 10 K min−1 up to 973 K.2.4. Activity measurements
The activity tests were carried out at 413 K in a stainless steel autoclave equipped with a magnetic stirrer. In a typical run of the reaction, 1.4 g of 1,4-butanediol was dissolved in 20 mL of tributyl phosphate (TBP), followed by addition of 0.190 g of Au/Fe–Al–O composite. Then, the autoclave was sealed and filled with 1.25 MPa air. The reaction was initiated by vigorous stirring. The rate of magnetic stirring was set at 800 rpm. The reaction mixture was sampled at regular time intervals and analyzed by gas chromatography (GC9560 (HuaAi Co. Ltd.) with a FID detector and HP5 capillary column) to determine the conversion and selectivity. Gas chromatography-mass spectrometry (GC 8000 TOF-MS voyager) and nuclear magnetic resonance (NMR, DMX 500) were utilized to determine the products. Scheme 2 shows the reaction equation. | ||
| Scheme 2 The reaction pathway of the lactonization of 1,4-butanediol to γ-butyrolactone. | ||
3. Results and discussion
3.1. Characterization of the Fe–Al–O supports
The physico-chemical properties of the as-prepared Fe–Al–O support precursors are listed in Table 1. It was found that the BET specific surface area of the Fe2O3@Al2O3 support is higher than that of the other two supports prepared by the impregnation method, which are 153 and 163 m2 g−1 for γ-Fe2O3/γ-Al2O3 and Al2O3/α-Fe2O3, respectively. Iron oxide supports, including α-Fe2O3 and γ-Fe2O3 are in pure crystal phases, as evidenced by the XRD patterns of Fe–Al–O (Fig. 1). For Al2O3/α-Fe2O3, the XRD pattern shows structures assignable to hematite (α-Fe2O3). It can be inferred that the iron oxide is in the form of α-Fe2O3 after calcination at 773 K before impregnation and doesn't change after the impregnation. No crystalline structure of Al2O3 is observed, indicating that Al2O3 is mainly in the amorphous form. For γ-Fe2O3/γ-Al2O3 and Fe2O3@Al2O3, Fe2O3 is found to keep the crystal phase of γ-Fe2O3 even after calcination and weaker peaks of γ-Al2O3 (2θ = 45.3°, 66.8°) are found in the XRD patterns. The average particle size calculated from XRD patterns by Scherrer equation is also listed in Table 1. They are 20, 16 and 11 nm for Al2O3/α-Fe2O3, γ-Fe2O3/γ-Al2O3 and Fe2O3@Al2O3, respectively. The specific surface area of Fe2O3@Al2O3 is the highest (213 m2 g−1) due to it having the smallest particle size, which may provide a better surface for gold particles to disperse in the next steps.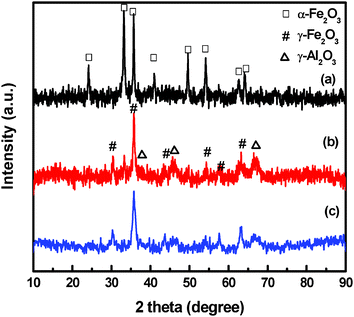 | ||
| Fig. 1 XRD patterns of Fe–Al–O: (a) amorphous Al2O3/α-Fe2O3, (b) γ-Fe2O3/γ-Al2O3 and (c) Fe2O3@Al2O3. | ||
3.2. Characterization of Au/Fe–Al–O composites
Gold was deposited on Fe–Al–O supports by a homogeneous DP method. The physico-chemical properties of Au/Fe–Al–O composites are listed in Table 2. The support kept the same crystal phase and particle size after the deposition of gold, as observed from the XRD results (Fig. 2). XRD patterns display diffraction peaks indexed to α-Fe2O3 in Au/Al2O3/α-Fe2O3, while both γ-Fe2O3 and γ-Al2O3 in Au/γ-Fe2O3/γ-Al2O3 and Fe2O3@Al2O3, which coincides well with the H2-TPR results. As presented in the H2-TPR curves shown in Fig. 3, for Al2O3/α-Fe2O3 and γ-Fe2O3/γ-Al2O3, reduction peaks at 767 and 665 K for α-Fe2O3 and γ-Fe2O3 are due to the reduction of Fe(III) to Fe3O4. For Au/Fe2O3@Al2O3, the two reduction peaks show that Fe2O3 is in two morphologies, the bulk Fe2O3 and the surface Fe2O3 interacting with Al2O3.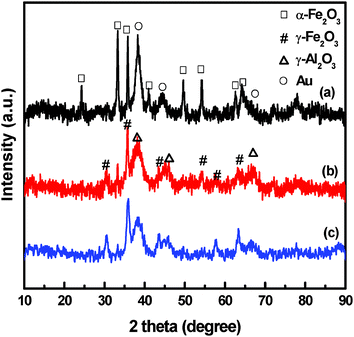 | ||
| Fig. 2 XRD patterns of Au/Fe–Al–O composites: (a) Au/Al2O3/α-Fe2O3, (b) Au/γ-Fe2O3/γ-Al2O3 and (c) Au/Fe2O3@Al2O3. | ||
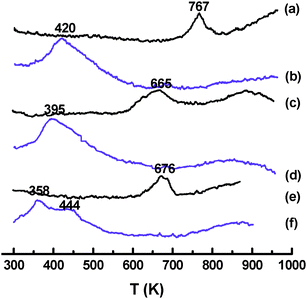 | ||
| Fig. 3 H2-TPR profiles of Au/Fe–Al–O composites: (a) Al2O3/α-Fe2O3, (b) Au/Al2O3/α-Fe2O3, (c) γ-Fe2O3/γ-Al2O3, (d) Au/γ-Fe2O3/γ-Al2O3, (e) Fe2O3@Al2O3 and (f) Au/ Fe2O3@Al2O3. | ||
As shown in Fig. 2, the diffraction line at 2θ = 38.2 (Au(111)) indicates the formation of small metallic gold particles in the catalysts. Though gold diffraction peaks overlap with that of γ-Al2O3, the peaks of γ-Al2O3 are very weak and gold particle size can be judged from the XRD patterns. It shows that the particle size follows the order: Au/Al2O3/α-Fe2O3 > Au/γ-Fe2O3/γ-Al2O3 > Au/Fe2O3@Al2O3. More accurate and direct information on morphologies are provided by TEM images. Gold particle size and distributions differ among Au/Fe–Al–O composites, as shown in Fig. 4. For Au/Al2O3/α-Fe2O3 and Au/γ-Fe2O3/γ-Al2O3, the supports show a nanofiber morphology with Al2O3 and a nanoparticle morphology with Fe2O3, with an average diameter of 50 nm. For Fe2O3@Al2O3, Fe2O3 was encapsulated by Al2O3 and there were no isolated Fe2O3 particles observed, indicating that an interaction was formed between Al2O3 and Fe2O3. For Au/Al2O3/α-Fe2O3, gold particles are mainly dispersed on the Fe2O3 carrier, while those on the Al2O3 are larger in size with a range of particle size of 2–14 nm and average particle size of 6.6 nm. For Au/γ-Fe2O3/γ-Al2O3, gold particles are dispersed evenly on Al2O3 and Fe2O3 with much smaller average particle size of 4.6 nm. For Au/Fe2O3@Al2O3, gold particles are highly dispersed with the smallest average particle size of 3.5 nm.
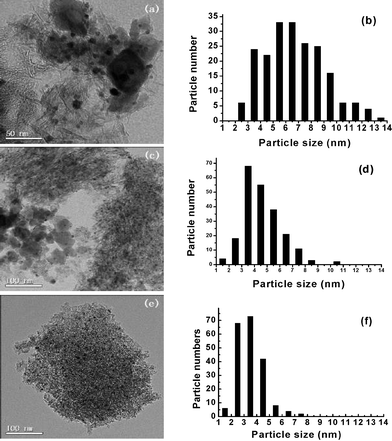 | ||
| Fig. 4 TEM images and Au particle size distributions of Au/Al2O3/α-Fe2O3 (a and b), Au/γ-Fe2O3/γ-Al2O3 (c and d) and Au/Fe2O3@Al2O3 (e and f). | ||
Electronic properties of the Au/Fe–Al–O catalysts were characterized by XPS, as listed in Table 3. For Au/γ-Fe2O3/γ-Al2O3 and Au/Fe2O3@Al2O3, it can be found that the gold is in the metallic form (Au(0)), with only a single Au 4f7/2 peak at a binding energy lower than 84.0 eV. But for Au/Al2O3/α-Fe2O3, more than half of the surface gold is in the oxidized state due to the stabilization of Auδ+ by α-Fe2O3. The surface atomic ratio of Al, Fe and Au can also be obtained from the XPS results. Compared with the bulk atomic ratio of Fe and Al measured by ICP, for Au/Al2O3/α-Fe2O3 and Au/Fe2O3@Al2O3, the surface content of Al is higher than the bulk one, while that of Au/γ-Fe2O3/γ-Al2O3 is the lowest. For Au/Al2O3/α-Fe2O3, a higher surface content of Al is obtained since Al2O3 is impregnated on Fe2O3. For Au/Fe2O3@Al2O3, the surface content of Al is higher than that of Au/Al2O3/α-Fe2O3 as well as its bulk content, indicating that Fe2O3 is better encapsulated than in Au/Al2O3/α-Fe2O3. It is assumed that the rich hydroxyl groups on the surface of Al2O3 survived after the encapsulation method of Au/Fe2O3@Al2O3, which is beneficial to the generation of smaller gold particles according to our previous studies.17
| Sample | Au%surf | Au loading (%)b | Fe:Alsurfa | Fe:Albulkb | Au 4f7/2 (eV) | Fe 2p3/2 (eV) | Al 2p3/2 (eV) |
|---|---|---|---|---|---|---|---|
| a Calculated from the XPS results. b Obtained from the ICP results. | |||||||
| Au/Al2O3/α-Fe2O3 | 1.8 | 6.2 | 1![[thin space (1/6-em)]](https://www.rsc.org/images/entities/char_2009.gif) : :![[thin space (1/6-em)]](https://www.rsc.org/images/entities/char_2009.gif) 10 10 |
1![[thin space (1/6-em)]](https://www.rsc.org/images/entities/char_2009.gif) : :![[thin space (1/6-em)]](https://www.rsc.org/images/entities/char_2009.gif) 4.1 4.1 |
83.3 (47%); 84.5 (53%) | 711.9 | 74.8 |
| Au/γ-Fe2O3/γ-Al2O3 | 5.5 | 5.9 | 1![[thin space (1/6-em)]](https://www.rsc.org/images/entities/char_2009.gif) : :![[thin space (1/6-em)]](https://www.rsc.org/images/entities/char_2009.gif) 3 3 |
1![[thin space (1/6-em)]](https://www.rsc.org/images/entities/char_2009.gif) : :![[thin space (1/6-em)]](https://www.rsc.org/images/entities/char_2009.gif) 2.2 2.2 |
83.3 | 710.9 | 74.0 |
| Au/Fe2O3@Al2O3 | 4.1 | 6.0 | 1![[thin space (1/6-em)]](https://www.rsc.org/images/entities/char_2009.gif) : :![[thin space (1/6-em)]](https://www.rsc.org/images/entities/char_2009.gif) 18 18 |
1![[thin space (1/6-em)]](https://www.rsc.org/images/entities/char_2009.gif) : :![[thin space (1/6-em)]](https://www.rsc.org/images/entities/char_2009.gif) 3.4 3.4 |
83.8 | 712.0 | 74.7 |
3.3. Catalytic activity of Au/Fe–Al–O composites
The catalytic activity of the Au/Fe–Al–O composites and the simple mixture of Fe2O3 and Al2O3 in the selective aerobic oxidation of 1,4-butanediol to γ-butyrolactone are shown in Fig. 5 and Table 4. Au/Fe2O3@Al2O3 composite shows the highest activity. Two hour conversion of Au/Fe2O3@Al2O3 reaches 90% and its 4 h conversion is 99% with a selectivity of 87%. For Au/γ-Fe2O3/γ-Al2O3, 1,4-butanediol can be totally consumed in 8 h. Its catalytic activity is lower than Au/Al2O3+Au/Fe2O3 at the initial stage, but is much higher after 8 h reaction. The catalytic activity follows the order: Au/Fe2O3@Al2O3 > Au/γ-Fe2O3/γ-Al2O3 ≈ Au/Al2O3+Au/Fe2O3 > Au/Al2O3/α-Fe2O3. The selectivity of the Au/Fe–Al–O composites increases with the prolonging of the reaction time and keeps increasing after 8 h with no decline (Fig. 5(B)). Among them, Au/Fe2O3@Al2O3 catalyst shows the highest selectivity and reaches 99% at 8 h. The selectivity of Au/Al2O3/α-Fe2O3 and Au/Fe2O3+Au/Al2O3 increases slowly after 4 h reaction. The better catalytic performance of Au/Fe2O3@Al2O3 confirms that it is affected by the support properties and the Al2O3 and Fe2O3 are not a simple mixture, but interaction exists between them after the encapsulation process.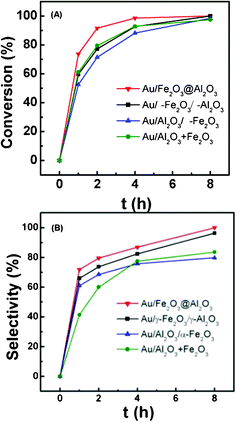 | ||
| Fig. 5 Conversion (A) and selectivity (B) of oxidative dehydrogenation of 1,4-butanediol catalyzed by Au/Fe–Al–O catalysts. Reaction conditions: 0.190 g catalyst, 1.4 g 1,4-butanediol, 20 mL TBP, 1.25 MPa air, 413 K. | ||
| Sample | Conversion (%) | Selectivity (%) | Yield (%) |
|---|---|---|---|
| a Reaction conditions: 0.190 g catalyst, 1.4 g 1,4-butanediol, 20 mL TBP, 1.25 MPa air, 413 K, 4 h. | |||
| Au/Al2O3/α-Fe2O3 | 88 | 76 | 67 |
| Au/γ-Fe2O3/γ-Al2O3 | 93 | 88 | 82 |
| Au Fe2O3@Al2O3 | 99 | 87 | 86 |
| Au/Fe2O3+Au/Al2O3 | 93 | 84 | 78 |
3.4. The influence of Fe/Al ratio on Au/Fe2O3@Al2O3 composites
To gain an insight into the support effect and the interaction between Al2O3 and Fe2O3 in the Au/Fe2O3@Al2O3 composites, additional experiments were performed, probing the influence of Fe/Al ratio on the catalysts. The physico-chemical properties of Fe2O3@Al2O3 with different Fe/Al ratios are listed in Table 5. It was found that the specific surface area of Fe2O3@Al2O3 increases with a rise in Al content, from 131 to 236 m2 g−1. Except for Au/1Fe2O3@1Al2O3, the specific surface areas of other composites decrease little after the deposition of gold. The loading content of gold is lower than the theoretical content. It may be the weak interaction between Au and Al2O3 that makes Au difficult to deposit on the support, especially when the content of Al2O3 is high. XRD patterns (Fig. 6) display diffraction peaks indicative of γ-Fe2O3 and γ-Al2O3 in the support and no peaks of α-Fe2O3 are observed for all Au/Fe2O3@Al2O3 materials. With the increase in the content of Al, the diffraction peaks of γ-Al2O3 become stronger, while the peaks of γ-Fe2O3 become weaker.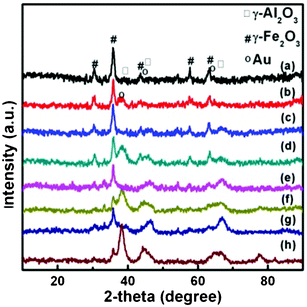 | ||
| Fig. 6 XRD patterns of Fe2O3@Al2O3 and Au/Fe2O3@Al2O3 composites with different Fe/Al ratios: (a) Fe2O3@Al2O3, (b) Au/1Fe2O3@1Al2O3, (c) 1Fe2O3@4Al2O3, (d) Au/1Fe2O3@4Al2O3, (e) 1Fe2O3@8Al2O3, (f) Au/1Fe2O3@8Al2O3, (g) 1Fe2O3@16Al2O3 and (h) Au/1Fe2O3@16Al2O3. | ||
| Sample Fe:Al | Au loading (%) | S BETs a (m2 g−1) | S BETc b (m2 g−1) | d s c (nm) | d s d (nm) | d Au e (nm) |
|---|---|---|---|---|---|---|
| a BET surface area of the as-prepared Fe2O3@Al2O3 support. b BET surface area of the Au/Fe2O3@Al2O3 composites. c Calculated by the Scherrer equation from the (311) peak (2θ = 35.6°) of maghemite. d Particle size of the support in Au/Fe2O3@Al2O3 composites was calculated by the Scherrer equation from the (311) peak (2θ = 35.6°) of maghemite. e Au particle size was determined by TEM. More than 300 particles were counted to give the average particle size. | ||||||
1![[thin space (1/6-em)]](https://www.rsc.org/images/entities/char_2009.gif) : :![[thin space (1/6-em)]](https://www.rsc.org/images/entities/char_2009.gif) 1 1 |
5.8 | 131 | 212 | 10 | 12 | 3.9 |
1![[thin space (1/6-em)]](https://www.rsc.org/images/entities/char_2009.gif) : :![[thin space (1/6-em)]](https://www.rsc.org/images/entities/char_2009.gif) 4 4 |
6.0 | 213 | 186 | 11 | 10 | 3.5 |
1![[thin space (1/6-em)]](https://www.rsc.org/images/entities/char_2009.gif) : :![[thin space (1/6-em)]](https://www.rsc.org/images/entities/char_2009.gif) 8 8 |
5.8 | 222 | 207 | 13 | 12 | 4.0 |
1![[thin space (1/6-em)]](https://www.rsc.org/images/entities/char_2009.gif) : :![[thin space (1/6-em)]](https://www.rsc.org/images/entities/char_2009.gif) 16 16 |
4.4 | 236 | 224 | 6.1 | 8.8 | 5.0 |
According to the XRD patterns, it can be inferred that the average particle size of gold follows the order: Au/1Fe2O3@16Al2O3 > Au/1Fe2O3@8Al2O3 > Au/1Fe2O3@1Al2O3 > Au/1Fe2O3@4Al2O3. More accurate data estimated by TEM are listed in Fig. 7. The TEM images show that the supports are composed of nanofibers with no nanoparticles observed in the Au/1Fe2O3@4Al2O3, Au/1Fe2O3@8Al2O3 and Au/1Fe2O3@16Al2O3 composites. For Au/1Fe2O3@1Al2O3, it is assumed from the nanoparticles shown in the TEM images that Fe2O3 was not well encapsulated by Al2O3 due to low Al content. The content of Al is exact to cover all the Fe2O3 particles in the Au/1Fe2O3@4Al2O3. It is found that gold particles are highly dispersed on the support with a small particle size. For Au/1Fe2O3@1Al2O3, Au/1Fe2O3@4Al2O3 and Au/1Fe2O3@8Al2O3, gold particles are dispersed evenly on Al2O3 and Fe2O3 with a range of particle size of 1–9 nm, which are 3.9, 3.5 and 4 nm, respectively. For Au/1Fe2O3@16Al2O3, the average particle size of gold is much larger at 5.0 nm.
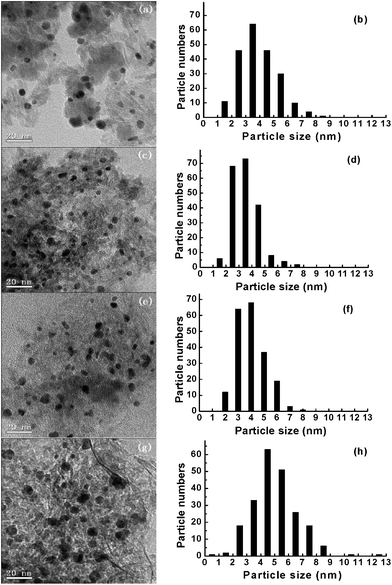 | ||
Fig. 7 TEM images and gold particle size distributions of the Au/Fe2O3@Al2O3 composites with different Fe/Al ratios: 1![[thin space (1/6-em)]](https://www.rsc.org/images/entities/char_2009.gif) : :![[thin space (1/6-em)]](https://www.rsc.org/images/entities/char_2009.gif) 1 (a and b), 1 1 (a and b), 1![[thin space (1/6-em)]](https://www.rsc.org/images/entities/char_2009.gif) : :![[thin space (1/6-em)]](https://www.rsc.org/images/entities/char_2009.gif) 4 (c and d), 1 4 (c and d), 1![[thin space (1/6-em)]](https://www.rsc.org/images/entities/char_2009.gif) : :![[thin space (1/6-em)]](https://www.rsc.org/images/entities/char_2009.gif) 8 (e and f) and 1 8 (e and f) and 1![[thin space (1/6-em)]](https://www.rsc.org/images/entities/char_2009.gif) : :![[thin space (1/6-em)]](https://www.rsc.org/images/entities/char_2009.gif) 16 (g and h). 16 (g and h). | ||
The electronic properties and surface content of the Au/Fe2O3@Al2O3 with different Fe/Al ratios were characterized by XPS and ICP, as listed in Table 6. It can be found that gold is in the metallic form (Au(0)) with only a single Au 4f7/2 peak at binding energy of 83.5–83.9 eV. According to the XPS and ICP results, the surface content of Al is 3–4 times higher than the bulk one for Au/Fe2O3@Al2O3. The surface content of Al has a maximum value at a certain Fe/Al ratio.
The reactivity of the Au/Fe2O3@Al2O3 catalysts with different Fe/Al ratios is shown in Fig. 8 and Table 7. All of the Au/Fe2O3@Al2O3 catalysts show higher activity than Au/Fe2O3 and Au/FeOx–NF, as reported previously.14,15 The catalytic activity order is as follows: Au/1Fe2O3@4Al2O3 > Au/1Fe2O3@8Al2O3 > Au/1Fe2O3@16Al2O3 > Au/1Fe2O3@1Al2O3. Four hour conversions of Au/1Fe2O3@4Al2O3 and Au/1Fe2O3@8Al2O3 reach 99% and their yields reach 80%, which are very close to the value of Au/Al2O3. Compared with Au/Al2O3, Au/Fe2O3@Al2O3 catalysts show higher stability during the reaction. Their selectivity keeps rising with the prolonging of reaction time, while that of Au/Al2O3 drops immediately after 4h. The Au/1Fe2O3@4Al2O3 obtained a conversion of 99% and selectivity of 93% in 8 h, with a shortened reaction time and higher selectivity than the maximum one of Au/Al2O3. Unlike the other Au/Fe2O3@Al2O3 catalysts, the selectivity of Au/1Fe2O3@16Al2O3 does not increase with the prolonging of the reaction time (Fig. 8 (B)); instead, it increases in the initial 4 h and then drops a little as the reaction goes on, like Au/Al2O3. The decline in the selectivity after 4 h is assumed to be because the low content of Fe leads to the stronger support basicity, which is not beneficial to the reaction because it helps the products’ hydrolysis, thus decreasing the selectivity. Maximum selectivity and yield are obtained at 4 h reaction time.
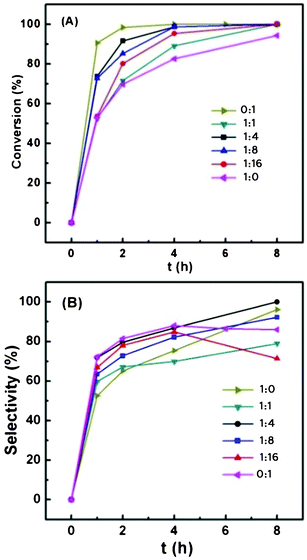 | ||
| Fig. 8 Conversion (A) and selectivity (B) of the dehydrogenation of 1,4-butanediol catalyzed by the Au/Fe2O3@Al2O3 composites with different Fe/Al ratios. Reaction conditions: 0.190 g catalyst, 1.4 g 1,4-butanediol, 20 mL TBP, 1.25 MPa air, 413 K. | ||
| Sample | Conversion (%) | Selectivity (%) | Yield (%) |
|---|---|---|---|
| a Reaction conditions: 0.190 g of catalyst, 1.4 g of 1,4-butanediol, 20 mL of TBP, 1.25 MPa air, 413 K, 4 h. | |||
| Au/Fe2O3 | 83 | 76 | 62 |
| Au/1Fe2O3@1Al2O3 | 89 | 70 | 62 |
| Au/1Fe2O3@4Al2O3 | 99 | 87 | 86 |
| Au/1Fe2O3@8Al2O3 | 99 | 82 | 81 |
| Au/1Fe2O3@16Al2O3 | 95 | 85 | 81 |
| Au/Al2O3 | 100 | 88 | 88 |
The above studies on Fe/Al ratios indicate the influence of the interaction between Fe2O3 and Al2O3. For Au/1Fe2O3@1Al2O3, the content of alumina is not enough to encapsulate iron oxide totally, corresponding to its lower activity which is close to Au/ γ-Fe2O3/γ-Al2O3 and Au/(Fe2O3+Al2O3) catalysts. Alumina can encapsulate iron oxide thoroughly in Au/1Fe2O3@4Al2O3 and Au/1Fe2O3@8Al2O3 composites with smaller gold particles, in correlation to the high activity in the reaction. For Au/1Fe2O3@16Al2O3, isolated Al2O3 particles on the surface may result from the low content of iron oxide and thus the properties of the support are close to Au/Al2O3. However, its gold particle size is larger than that of Au/Al2O3 and thus it is less reactive than Au/Al2O3. As shown in the above results, the Au/1Fe2O3@4Al2O3 composite, which was successfully obtained with optimized Fe/Al ratio, showed the highest catalytic activity and selectivity of all the materials synthesized in this work. Further work on the improvement of selectivity to lactones is under way.
3.5. The recyclable use of Au/Fe2O3@Al2O3 composites
Fig. 9 shows the photos of the magnetically induced separation of Au/Fe2O3@Al2O3 by exploiting their magnetic properties. A total amount of 0.01 g of sample was dispersed in 5 mL reaction mixture and the suspension was sonicated for 5 min. The resultant suspension appeared to be dark brown in color (Fig. 9a). When placing the vial near an external magnet for 1 min, the progressive separation of catalytic NPs was observed, while the composite was attracted toward the wall of the vial, which was closer to the magnet (Fig. 9b). With the time duration was extended to 10 min, the suspension became totally clear (Fig. 9c). Besides that, the composite powder can be re-dispersed again simply by shaking after removing the magnet (Fig. 9d). | ||
| Fig. 9 Pictures of the progressive separation of Au/Fe2O3@Al2O3 from the suspension (a) without magnet, (b) upon application of a magnet for 1 min, (c) upon application of a magnet for 10 min and (d) re-dispersion by shaking after removing the magnet. | ||
This shows the potential application of our Au/Fe2O3@Al2O3 composites in the industry. On one hand, the magnetic properties of the Au/Fe2O3@Al2O3 composites can make the catalyst easily well-dispersed in the three-phase reaction system via the introduction of an alternating electromagnetic field. With the externally applied magnetic field, the catalysts can be stably suspended in the reaction system resistant to gravity so that they would make good contacts with the reagent even in a large scale system. On the other hand, after the reaction, the catalysts could also be easily recovered by magnetic force, by means of the externally applied magnetic field. Hence, this kind of magnetic catalytic nanoparticle has the potential to be easily recovered after liquid phase reaction and greatly facilitate the practical running of an industrial plant. In addition, we have detected the metal content in the reaction mixture after the magnet separation by means of an ICP method and found that the remaining metal concentration is below the detection limit.
The Au/Fe2O3@Al2O3 composite could be reused for 4 successive reactions without significant loss of the catalytic activity (Fig. 10). In the XPS spectra, phosphorus is found on the surface of the recycled materials, as well as gold, aluminium and iron. The presence of phosphorus may be due to the adsorption of solvent, TBP (C12H27O4P), on the composites after reaction. Thus, it is assumed that the remaining TBP covers the active sites of the composites, resulting in the decrease in the reactivity. However, further studies on the regeneration will proceed in the future.
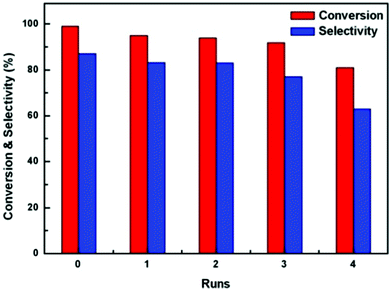 | ||
Fig. 10 Recyclability of the oxidative dehydrogenation of 1,4-butanediol catalyzed by Au/Fe2O3@Al2O3 composites with different Fe/Al ratios. Reaction conditions: catalyst:1,4-butanediol = 1![[thin space (1/6-em)]](https://www.rsc.org/images/entities/char_2009.gif) : :![[thin space (1/6-em)]](https://www.rsc.org/images/entities/char_2009.gif) 200, 20 mL TBP, 1.25 MPa air, 413 K. 200, 20 mL TBP, 1.25 MPa air, 413 K. | ||
4. Conclusions
In this work, we synthesized a new support to improve the catalytic activity and recovery properties of gold catalysts. Multi-component Fe–Al–O composites prepared by encapsulation (Fe2O3@Al2O3) and impregnation methods (γ-Fe2O3/γ-Al2O3 and Al2O3/α-Fe2O3) are employed as supports for gold catalysts. They were systematically studied. The Au/Fe–Al–O composites exhibited efficient catalytic activity and selectivity for the lactonization of 1,4-butanediol to γ-butyrolactone. The materials could also be easily recovered due to its super-paramagnetic property.Compared with the composites synthesized by the impregnation method, Au/Fe2O3@Al2O3 showed a higher conversion and selectivity in the oxidative dehydrogenation of 1,4-butanediol and its catalytic activity was better than that of the mixture of Au/Fe2O3 and Au/Al2O3, very close to that of the most reactive Au/Al2O3 catalyst. Gold can be highly dispersed on the Fe2O3@Al2O3 support surface with an average diameter of 3.5 nm and gold–support interaction was observed because its surface was enriched by hydroxyl groups like Al2O3 and basicity could be adjusted by Fe2O3.
By adjusting the Fe/Al molar ratio in Au/Fe2O3@Al2O3 composites, supports with different surface Fe/Al ratios were obtained. A lower amount of Al2O3 was not enough to encapsulate all of the Fe2O3 particles and the optimized Fe/Al ratio was found to be 1![[thin space (1/6-em)]](https://www.rsc.org/images/entities/char_2009.gif) :
:![[thin space (1/6-em)]](https://www.rsc.org/images/entities/char_2009.gif) 4. In addition, a further increase in Al content would lead to the weakening of the Fe–Al interaction and stronger support basicity, which was disadvantageous to the reaction.
4. In addition, a further increase in Al content would lead to the weakening of the Fe–Al interaction and stronger support basicity, which was disadvantageous to the reaction.
Acknowledgements
Financially supported by the Major State Basic Resource Development Program (Grant No. 2012CB224804), NNSFC (Project 21173052, 20973042), the Research Fund for the Doctoral Program of Higher Education (20090071110011) and the Natural Science Foundation of Shanghai Science & Technology Committee (08DZ2270500).References
- A. Abad, P. Concepcion, A. Corma and H. Garcia, Angew. Chem., Int. Ed., 2005, 44, 4066–4069 CrossRef CAS.
- D. Andreeva, V. Idakiev, T. Tabakova, A. Andreev and R. Giovanoli, Appl. Catal., A, 1996, 134, 275–283 CrossRef CAS.
- M. Haruta, N. Yamada, T. Kobayashi and S. Iijima, J. Catal., 1989, 115, 301–309 CrossRef CAS.
- M. D. Hughes, Y. J. Xu, P. Jenkins, P. McMorn, P. Landon, D. I. Enache, A. F. Carley, G. A. Attard, G. J. Hutchings, F. King, E. H. Stitt, P. Johnston, K. Griffin and C. J. Kiely, Nature, 2005, 437, 1132–1135 CrossRef CAS.
- W. B. Hou, N. A. Dehm and R. W. J. Scott, J. Catal., 2008, 253, 22–27 CrossRef CAS.
- T. Mitsudome, A. Noujima, T. Mizugaki, K. Jitsukawa and K. Kaneda, Green Chem., 2009, 11, 793–797 RSC.
- H. B. Ji, T. Mizugaki, K. Ebitani and K. Kaneda, Tetrahedron Lett., 2002, 43, 7179–7183 CrossRef CAS.
- M. S. Kwon, N. Kim, C. M. Park, J. S. Lee, K. Y. Kang and J. Park, Org. Lett., 2005, 7, 1077–1079 CrossRef CAS.
- T. Nishimura, N. Kakiuchi, M. Inoue and S. Uemura, Chem. Commun., 2000, 1245–1246 RSC.
- N. Kakiuchi, T. Takahiro Nishimura, M. Masashi Inoue and S. Sakae Uemura, Bull. Chem. Soc. Jpn., 2001, 74, 165–172 CrossRef CAS.
- A. C. Albertsson and I. K. Varma, Biomacromolecules, 2003, 4, 1466–1486 CrossRef CAS.
- S. Kobayashi, Macromol. Symp., 2006, 240, 178–185 CrossRef CAS.
- H. Lee, F. Q. Zeng, M. Dunne and C. Allen, Biomacromolecules, 2005, 6, 3119–3128 CrossRef CAS.
- J. Huang, W. L. Dai and K. N. Fan, J. Phys. Chem. C, 2008, 112, 16110–16117 CAS.
- J. Huang, W. L. Dai and K. N. Fan, J. Catal., 2009, 266, 228–235 CrossRef CAS.
- J. Huang, W. L. Dai, H. X. Li and K. Fan, J. Catal., 2007, 252, 69–76 CrossRef CAS.
- J. Huang, Y. Wang, J. M. Zheng, W. L. Dai and K. N. Fan, Appl. Catal., B, 2011, 103, 343–350 CrossRef CAS.
- M. Comotti, W. C. Li, B. Spliethoff and F. Schuth, J. Am. Chem. Soc., 2006, 128, 917–924 CrossRef CAS.
- A. C. Gluhoi, N. Bogdanchikova and B. E. Nieuwenhuys, J. Catal., 2005, 229, 154–162 CrossRef CAS.
- M. M. Schubert, S. Hackenberg, A. C. van Veen, M. Muhler, V. Plzak and R. J. Behm, J. Catal., 2001, 197, 113–122 CrossRef CAS.
- W. F. Yan, B. Chen, S. M. Mahurin, V. Schwartz, D. R. Mullins, A. R. Lupini, S. J. Pennycook, S. Dai and S. H. Overbury, J. Phys. Chem. B, 2005, 109, 10676–10685 CrossRef CAS.
- J. Q. Lu, X. M. Zhang, J. J. Bravo-Suarez, K. K. Bando, T. Fujitani and S. T. Oyama, J. Catal., 2007, 250, 350–359 CrossRef CAS.
- . J. Guzman and B. C. Gates, J. Am. Chem. Soc., 2004, 126, 2672–2673 CrossRef.
- B. E. Solsona, T. Garcia, C. Jones, S. H. Taylor, A. F. Carley and G. J. Hutchings, Appl. Catal., A, 2006, 312, 67–76 CrossRef CAS.
- M. J. Lippits, A. C. Gluhoi and B. E. Nieuwenhuys, Top. Catal., 2007, 44, 159–165 CrossRef CAS.
- R. J. H. Grisel, J. J. Slyconish and B. E. Nieuwenhuys, Top. Catal., 2001, 16, 425–431 CrossRef.
- M. A. Centeno, K. Hadjiivanov, T. Venkov, H. Klimev and J. A. Odriozola, J. Mol. Catal. A: Chem., 2006, 252, 142–149 CrossRef CAS.
- F. W. Chang, H. Y. Yu, L. S. Roselin, H. C. Yang and T. C. Ou, Appl. Catal., A, 2006, 302, 157–167 CrossRef CAS.
- K. Qian, W. X. Huang, Z. Q. Jiang and H. X. Sun, J. Catal., 2007, 248, 137–141 CrossRef CAS.
- M. A. Centeno, M. Paulis, M. Montes and J. A. Odriozola, Appl. Catal., A, 2002, 234, 65–78 CrossRef CAS.
- A. C. Gluhoi, N. Bogdanchikova and B. E. Nieuwenhuys, J. Catal., 2005, 232, 96–101 CrossRef CAS.
- A. C. Gluhoi and B. E. Nieutwenhuys, Catal. Today, 2007, 119, 305–310 CrossRef CAS.
- S. D. Lin, A. C. Gluhoi and B. E. Nieuwenhuys, Catal. Today, 2004, 90, 3–14 CrossRef CAS.
- D. Niakolas, C. Andronikou, C. Papadopoulou and H. Matralis, Catal. Today, 2006, 112, 184–187 CrossRef CAS.
- J. M. Hua, Q. Zheng, Y. H. Zheng, K. M. Wei and X. Y. Lin, Catal. Lett., 2005, 102, 99–108 CrossRef CAS.
- P. Haider and A. Baiker, J. Catal., 2007, 248, 175–187 CrossRef CAS.
- C. Gennequin, M. Lamallem, R. Cousin, S. Siffert, V. Idakiev, T. Tabakova, A. Aboukais and B. L. Su, J. Mater. Sci., 2009, 44, 6654–6662 CrossRef CAS.
- P. Haider, J. D. Grunwaldt, R. Seidel and A. Baiker, J. Catal., 2007, 250, 313–323 CrossRef CAS.
- V. Idakiev, T. Tabakova, K. Tenchev, Z. Y. Yuan, T. Z. Ren, A. Vantomme and B. L. Su, J. Mater. Sci., 2009, 44, 6637–6643 CrossRef CAS.
- I. Dobrosz-Gomez, I. Kocemba and J. M. Rynkowski, Appl. Catal., B, 2008, 83, 240–255 CrossRef CAS.
- I. Dobrosz-Gomez, I. Kocemba and J. M. Rynkowski, Catal. Lett., 2009, 128, 297–306 CrossRef CAS.
- R. J. H. Grisel and B. E. Neiuwenhuys, Catal. Today, 2001, 64, 69–81 CrossRef CAS.
- Z. Ma, S. H. Overbury and S. Dai, J. Mol. Catal. A: Chem., 2007, 273, 186–197 CrossRef CAS.
- V. Rodriguez-Gonzalez, R. Zanella, L. A. Calzada and R. Gomez, J. Phys. Chem. C, 2009, 113, 8911–8917 CAS.
- G. Avgouropoulos, M. Manzoli, F. Boccuzzi, T. Tabakova, J. Papavasiliou, T. Ioannides and V. Idakiev, J. Catal., 2008, 256, 237–247 CrossRef CAS.
- L. Kesavan, R. Tiruvalam, M. H. A. Rahim, M. I. bin Saiman, D. I. Enache, R. L. Jenkins, N. Dimitratos, J. A. Lopez-Sanchez, S. H. Taylor, D. W. Knight, C. J. Kiely and G. J. Hutchings, Science, 2011, 331, 195–199 CrossRef CAS.
- N. Dimitratos, J. A. Lopez-Sanchez and G. J. Hutchings, Chem. Sci., 2012, 3, 20–44 RSC.
- A. Abad, A. Corma and H. García, Chem.–Eur. J., 2008, 14, 212–222 CrossRef CAS.
- B. N. Zope, D. D. Hibbitts, M. Neurock and R. J. Davis, Science, 2010, 330, 74–78 CrossRef CAS.
- A. Wittstock1, V. Zielasek1, J. Biener, C. M. Friend and M. Bäumer, Science, 2010, 327, 319–322 CrossRef.
- C. D. Pina, E. Falletta and M. Rossi, Chem. Soc. Rev., 2012, 41, 350–369 RSC.
- C. P. Vinod, K. Wilson and A. F. Lee, J. Chem. Technol. Biotechnol., 2011, 86, 161–171 CrossRef CAS.
- Y. F. Han, Z. Y. Zhong, K. Ramesh, F. X. Chen and L. W. Chen, J. Phys. Chem. C, 2007, 111, 3163–3170 CAS.
- C. M. Wang, K. N. Fan and Z. P. Liu, J. Phys. Chem. C, 2007, 111, 13539–13546 CAS.
- W. F. Yan, S. M. Mahurin, Z. W. Pan, S. H. Overbury and S. Dai, J. Am. Chem. Soc., 2005, 127, 10480–10481 CrossRef CAS.
- V. Polshettiwar, R. Luque, A. Fihri, H. Zhu, M. Bouhrara and J. Basset, Chem. Rev., 2011, 111, 3036–3075 CrossRef CAS.
- M. A. Karakassides, D. Gournis, A. B. Bourlinos, P. N. Trikalitis and T. Bakas, J. Mater. Chem., 2003, 13, 871–876 RSC.
- K. Mori, S. Kanai, T. Hara, T. Mizugaki, K. Ebitani, K. Jitsukawa and K. Kaneda, Chem. Mater., 2007, 19, 1249–1256 CrossRef CAS.
- R. Zanella, S. Giorgio, C.-H. Shin, C. R. Henry and C. Louis, J. Catal., 2004, 222, 357–367 CrossRef CAS.
- J. Radnik, L. Wilde, M. Schneider, M. M. Pohl and D. Herein, J. Phys. Chem. B, 2006, 110, 23688–23693 CrossRef CAS.
| This journal is © The Royal Society of Chemistry 2012 |
