Crystallisation kinetics in thin films of dihexyl-terthiophene: the appearance of polymorphic phases†
Bernhard
Wedl
a,
Roland
Resel
*a,
Günther
Leising
a,
Birgit
Kunert
a,
Ingo
Salzmann
b,
Martin
Oehzelt
c,
Norbert
Koch
bc,
Antje
Vollmer
c,
Steffen
Duhm
d,
Oliver
Werzer
e,
Gabin
Gbabode
f,
Michele
Sferrazza
g and
Yves
Geerts
f
aInstitute of Solid State Physics, Graz University of Technology, Petersgasse, 16, A-8010, Graz, Austria. E-mail: roland.resel@tugraz.at
bInstitut für Physik, Humboldt-Universität zu Berlin, Brook-Taylor Straβe, 6, D-12489, Berlin, Germany
cHelmholtz Zentrum Berlin für Materialien und Energie - BESSY II, D-12489, Berlin, Germany
dGraduate School of Advanced Integration Science, Chiba University, 1-33 Yayoi-cho, Inage-ku, Chiba 263-8522, Japan
eCentre for Organic Electronics, The University of Newcastle, Callaghan, NSW 2308, Australia
fChimie des Polymères, Faculte des Sciences, Université Libre de Bruxelles, Boulevard duTriomphe CP 206/0, 1050 Bruxelle, Belgium
gDépartement de Physique, Faculte des Sciences, Université Libre de Bruxelles, Boulevard du Triomphe, CP, 223, B-1050, Bruxelles, Belgium
First published on 2nd April 2012
Abstract
The presence of surface-induced crystal structures is well known within organic thin films. However, the physical parameters responsible for their formation are still under debate. In the present work, we present the formation of polymorphic crystal structures of the molecule dihexyl-terthiophene in thin films. The films are prepared by different methods using solution-based methods like spin-coating, dip-coating and drop-casting, but also by physical vapour deposition. The thin films are characterised by various X-ray diffraction methods to investigate the crystallographic properties and by microscopy techniques (atomic force microscopy and optical microscopy) to determine the thin film morphologies. Three different polymorphic crystal structures are identified and their appearance is related to the film preparation parameters. The crystallisation speed is varied by the evaporation rate of the solvent and is identified as a key parameter for the respective polymorphs present in the films. Slow crystallisation speed induces preferential growth in the stable bulk structure, while fast crystallisation leads to the occurrence of a metastable thin-film phase. Furthermore, by combining X-ray reflectivity investigations with photoelectron spectroscopy experiments, the presence of a monolayer thick wetting layer below the crystalline film could be evidenced. This work gives an example of thin film growth where the kinetics during the crystallisation rather than the film thickness is identified as the critical parameter for the presence of a thin-film phase within organic thin films.
Introduction
The structural order in thin films of organic semiconductors (OSCs) strongly impacts the performance of organic electronic devices. In particular, for crystalline OSC films, the molecular orientation and the crystalline quality, the size of crystalline grains and the crystal structure itself govern the charge transport properties, since small changes in the molecular packing considerably impact the intermolecular orbital overlap, and, therefore, the transport properties in organic electronic devices.1–4 A large number of OSCs used in the field of organic electronics exhibit polymorphism, that is, different crystal structures of the same compound occurring depending on the substrate nature, the specific preparation parameters and techniques.5–7 Hence, the precise determination of polymorphic crystal structures present in thin OSC films is of high interest for both fundamental and application-related research. It is well established that molecules with flexible moieties show a particularly strong tendency towards polymorphism.8 However, also comparably simple and rigid molecules like, for example, pentacene (PEN), exhibit polymorphism with, in that case, at least three significantly different crystal structures.9 One of these polymorphs is generally denoted as ‘thin-film phase’, since it was found to occur in thin films only, and, in general, such thin-film polymorphs do not exist as macroscopic free-standing single crystals. Therefore, crystal structure solutions of thin-film polymorphs cannot be carried out via conventional single-crystal or powder diffraction methods and experimentally demanding surface-diffraction methods have to be applied instead. Today, an increasing number of examples exist where the crystal structure of OSC thin-film phases could successfully be solved by a combined experimental/theoretical approach.10–15In contrast to the experimental success in providing full-structure solutions of such polymorphs, the physical reasons of thin-film phase formation are still not fully understood. Several general thermodynamic and kinetic parameters, like, for example, the induction time, have been identified to influence the formation of polymorphic crystal structures in organic materials.16 However, for thin organic films, the kinetics of polymorphic growth, even for simple and well-studied molecules like PEN, is still under debate. Therefore, the coexistence of thin-film phase and equilibrium bulk structure in thin films is a commonly observed phenomenon that has attracted significant research interest in recent years, where controversial suggestions have been made for the dynamics of the observed bimodal growth of PEN. For instance, it was proposed that on SiOx substrates both phases nucleate as early as the first monolayer.17 In contrast, it was frequently reported that the growth of PEN starts with the formation of a monolayer of upright standing molecules on which, subsequently, the formation of the thin-film phase continues.18–20
As the commonly used designation ‘thin-film phase’ suggests, a widely accepted model proposes its formation up to a certain critical film thickness (e.g., for PEN of ca. 50 nm)21 where, then, growth in the equilibrium bulk phase starts.22,23 Definitely, several important key parameters for the formation of polymorph phases could clearly be identified: the substrate temperature during film deposition and super-saturation during the growth process.21,24 Moreover, evidence exists that the crystallisation time induces the formation of distinct polymorphs16 and, likewise, the temperature during crystallisation,24,25 and surface effects.26 Finally, for PEN even the formation of an amorphous molecular ‘wetting layer’ decorating the SiOx substrate below thin-film phase was proposed.27
The aim of the present work is, first, to challenge the common belief that the film thickness itself is the central parameter for thin-film phase formation, and, second, to identify further parameters influencing its formation. As model compound for our investigations we chose dihexylterthiophene (DH3T), which is composed of a thiophene backbone and hexyl end-substitutions that allow processing the material from solution. Moreover, thiophenes are of direct application relevance in organic electronics, and numerous comprehensive studies on the crystal growth of (alkylated) thiophenes have already been carried out.28,29 To assess information on correlations between preparation parameters and polymorphism we prepared DH3T thin films on SiOx substrates by spin-coating, dip-coating, drop-casting, and use physical vapour deposition as a complementary preparation technique. As the main experimental tool we applied X-ray diffraction methods to determine the crystallographic structure of the films supported by morphological investigations using atomic force and optical microscopy and photoelectron spectroscopy.
Results
Bulk material characterisation
The full solution of the single crystal structure reveals a monoclinic crystal structure (space group P21/n) with lattice constants of a = 2.394 nm, b = 0.5625 nm, c = 5.240 nm and β = 97.82° with Z = 12 molecules in the unit cell and a mass density of 1.187 g cm−3; this phase is denoted as α-phase of DH3T in the following. It is found that the terthiophene (3T) backbone units are packed in a herringbone pattern with parallel long molecular axes and inclined molecular planes. Interestingly, not all 3T are perfectly aligned within the herringbone layer, i.e., some 3T backbone units are vertically shifted slightly out of the plane by a distance of about one thiophene ring. The hexyl side-chains are straight stretched and, in nearly all cases, oriented along the 3T backbone. However, one particular molecule of the unit cell exhibits an alkyl chain tilted off the backbone axis by about 25°. Therefore, the translational periodicity in a-direction of the unit cell (i.e., along the herringbone layer) is larger than observed for non-alkylated 3T.30Polycrystalline DH3T powder was investigated by X-ray powder diffraction (XRD) immediately after the differential scanning calorimetry (see ESI†). It is observed that the α-phase of DH3T is dominantly present, as identified by the characteristic lattice spacing of the (002) reflection determined to be d = 2.60 nm (qz = 2.42 nm−1). However, a second, as yet unknown phase appears in addition. This phase is denoted as β-phase; it exhibits a characteristic peak at qz = 2.47 nm−1 (d = 2.54 nm).
Spin-coated films
The first step into thin-film investigation was spin coating of DH3T on SiOx substrates. Solutions of different molecular concentration were used in order to vary the final thickness of the films. These films were investigated by X-ray reflectivity (XRR), and the results are shown in Fig. 1. For c < 0.21 mg ml−1, no continuous film was formed and only the XRR signature of the bare substrate was observed (not shown), i.e., oscillations with a periodicity of Δqz ∼ 0.06 nm−1 arise from the oxide layer of the silicon substrate, as observed for all investigated samples. At c = 0.21 mg ml−1, one additional broad oscillation appears with a clear minimum at qz ∼ 1.20 nm−1. Fitting the experimental data reveals a corresponding film thickness of 2.7 nm, which agrees well with the molecular length of DH3T (about 2.9 nm assuming an upright orientation of stretched molecules). Therefore, we conclude that a first monolayer of nearly upright-standing molecules is formed upon spin coating of DH3T on SiOx. Fig. 2a depicts one representative atomic force microscopy (AFM) result of this film showing evidence for an almost closed monolayer (represented by the intermediate bright area), which, however, does not fully cover the substrate (elongated dark areas). Following the height profile along the black line in Fig. 2a, the monolayer shows a constant height above the substrate surface of about 2.7 nm, which agrees well with the thickness determination performed by XRR. The small elevated islands apparent in the film show typical heights of one to two times the molecular length. Furthermore, a similar number of defects (small vacancies) in the monolayer film exist, which appear in the vicinity of the islands. Due to their characteristic height we attribute these islands to three-dimensional nucleation of DH3T on top of the (almost closed) monolayer.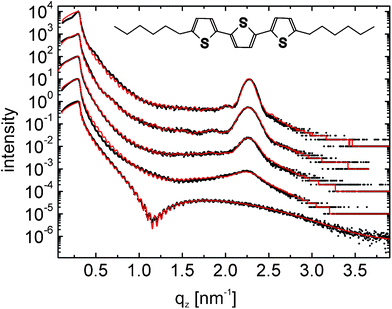 | ||
| Fig. 1 X-Ray reflectivity results for different thin films of the molecule dihexylterthiophene (DH3T) (dots) together with theoretical fits (full lines); the curves are vertically shifted for clarity. The films are prepared by spin coating from tetrahydrofuran solutions with concentrations of 2.79 mg ml−1, 1.91 mg ml−1, 1.09 mg ml−1, 0.66 mg ml−1 and 0.21 mg ml−1 (from top to down). The inset gives the chemical structure of DH3T. | ||
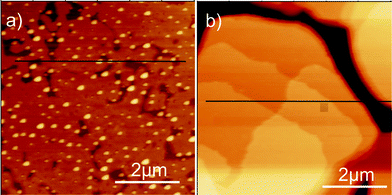 | ||
| Fig. 2 Atomic force microscopy micrographs of spin coated films prepared from a 0.21 mg ml−1 solution (a) and from a 2.79 mg ml−1 solution (b). The height profiles along the horizontal black lines are discussed in the text. | ||
Increasing the DH3T concentration in the source solution to 2.79 mg ml−1 substantially alters the morphology of the spin-coated films, as shown in the representative AFM micrograph in Fig. 2b. Here, we find a terraced surface of the film with characteristic steps of height h = 2.7 nm surrounded by areas significantly lower in elevation by about 35 nm, as deduced from an AFM section analysis (black line in Fig. 2b). This morphology points towards the growth of DH3T islands exhibiting monomolecular steps of upright standing molecules, as frequently observed for thin films of (alkylated) thiophene molecules on SiOx.31–33 However, from AFM alone, the potential presence or absence of a DH3T wetting layer lying below the islands, and, therefore, the question of DH3T growing in Stranski--Krastanov34 (layer-plus-island) or Volmer–Weber35 (island) growth mode36 cannot be definitively answered.
A significantly stronger corrugated surface morphology is found by AFM for films prepared at high concentrations (c ≥ 0.66 mg ml−1). The XRR measurements do not show the characteristic pattern of the monolayer, as found for the lowermost concentration (Fig. 1, c = 0.21 mg ml−1). However, with increasing concentration a Bragg peak arises at qz = 2.22 nm−1 (for c = 0.66 mg ml−1), which slightly shifts to qz = 2.269 nm−1 for c = 2.79 mg ml−1. This shift is attributed to the interference of the scattering amplitudes of the substrate and the organic film, which is of relevance only at low film thicknesses.20 This Bragg peak can neither be assigned to the α-phase nor to the β-phase found in X-ray powder diffraction measurements and is attributed to the DH3T thin-film phase in the following (cf.Table 1).
| Thin-film phase | α-Phase | β-Phase | |
|---|---|---|---|
| [qz(002) / d002] | [qz(002) / d002] | [qz(002) / d002] | |
| Film, spin coating (c = 2.79 mg ml−1) | 2.269 nm−1 / 2.769 nm | ||
| Film, drop casting (2 min) | 2.27 nm−1 / 2.77 nm | ||
| Film, drop casting (600 min) | 2.42 nm−1 / 2.60 nm | 2.47 nm−1 / 2.55 nm | |
| Film, dip coating (500 μm s−1) | 2.27 nm−1 / 2.77 nm | ||
| Film, dip coating (50 μm s−1) | 2.43 nm−1 / 2.59 nm | 2.48 nm−1 / 2.53 nm | |
| Film, physical vapour deposition | 2.271 nm−1 / 2.767 nm | ||
| Polycrystalline powder | 2.42 nm−1 / 2.60 nm | 2.47 nm−1 / 2.55 nm | |
| Single crystal | 2.420 nm−1 / 2.596 nm |
Fitting the XRR curves clearly reveals the presence of a closed wetting layer at the interface between the crystalline DH3T islands and the inorganic substrate for all samples with c ≥ 0.66 mg ml−1 with a layer thickness of 1.3 ± 0.2 nm. The XRR data reveal a different crystalline thickness of the islands grown on top of the wetting layer for the samples prepared from different concentrations: a vertical crystallite size of about four layers of upright standing molecules is obtained for c = 0.66 mg ml−1, 9 layers for c = 1.09 mg ml−1, 11 layers for 1.91 mg ml−1, and 17 layers for the film prepared from c = 2.79 mg ml−1. This clearly demonstrates the tendency to three-dimensional growth of DH3T from solution upon increasing concentration, i.e., with increasing film thickness. Since for all films prepared from solutions of c ≥ 0.66 mg ml−1 the presence of a closed wetting layer is clearly deduced from XRR, these data evidence Stranski–Krastanov growth of DH3T in the island-like morphology observed by AFM (Fig. 2b).
The position of the Bragg peak in the XRR patterns evidences crystallites with a periodicity of d = 2.76 nm perpendicular to the substrate surface. Because the oxide top layer of the silicon substrates is amorphous and isotropic, no in-plane alignment of the crystallites is expected. Therefore fibre-textured growth (i.e., in the form of a two-dimensional crystalline powder) of the DH3T crystallites occurs. Complementary to our XRR investigations probing the out-of-plane order, the crystal structure of the spin-coated films was investigated by grazing incidence X-ray diffraction (GIXD) to reveal the crystallographic in-plane structure. The corresponding reciprocal space map is depicted in Fig. 3. Rods of diffraction peaks are observed at defined qxy values, while the peak positions are exactly equidistant along qz. The unit-cell parameters of the thin-film phase can thus be determined by indexing the diffraction spots and an orthorhombic unit cell is obtained with lattice constants of a = 3.056 nm, b = 2.228 nm, c = 5.560 nm. Fig. 3 illustrates the experimental reciprocal space map together with the calculated positions of the Bragg peaks marked with white dots. With this unit-cell the specular Bragg peak (cf.Fig. 1) is identified as 002 reflection of the thin-film phase. Note that, as apparent in Fig. 3, minor contributions of the α-phase are found (red dots) besides the dominating thin-film phase reflections.
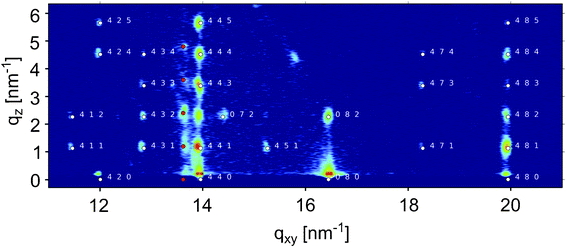 | ||
| Fig. 3 Reciprocal space map of a spin coated film obtained by grazing incidence X-ray diffraction (GIXD); intensities are plotted on logarithmic scale. The indexation of the thin-film phase is given by white symbols together with the respective Miller indices. Additional diffraction spots are located along the rod at qxy = 13.61 nm−1, which could be identified as the α-phase of DH3T; these diffraction spots are marked by red circles. | ||
The strongest diffraction peaks are observed in rods along qxy = 14.0 nm−1, 16.5 nm−1 and 19.9 nm−1, which is typical for herringbone structures adopted by upright standing rod-like molecules.37 There, the strongest scattering amplitudes are caused by the (almost) parallel long molecular axes and the tilt of the molecular planes with respect to each other by a herringbone angle.11,12,14,36 In analogy to our full structure solution for the α-phase, we assume a similar herringbone packing of the DH3T molecules also in the thin-film phase. This assumption is supported by the reported structures of related thiophenes, e.g., terthiophene,33 quaterthiophene,38 α,ω-dihexyl-quaterthiophene,39 sexithiophene (6T),40 and α,ω-dihexyl-sexithiophene (DH6T),41,42 all of which exhibit a molecular herringbone arrangement. In particular, for alkyl-terminated oligothiophenes recent experimental observations demonstrate the interaction between the thiophene-backbone units to be decisive for the nature of the crystal structure.36,43
Simple herringbone packings of thiophene units typically exhibit 2 molecules per unit cell with unit cell parameters of a ∼ 0.78 nm, b ∼ 0.55 nm and c of about the length of the respective molecule.39 In the case of our DH3T thin-film phase the lattice constants are multiples along the three crystallographic directions a, b, and c by factors of 4, 4 and 2, respectively. Therefore, the number of molecules within the unit cell of the thin-film phase is set to Z = 64, which results to a volume for a single molecule of 0.592 nm3 in this polymorph, which is only slightly larger than that in the α-phase of 0.583 nm3.
Drop-cast films
To vary the crystallisation time over a wider range than possible via spin-coating, a series of drop-cast films was prepared by varying the evaporation rate of the solvent. While under ambient conditions a drop volume of 1 ml – as used in the present experiments – dries within two minutes, the evaporation time (t) of the solvent can be increased up to 600 min by applying a protective atmosphere of the solvent; Fig. 4a displays the specular X-ray diffraction patterns of four drop-cast films prepared with different t. In the case of shortest t (2 min, red curve) a strong diffraction peak is observed at qz = 2.27 nm−1 (d = 2.77 nm), which can be clearly identified as 002 reflection of the thin-film phase, and, in addition, a small contribution of the α-phase at qz = 2.42 nm−1 (d = 2.60 nm) is observed. In case of the film with t = 600 min (black curve), the Bragg peak from the thin film phase is absent while the peak from the α-phase is dominantly found. The final proof that these peaks arise from the α-phase is obtained by higher-order reflections (not shown) that exhibit the characteristic positions and relative peak-intensities of the 00L-series of the α-phase (as known from the single crystal solution). Interestingly, a new peak appears at qz = 2.47 nm−1 (d = 2.55 nm), which cannot be assigned to the α- or the thin-film phase. However, since this peak is already observed by powder diffraction (see above), we assign this peak to the third crystallographic structure, denoted as β-phase of DH3T. Table 1 summarises the observed qz positions of the peaks together with the corresponding d-values for the three different polymorphs.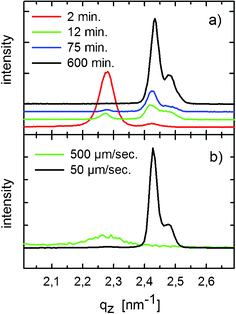 | ||
| Fig. 4 X-Ray diffraction specular scans on drop-cast films prepared under different evaporation times of the solvent (a) and prepared by dip-coating using different withdrawal velocities (b). The curves are vertically shifted for clarity. | ||
For evaporation times between these two experimental limits, e.g., t = 12 min (green curve in Fig. 4a) and 75 min (blue curve), a gradual transition from the dominating thin-film phase (t = 2 min) to the α- and the β-phase (t = 600 min) is observed. Supporting optical microscopy investigations of these four films are illustrated in Fig. 5. In all cases, the crystallites show a needle-like morphology with characteristic needle diameters increasing with the evaporation time of the solvent from a few μm (t = 2 min) up to ca. 40 μm (t = 600 min). Likewise, the length of the needles increases from several tenths of a μm up to the millimetre regime.
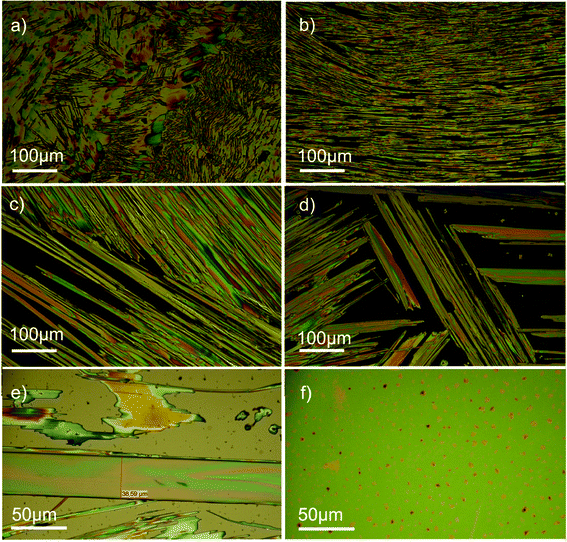 | ||
| Fig. 5 Optical light microscopy results under crossed polarisation. Drop-cast films prepared by different times of solvent evaporation of 2 min (a), 12 min (b), 75 min (c), 600 min (d), and dip-coated films prepared using different withdrawal velocities of 50 μm s−1 (e) and 500 μm s−1 (f). | ||
X-Ray diffraction rocking-curve investigations allow assessment of additional properties of these crystallites. Since rocking curves are performed on one single Bragg peak, the angular width of a rocking curve (Δω) directly provides the integrated variation of the tilt angle of the respective set of planes relative to the sample surface. In general, the width of the rocking curve is correlated with the mosaicity of the single crystalline domains.44 To compare the mosaicity of the three polymorphic phases, the rocking curve investigations were carried out on the respective 002 reflections; the results are depicted in Fig. 6. The smallest rocking width is observed for the thin-film phase with a mosaicity of Δqxy = 2.3 × 10⁻³ nm−1 (Δω = 0.059°). In contrast, the rocking curves for both the α- and the β-phase show a markedly larger rocking width of Δqxy = 5.1 × 10⁻³ nm−1 (Δω = 0.12°) and qxy = 6.0 × 10⁻³ nm−1 (Δω = 0.14°), respectively. The smaller rocking width clearly demonstrates an exceedingly improved out-of-plane orientation of DH3T crystallites grown in the thin-film phase as compared to the crystallites grown in the α- and β-phases. The flat background of the rocking curve suggests high structural perfection of DH3T crystallites grown in the thin-film phase.
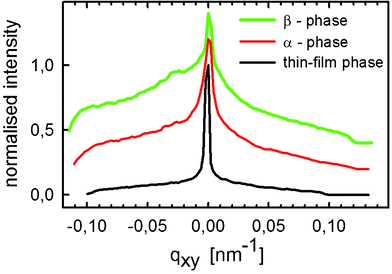 | ||
| Fig. 6 X-Ray diffraction rocking curve measurements of the 002 Bragg peaks from the three different polymorphs measured on one single drop-cast film. The curves for the α- and the β-phase are vertically shifted for clarity. | ||
Dip-coated films
In order to induce an in-plane alignment to the crystallites, dip-coated films were prepared by different withdrawal velocities (v). Compared to the films formed by drop-casting or spin-coating, the obtained morphologies are markedly different: For low v-values macroscopic crystals with a needle-like morphology are observed with the needles preferentially aligned along the direction of withdrawal. In contrast, for high v-values, crystals with almost circular shape are formed. In both cases the crystallites grow highly bi-axially textured, with the (001) plane parallel to the substrate surface and the [100] direction parallel to the direction of withdrawal (see ESI†).For the film prepared with v = 500 μm s−1, specular X-ray diffraction reveals a broad Bragg peak at qz = 2.27 nm−1 (green curve in Fig. 4b), while the scan on the film grown by v = 50 μm s−1 shows two distinct, sharp Bragg peaks at qz = 2.43 nm−1 and 2.48 nm−1. In full analogy to the drop-cast films, these peaks are assigned to thin-film, α-, and β-phases, respectively (Table 1). Note that the variations in the observed qz values for the distinct phases are well below the instrumental error of the experiment.
Films prepared by physical vapour deposition
The specular X-ray diffraction pattern of a film prepared by physical vapour deposition is depicted in Fig. 7. At low qz values Kiessig fringes are observed demonstrating that the DH3T layer exhibits a homogenous layer thickness of 44 nm. Moreover, one single Bragg peak is observed at qz = 2.271 nm−1, which reveals that the film is exclusively grown in the thin-film phase (see Table 1). In the vicinity of the Bragg peak distinct Laue oscillations are observed, which allow determining the coherent thickness of the crystallites to 45 nm. Supporting AFM investigations (see ESI†) reveal a surface roughness of 6 nm, which qualitatively agrees with a fit of the XRR pattern (red curve in Fig. 7) yielding a roughness of 11 nm. This XRR fit needs to assume, as already in the case of the spin-coated films, an interfacial layer between the substrate and the organic film of 1.4 ± 0.4 nm thickness This points, again, toward the presence of a wetting layer probably formed by DH3T molecules itself. Since the (likely amorphous) wetting layer in not directly observed by X-ray diffraction techniques, we carried out photoelectron spectroscopy (PES) investigations.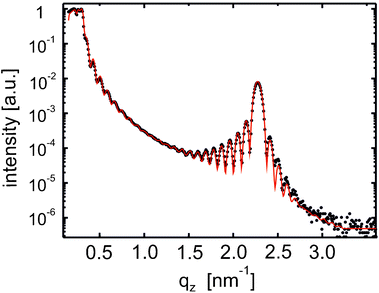 | ||
| Fig. 7 Specular X-ray reflectivity (XRR) results for a film of DH3T prepared by physical vapour deposition. The experimental data (dots) are shown together with the theoretical fit (full line). | ||
Numerous previous studies demonstrated that information on the electronic structure obtained by PES can efficiently be correlated with the molecular orientation in the films, since the ionisation energy (IE) of directed molecular assemblies is a highly orientation-dependent quantity.45–47 This is rationalized by the presence of intra-molecular polar bonds and/or π-conjugated molecular backbones leading to a dipolar surface termination of thin films, which impacts IE. In addition, thin films composed of polar molecules may induce vacuum-level shifts at organic/metal and organic/organic interfaces depending on their respective orientation due to the presence of permanent dipoles of the molecules.48
Making use of these effects we employed UPS/XPS experiments to provide evidence for the presence of a wetting layer of intact DH3T molecules on SiOx, which was suggested by our XRR results. Films grown in situ by vacuum deposition on both SiOx and polycrystalline Au substrates were investigated, the results are depicted in Fig. 8. In these experiments the films on the Au substrates provided reference spectra for lying DH3T molecules on the substrate, since it is well established that (alkylated) thiophenes, e.g. 6T or DH6T, adopt a lying molecular orientation on metallic substrates with an orientational transition from lying to standing (L → S) upon subsequent growth of DH6T.42,45 For our DH3T films on Au of low nominal coverage of χ = 1 nm (not shown) we find the onset of the emission from the highest occupied molecular orbital (HOMO) at 0.92 eV below the Fermi energy (EF) of the Au substrate. The work function of the Au substrate (φ) is decreased from φ = 5.51 eV to 4.39 eV upon initial growth; this change in φ is attributed to interfacial effects (e.g., the electron push-back effect).49,50 This translates into an IE of 5.31 eV, which we attribute to the IE of lying (L1) DH3T. For a coverage of 3 nm, however, φ increased again (by 0.14 eV), which is usually not observed for nonpolar molecules.51 In contrast, the HOMO-onset stays essentially constant, thus, the resulting increase in IE might be related to the net dipole-moment of DH3T and therefore to a still lying, but different molecular orientation (L2), now with a small different tilt of the molecular short axis.46 A further increase of the coverage to 7 nm left the vacuum-level essentially constant at 4.53 eV (χ = 3 nm) and 4.55 eV (χ = 7 nm). However, the HOMO significantly shifted toward EF by 0.28 eV, i.e., to lower binding energy, which corresponds to a decrease of IE to IE = 5.14 eV (Fig. 8a, red curves). This observation compares well to related reports for 6T and DH6T on a decrease of IE upon an orientational L → S transition and is, therefore, assigned to the IE of the standing (S) multilayer of DH3T on Au.42,45 This transition is further evidenced by our XPS results on the S(2p) core levels demonstrating the rigidness of the shift of all electronic levels (Fig. 8b, left). As expected for this purely electrostatic effect: The S(2p3/2) core level shifts from 163.9 eV (χ = 1 nm) to 163.6 eV (χ = 7 nm) to lower binding energy, i.e., by an essentially equal amount as the HOMO level.
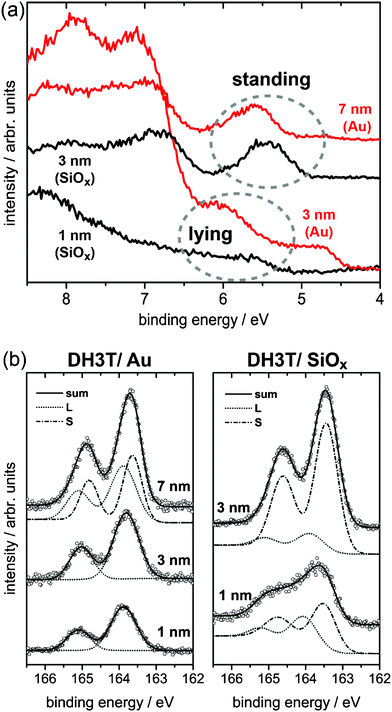 | ||
| Fig. 8 UPS (a) and XPS-S(2p) (b) results for DH3T thin films of different thickness prepared by physical vapour deposition on flame-annealed polycrystalline gold and SiOx substrates. The binding energy axis in UPS is given with respect to the vacuum level. For a schematic energy level diagram with all numerical values discussed in the text and for further XPS-C(1s) data on the same films see the ESI.† | ||
Most interestingly, for the films on SiOx we also found evidence for lying (L3) DH3T analogous to the case on Au. However, there, a non-expected shift of the vacuum-level is observed upon initial deposition of DH3T on SiOx. This points to a tilt of the molecular short axis already in the first contact layer to SiOx, however, with opposite sign as found for the L1 → L2 transition on Au. These UPS results on the submonolayer DH3T film (χ = 1 nm) provide an IE of 5.22 eV, which is significantly reduced to 4.91 eV for the 3 nm thick film (Fig. 8a, black curves), while φ now stays essentially constant at φ = 4.59 eV (χ = 1 nm) and φ = 4.53 eV (χ = 3 nm). Due to charge of the sample, spectra for still higher χ did not provide reliable results in both UPS and XPS. The presence of lying DH3T is further substantiated by the XPS results on the S2p core levels (Fig. 8b, right), where the observed superposition of two doublets is attributed to the presence of both lying (2p3/2: 164.1 eV) and standing (163.5 eV) DH3T in the 1 nm thick film. For the 3 nm thick film the S component dominates the spectrum, which therefore clearly confirms our assumption of a lying layer present below the ensuing standing DH3T portion on SiOx, as deduced from XRR. Altogether, from our PES experiments, the presence of a lying DH3T wetting layer of intact molecules and, further, a L → S orientational transition on SiOx is clearly evidenced. Moreover, from the observed shifts in the vacuum level we conclude that the molecules adopt an orientation in the initial lying DH3T layers in which the intrinsic intramolecular dipoles are not entirely compensated: While on Au we find an orientational transition L1 → L2 with ensuing vacuum level alignment upon L2 → S, initial DH3T growth on SiOx led to a decrease in φ demonstrating that the lying molecules (L3) do not compensate their dipoles; for schematic energy level diagrams and further XPS scans on the C(1s) core levels see the ESI.†
Discussion
The aim of the current study was to identify physical reasons for the formation of thin film polymorphs in organic thin-films and to assess the (meta)stability of such crystal structures. It is, by no means, a priori clear whether phases that occur exclusively in thin films are either metastable phases, as, for example, recently demonstrated for the PEN thin-film polymorph,52,53 or stable equilibrium phases. We aimed to answer this question by a defined variation of the crystallisation speed as a kinetic parameter providing on one hand conditions close to the thermodynamic equilibrium by slow crystallisation resulting in the stable crystal structure, and on the other hand conditions far away from thermodynamic equilibrium by a fast crystallisation process inducing metastable phases. Therefore, we carried out a comparative experimental study on the crystallisation process both from liquid and gas phase using spin coating, drop casting, dip coating and vacuum deposition as complementary preparation techniques. Solution processing allowed variation of the crystallisation speed through changing the volatilisation velocity of the solvent and permitted ultra-long crystallisation times. Likewise, vacuum deposition enabled thin-film preparation in a highly defined environment under precise control of film thickness and deposition rate.Our experimental results clearly show that, depending on the particular preparation techniques and parameters, DH3T forms on top of a SiO2 surface with three different crystallographic phases, which were clearly assigned by specular X-ray diffraction and denoted as thin-film, α- and β-phases of DH3T. The α-phase was found to be present in thin films prepared from solution both by drop casting and dip coating. Furthermore, this polymorph forms in the absence of a surface macroscopic single crystals allowing single crystal diffraction experiments to be made. A full structure-solution was carried out. Likewise, the β-phase of DH3T could be identified as crystal structure formed from the source material in solution: it occurs in films prepared both by drop casting and dip coating and is, in addition to the α-phase, present in polycrystalline DH3T powder. However, both the α- and the β-phase were absent in films prepared by physical vapour deposition and spin-coating, where only the thin-film phase was observed. This polymorph was also found, in addition to the α- and the β-phase, in films prepared by drop casting and dip coating with high crystallisation speed. Therefore, we showed that the thin-film phase appeared irrespective of the specific preparation technique in DH3T films, but highly depending on the crystallisation speed. The importance of a surface for the crystallisation of the thin film phase is reflected by the low mosaicity of the crystallites. GIXD experiments allowed determination of the unit-cell parameters of this phase and through crystallographic considerations we concluded that the thin-film phase crystallises, in analogy to the molecular arrangement in the α-phase, also in a herringbone structure (see Fig. 9 for the proposed molecular arrangement).
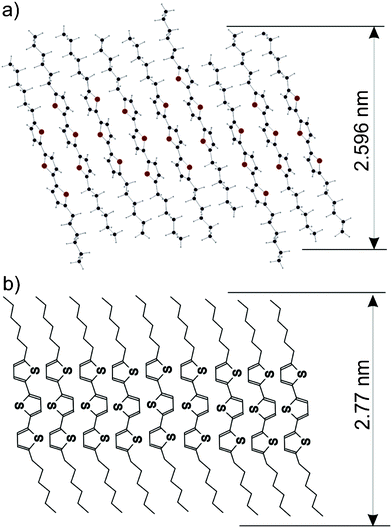 | ||
| Fig. 9 Packing of the DH3T molecules within the α-phase as obtained from the crystal structure solution (a) and the suggested molecular packing within the thin-film phase (b). For both cases the interplanar distances of the 002 planes are given. | ||
Our investigations on films prepared via drop casting and dip coating reveal that the evaporation time of the solvent plays a central role for the formation of polymorphic phases. For drop casting we found that, at high evaporation rates, the thin-film phase appears while, at low rates, the α- and the β-phases are preferentially formed. This correlation also stays exactly true if dip coating is performed: via a variation of the withdrawal velocity we showed that the thin-film phase is present at high withdrawal velocity (high evaporation rate), while, again, the α- and the β-phases dominate at low velocity (low evaporation rate). Furthermore, this is also in-line with the observed exclusive presence of the thin-film phase in the case of spin coating as processing technique with markedly high volatilisation rate of the solvent. Altogether, based on our experimental findings we conclude that the nucleation speed clearly is the decisive factor for thin-film phase formation, while the particular technique used for film preparation plays only a minor role: For all performed techniques the thin-film phase is generally formed at high crystallisation speed (high evaporation rate of the solvent), while, in contrast, the bulk structures are preferentially established at low crystallisation speed.
We rationalise this finding by the general dependence of polymorphism on molecular kinetics during the formation of a crystalline nuclei for crystal growth. The key processes, which describe molecular kinetics during nucleation, are orientational changes of individual molecules to find a suitable site with respect to neighbouring molecules. In this process one has to consider the characteristic time, which is needed by the molecules to form a stable nuclei. In general, nucleation in specific polymorphs is dominated both by interfacial energies and the particular energetic minimum of molecular packing. For the equilibrium crystal structure the change in chemical potential is largest, while, in contrast, metastable phases compensate a smaller gain in chemical potential by a smaller interfacial energy.54 However, once one nucleus is formed, the crystallite grows through molecules provided by translational movements of molecules along the surface, i.e., through addition of further molecules via surface diffusion.55,56
Our finding that the crystallisation speed is the critical parameter for the phase formation suggests that the thin-film phase is a kinetically driven metastable state. Moreover, the X-ray diffraction data reveal that the DH3T molecules pack more densely in the α- than in the thin-film phase. Since van der Waals forces determine the packing in molecular crystals we conclude that, on average, one molecule gains more energy by crystallisation in the α-phase than in the thin-film phase, which, however, can only occur if the nucleation time is sufficiently long. Therefore, we regard the α-phase to be closer to (or even equal to) the equilibrium crystal structure of DH3T, while, in contrast, the thin-film phase is a metastable polymorph. Note that thin film growth from gas phase is a non-equilibrium process. And in the present case, the thin-film phase is observed in films prepared by physical vapour deposition. Also in the case of PEN, the thin-film phase is concluded to be a metastable crystal state as confirmed by theoretical considerations.57
In line with the proposed metastability of the thin-film phase, specific boundary conditions are required for its formation. The outstanding quality of the crystallites, as deduced from our rocking curve investigation (see Fig. 6), reveals that a smooth surface needs to be present during the crystallisation process. In the present case, a wetting layer of lying DH3T molecules could be clearly evidenced by combining XRR with PES. Most interestingly, this layer is found to exhibit a certain degree of internal order, since the intramolecular dipoles present in the 3T backbone of DH3T are not randomly oriented and, therefore, do not fully compensate each other. During the formation of crystalline nuclei, the interaction between the thiophene units is dominant so that a herringbone arrangement is formed. The presence of a flat substrate surface finally causes the terminal ends of the molecules to form a flat plane towards the substrate (cf.Fig. 9b) and that the subsequent crystallisation process is only weakly disturbed by defects, so that extended crystallites with low mosaicity can be formed.
Conclusion
In this study we investigated the conditions for the formation of thin-film phases using the model molecule dihexyl-terthiophene by combining X-ray diffraction techniques with morphological and spectroscopic investigations. Via X-ray diffraction we found evidence for the existence of three different polymorphs of DH3T and correlated their occurrence with the specific thin film preparation parameters. For spin-coating, drop-casting, and dip-coating the thin-film phase is generally formed at high crystallisation speed, while, in contrast, the equilibrium bulk structure preferentially occurs at low crystallisation speed. We concluded that the thin-film phase is a metastable structure from two arguments: (i) it is present rather in thin films which are prepared far from the equilibrium and (ii) it is absent after thermal heat treatment of DH3T. The importance of a surface for the formation of the thin-film phase is concluded, since much lower mosaicity of the crystals is found for the thin-film phase than for the other two observed phases. In line with this finding, spin-coated and vacuum-deposited films exhibited a wetting layer of lying DH3T below the thin-film phase crystallites as determined by XRR. This finding was corroborated by UPS and XPS experiments, which also, in addition, provided evidence for a certain preferential orientation of the molecules within the wetting layer. Altogether, our study clearly demonstrates that rather crystallisation kinetics than the film thickness governs the occurrence of thin-film phases in organic semiconductor thin films.Experimental
Synthesis & material pre-characterisation
The source material dihexylterthiophene (DH3T) was synthesised following the route of Leroy et al.58 High purity was assessed by 1H-NMR and thin layer chromatography. Differential Scanning Calorimetry (DSC) investigations were performed using a DSC 2910 TA Instrument. A transition from the crystalline to a liquid crystalline state was observed at 51 °C and melting of the material was detected at 81 °C.59 After the DSC investigations the material was characterised by X-ray powder diffraction. A Siemens D501 diffractometer was used in conventional Bragg-Brentano geometry (Cu-Kα radiation) combined with a secondary graphite monochromator. A non-reflecting silicon single crystal was employed as substrate for the investigated powder to allow high resolution powder diffraction.Single crystal investigations
Three different series of single crystals were grown from toluene solutions. Single crystal diffraction was performed by a BRUKER APEX diffractometer using Mo-Kα radiation with a graphite monochromator. The size of the crystal was 0.58 × 0.37 × 0.07 mm3. The measurements were carried out in a temperature range between 100 K and 283 K. No phase transition was observed in this temperature range. A monoclinic crystal system was found with space group P21/n. At room temperature the unit cell dimensions are a = 2.33392(10) nm, b = 0.55790(3) nm, c = 5.1925(2) nm with a cell volume of 6.7191(6) nm3. The calculated density is 1.187 g cm−3 with Z = 12 molecules per unit cell. 42![[thin space (1/6-em)]](https://www.rsc.org/images/entities/char_2009.gif) 000 reflections were recorded and 12
000 reflections were recorded and 12![[thin space (1/6-em)]](https://www.rsc.org/images/entities/char_2009.gif) 889 independent reflections were taken for the refinement process. The structure was solved and refined with SHELXL-97 obtaining R = 0.060, wR = 0.1342 and a goodness of fit S = 1.013. The cif file of the crystal structure solution is provided as ESI to this paper.†
889 independent reflections were taken for the refinement process. The structure was solved and refined with SHELXL-97 obtaining R = 0.060, wR = 0.1342 and a goodness of fit S = 1.013. The cif file of the crystal structure solution is provided as ESI to this paper.†
Thin film preparation
The source material was dissolved in tetrahydrofuran (THF) at different concentrations up to 20 mg ml−1. Spin-coating was done in a flow box using a spin speed of 1000 rpm for 9 s followed by 1500 rpm for 30 s. The concentration of the solution c was varied between c = 0.05 mg ml−1 and 2.79 mg ml−1 to change the thickness of the resulting films. Drop-cast films were prepared from solution with c = 1 mg ml−1 using a drop volume of about 1 ml. After the deposition of the solution onto the substrate, the evaporation rate of the solvent was controlled by varying a protecting atmosphere of THF vapour. The total drying time of the deposited solution volume was varied between 2 min and 10 h. Dip-coated films were prepared from solution of c = 4 mg ml−1 using different substrate-withdrawal velocities of v = 50 μm s−1 and 500 μm s−1. Vacuum deposited films were prepared under ultra-high vacuum conditions (base pressure 5 × 10⁻⁹ mbar) with deposition rates up to 2 nm min−1; all films were prepared at room temperature. As substrates served 2 × 2 cm2 Si wafers with a top layer of ca. 120 nm thermally grown silicon oxide (p-doped Si with native oxide layer used as substrates for UPS/XPS investigation).Thin film characterisation methods
The morphology of the films was characterised by atomic force microscopy (AFM) and optical light microscopy. The AFM studies were performed with a Digital Instruments Multimode Nanoscope IIIa operated in tapping mode with a conventional silicon tip. Optical light microscopy was performed with an Olympus BX51 microscope under crossed polarisers using back reflection technique.The crystallographic structure of the films was investigated by X-ray diffraction (XRD). X-Ray reflectivity (XRR) and specular diffraction were performed on a BRUKER D8 DISCOVER diffractometer (Cu-Kα radiation) with a secondary graphite monochromator; conventional slit optics with 0.1° divergence slits was used. The XRR scans were fitted with a custom-made software package based on Parratt's formalism using stacks of single molecular layers with periodic electron density.20 The surface roughness of the organic films, as obtained from AFM investigations, was used as input parameter for the individual fits. Reciprocal space maps (RSM) were measured by grazing incidence X-ray diffraction (GIXD) at the beamline ID10B (ESRF, Grenoble, France) using a wavelength of 0.124 nm. Supporting RSM experiments and the rocking curve investigations were performed at the W1 beamline at HASYLAB (DESY, Hamburg, Germany) using a wavelength of 0.1181 nm. The incidence angle of the primary beam was optimized for maximum scattering intensity of the organic film. An angle slightly below the calculated critical angle of total external reflection of the substrate was obtained and used for the GIXD experiments. The intensity of the scattered beam was measured with a one-dimensional detector at fixed in-plane component of the scattering vector (qxy) and different out-of-plane components of the scattering vector (qz) along the detector dimension. The experimental data was converted into reciprocal space and indexed with the custom-made software PyGID.60
Photoelectron spectroscopy
Ultraviolet photoelectron spectroscopy (UPS) and X-ray photoelectron spectroscopy (XPS) experiments were performed at the endstation SurICat at the synchrotron light source BESSY II (Helmholtz Zentrum Berlin für Materialien und Energie, Germany) with energy resolutions of 120 meV (UPS) and 250 meV (XPS) using excitation photon energies of 35 eV (UPS) and 620 eV (XPS); the secondary electron cutoff was recorded at −10 V sample bias; the XPS energy scale was calibrated against the Au 4f core level. The ultrahigh vacuum (UHV) system consists of interconnected sample preparation/load lock (base pressure: 1 × 10⁻⁸ mbar) and analysis (base pressure: 1 × 10⁻¹⁰ mbar) chambers. The DH3T films were prepared by in situ vapour deposition from resistively heated pinhole sources on highly p-doped silicon substrates (native oxide layer) and on polycrystalline Au films (100 nm) prepared by sputtering on silicon substrates and subsequent ex situ flame annealing.Acknowledgements
We thank Jörg Albering, (Institute of Chemical Technology of Materials, Graz University of Technology) for the solution of the single crystal structure of DH3T. Financial support by the Austrian Science Foundation (FWF), project “Solution of Surface Induced Crystal Structures” (project no. P21094) is kindly acknowledged. NK and IS acknowledge funding by the DFG (Germany), SD by the JSPS (Japan). We thank the European Synchrotron Radiation Facility (ESRF) Grenoble for provision of synchrotron radiation, and J. Novak for experimental support in using at beamline ID10B. We thank W. Caliebe at beamline W1 (HASYLAB-DESY).References
- O. D. Jurchescu, D. A. Mourey, S. Subramanian, S. R. Parkin, B. M. Vogel, J. E. Anthony, T. N. Jackson and D. J. Gundlach, Phys. Rev. B: Condens. Matter Mater. Phys., 2009, 80, 085201 CrossRef.
- K. Hummer and C. Ambrosch-Draxl, Phys. Rev. B: Condens. Matter Mater. Phys., 2005, 72, 205205 CrossRef.
- A. Troisi and G. Orlandi, J. Phys. Chem. B, 2005, 109, 1849 CrossRef CAS.
- C. Ambrosch-Draxl, D. Nabok, P. Puschnig and C. Meisenbichler, New J. Phys., 2009, 11, 125010 CrossRef.
- D. M. DeLongchamp, B. M. Vogel, Y. Jung, M. C. Gurau, C. A. Richter, O. A. Kirillov, J. Obrzut, D. A. Fischer, S. Sambasivan, L. J. Richter and E. K. Lin, Chem. Mater., 2005, 17, 5610 CrossRef CAS.
- X. L. Xiao, Z. B. Wang, Z. J. Hu and T. He, J. Phys. Chem. B, 2010, 114, 7452 CrossRef CAS.
- M. Rajeswaran, T. N. Blanton, C. W. Tang, W. C. Lenhart, S. C. Switalski, D. J. Giesen, B. J. Antalek, T. D. Pawlik, D. Y. Kondakov, N. Zumbulyadis and R. H. Young, Tetrahedron, 2009, 28, 835 CAS.
- J. Bernstein, Polymorphism in Molecular Crystals, Clarendon Press, Oxford, 2002 Search PubMed.
- C. C. Mattheus, A. B. Dros, J. Baas, A. Meetsma, J. L. de Boer and T. T. M. Palstra, Acta Crystallogr., Sect. C: Cryst. Struct. Commun., 2001, 57, 939 CrossRef CAS.
- H. Yoshida, K. Inaba and N. Sato, Appl. Phys. Lett., 2007, 90, 181930 CrossRef.
- D. Nabok, P. Puschnig, C. Ambrosch-Draxl, O. Werzer, R. Resel and D. -M. Smilgies, Phys. Rev. B: Condens. Matter Mater. Phys., 2007, 76, 235322 CrossRef.
- S. Schiefer, M. Huth, A. Dobrinevski and B. Nickel, J. Am. Chem. Soc., 2007, 129, 10316 CrossRef CAS.
- A. Moser, O. Werzer, H. G. Flesch, M. Koini, D. -M. Smilgies, D. Nabok, P. Puschnig, C. Ambrosch-Draxl, M. Schiek, H. -G. Rubahn and R. Resel, Eur. Phys. J., 2009, 167, 59 Search PubMed.
- I. Salzmann, S. Duhm, G. Heimel, J. P. Rabe, N. Koch, M. Oehzelt, Y. Sakamoto and T. Suzuki, Langmuir, 2008, 24, 7294 CrossRef CAS.
- I. Salzmann, D. Nabok, M. Oehzelt, S. Duhm, A. Moser, G. Heimel, P. Puschnig, C. Ambrosch-Draxl, J. P. Rabe and N. Koch, Cryst. Growth Des., 2011, 11, 600 CAS.
- K. Sato, J. Phys. D: Appl. Phys., 1993, 26, B77 CrossRef CAS.
- A. C. Mayer, A. Kazimirov and G. G. Malliaras, Phys. Rev. Lett., 2006, 97, 105503 CrossRef.
- C. D. Dimitrokopoulos, A. R. Brown and A. Pomp, J. Appl. Phys., 1996, 80, 2501 CrossRef.
- S. Kowarik, A. Gerlach, W. Leitenberger, J. Hua, G. Witte, C. Wöll, U. Pietsch and F. Schreiber, Thin Solid Films, 2007, 515, 5606 CrossRef CAS.
- O. Werzer, B. Stadlober, A. Haase, M. Oehzelt and R. Resel, Eur. Phys. J. B, 2008, 66, 455 CrossRef CAS.
- T. Kakudate and N. Yoshimoto, Appl. Phys. Lett., 2007, 90, 081903 CrossRef.
- I. P. M. Bouchoms, W. A. Schoonveld, J. Vrijmoeth and T. M. Klapwijk, Synth. Met., 1999, 104, 175 CrossRef CAS.
- D. Knipp, R. A. Street, A. Völkel and J. Ho, J. Appl. Phys., 2003, 93, 347 CrossRef CAS.
- R. Ruiz, D. Choudhary, B. Nickel, T. Toccoli, K.-C. Chang, A. C. Mayer, P. Clancy, J. M. Blakely, R. L. Headrick, S. Iannotta and G. G. Malliaras, Chem. Mater., 2004, 16, 4497 CrossRef CAS.
- H. Muguruma, T. K. Saito and S. Hotta, Thin Solid Films, 2003, 445, 26 CrossRef CAS.
- M. Yoneya, M. Kawasaki and M. Andob, J. Mater. Chem., 2010, 20, 10397 RSC.
- O. Werzer, A. Haase, B. Stadlober, H. -G. Flesch and R. Resel, Eur. Phys. J.: Appl. Phys., 2009, 46, 20403 CrossRef.
- G. Horowitz, Adv. Mater., 1998, 10, 365 CrossRef CAS.
- D. Fichou, Handbook of Oligo- and Polythiophenes, Wiley-VCH, Weinheim, 1999 Search PubMed.
- F. Van Bolhuis, H. Wynberg, E. E. Havinga, E. W. Meijer and E. G. J. Staring, Synth. Met., 1989, 30, 381 CrossRef CAS.
- T. Schimmel, B. Winzer, R. Kemnitzer, T. Koch, J. Küppers and M. Schwörer, Adv. Mater., 1994, 6, 307 CrossRef CAS.
- M. Campione, A. Sassella, M. Moret, A. Papagni, S. Trabattoni, R. Resel, O. Lengyel, V. Marcon and G. Raos, J. Am. Chem. Soc., 2006, 128, 13378 CrossRef CAS.
- J. O. Vogel, I. Salzmann, S. Duhm, M. Oehzelt, J. P. Rabe and N. Koch, J. Mater. Chem., 2010, 20, 4055 RSC.
- P. Frank, G. Hlawacek, O. Lengyel, A. Satka, C. Teichert, R. Resel and A. Winkler, Surf. Sci., 2007, 601, 2152 CrossRef CAS.
- P. Frank, G. Hernandez-Sosa, H. Sitter and A. Winkler, Thin Solid Films, 2008, 516, 2939 CrossRef CAS.
- E. Bauer, Z. Kristallogr., 1958, 110, 372 CrossRef.
- G. R. Desiraju and A. Gavezotti, Acta Crystallogr., Sect. B: Struct. Sci., 1989, 45, 473 CrossRef.
- T. Siegrist, C. Kloc, R. A. Laudise, H. E. Katz and R. C. Haddon, Adv. Mater., 1998, 10, 379 CrossRef CAS.
- M. Moret, M. Campione, A. Borghesi, L. Miozzo, A. Sassella, S. Trabattoni, B. Lotz and A. Thierry, J. Mater. Chem., 2005, 15, 2444 RSC.
- B. Servet, S. Ries, M. Trotel, P. Alnot, G. Horowitz and F. Garnier, Adv. Mater., 1993, 5, 461 CrossRef CAS.
- F. Garnier, A. Yassar, R. Hajlaoui, G. Horowitz, F. Deloffre, B. Servet, S. Ries and P. Alnot, J. Am. Chem. Soc., 1993, 115, 8716 CrossRef CAS.
- S. Duhm, I. Salzmann, N. Koch, H. Fukagawa, T. Kataoka, S. Hosoumi, K. Nebashi, S. Kera and N. Ueno, J. Appl. Phys., 2008, 104, 033717 CrossRef.
- S. G. J. Mathijssen, E. C. P. Smits, P. A. van Hal, H. J. Wondergem, S. A. Ponomarenko, A. Moser, R. Resel, P. A. Bobbert, M. Kemerink, R. A. Janssen and D. M. de Leeuw, Nat. Nanotechnol., 2009, 4, 674 CrossRef CAS.
- M. Birkholz, Thin Film Analysis by X-ray Scattering, Wiley-VCH, Weinheim, 2006 Search PubMed.
- S. Duhm, G. Heimel, I. Salzmann, H. Glowatzki, R. L. Johnson, A. Vollmer, J. P. Rabe and N. Koch, Nat. Mater., 2008, 7, 326 CrossRef CAS.
- S. Duhm, S. Hosoumi, I. Salzmann, A. Gerlach, M. Oehzelt, B. Wedl, T. L. Lee, F. Schreiber, N. Koch, N. Ueno and S. Kera, Phys. Rev. B: Condens. Matter Mater. Phys., 2010, 81, 045418 CrossRef.
- G. Heimel, I. Salzmann, S. Duhm and N. Koch, Chem. Mater., 2011, 23, 359 CrossRef CAS.
- H. Fukagawa, H. Yamane, S. Kera, K. K. Okudaira and N. Ueno, Phys. Rev. B: Condens. Matter Mater. Phys., 2006, 73, 041302 CrossRef.
- H. Ishii, K. Sugiyama, E. Ito and K. Seki, Adv. Mater., 1999, 11, 605 CrossRef CAS.
- A. Kahn, N. Koch and W. Y. Gao, J. Polym. Sci., Part B: Polym. Phys., 2003, 41, 2529 CrossRef CAS.
- N. Koch, J. Phys.: Condens. Matter, 2008, 20, 184008 CrossRef.
- R. G. Della Valle, E. Venuti, A. Brillante and A. Girlando, ChemPhysChem, 2009, 10, 1783 CrossRef CAS.
- A. Moser, J. Novak, H. -G. Flesch, T. Djuric, O. Werzer, A. Haase and R. Resel, Appl. Phys. Lett., 2011, 99, 221911 CrossRef.
- K. Sangwal, J. Cryst. Growth, 1989, 97, 393 CrossRef CAS.
- P. Jensen, Rev. Mod. Phys., 1999, 71, 1695 CrossRef CAS.
- B. Stadlober, U. Haas, H. Maresch and A. Haase, Phys. Rev. B: Condens. Matter Mater. Phys., 2006, 74, 165302 CrossRef.
- R. G. Della Valle, E. Venuti, A. Brillante and A. Girlando, ChemPhysChem, 2009, 10, 1783 CrossRef CAS.
- J. Leroy, J. Levin, S. Sergeyev and Y. Geerts, Chem. Lett., 2006, 35, 166 CrossRef CAS.
- N. Boucher, J. Leroy, S. Sergeyev, E. Pouzet, V. Lemaur, R. Lazzaroni, J. Cornil, Y. Geerts and M. Sferrazza, Synth. Met., 2009, 159, 1319 CrossRef CAS.
- A. Moser, PyGID - A software for the Analysis of Grazing Incidence X-ray diffraction Data, unpublished.
Footnote |
| † Electronic supplementary information (ESI) available: X-Ray powder diffraction of polycrystalline powder; AFM micrographs for films prepared by physical vapour deposition; X-ray diffraction pole figures of a dip-coated film; XPS C1s data for DH3T on SiOx and Au and the corresponding schematic energy level diagrams for all PES investigations. CCDC reference number 848505, α-phase of the molecule dihexylterthiophene. For ESI and crystallographic data in CIF or other electronic format see DOI: 10.1039/c2ra20272g |
| This journal is © The Royal Society of Chemistry 2012 |
