Predominant nanoice growth in single-walled carbon nanotubes by water-vapor loading†
Tomonori
Ohba
*a,
Sei-ichi
Taira
a,
Kenji
Hata
b,
Katsumi
Kaneko
c and
Hirofumi
Kanoh
a
aGraduate School of Science, Chiba University, 1-33 Yayoi, Inage, Chiba 263-8522, Japan. E-mail: ohba@pchem2.s.chiba-u.ac.jp
bCenter for Advanced Carbon Materials, National Institute of Advanced Industrial Science and Technology, Tsukuba, 305-8565, Japan
cResearch Center for Exotic Nanocarbons, Shinsyu Univiersity, 4-17-1 Wakasato, Nagano, 380-8553, Japan
First published on 5th March 2012
Abstract
Water in single-walled carbon nanotubes was found to form nanosized ice-like structures (nanoice) above a water density of 0.5 g mL−1 in SWCNTs, but nanosized liquid water-like structures (nanowater) formed below that density, i.e., nanoice grows predominantly from nanowater at a low water density of around 0.5 g mL−1 and room temperature.
Water has unique properties in terms of density, diffusivity, dielectric constant, and viscosity because of its intermolecular hydrogen-bonds. An understanding of these unique properties is particularly important for the development of water chemistry,1–6 and extensive experimental and computational researches have been carried out. Water has been reported to exist as low-density and high-density water, with different densities and microscopic structures.7–12 These two forms occur as a result of water-cluster formation through hydrogen bonding. The formation and stability of water clusters are therefore dominant factors in the structures of liquid water and ice.13–16
Nanoconfined water is also important because chemical reactions in nanotechnologies and biological transportation of water take place at water–solid interfaces. Hence, these studies have been carried out on the mechanism of water-vapor adsorption on nanoporous carbon and zeolites, and on the structure of the adsorbed water, which is different from that of bulk water.17–29 Unique phenomena have been observed for water adsorbed in two-dimensional nanopores: predominant nanocluster formation, depression of the freezing point, and significant adsorption hysteresis.30–35 Such phenomena are also expected in single-walled carbon nanotubes (SWCNTs), which provide well-defined one-dimensional nanopores for water molecules. Recently, water confined in SWCNTs was found to assume a unique structure. Koga et al. carried out molecular dynamics simulations and showed that ice in a SWCNT undergoes ring formation under extremely high pressure conditions.36 The X-ray diffraction (XRD) studies on water structure in SWCNTs showed that water in SWCNTs is converted to polygonal ice below the freezing temperature, reported by Maniwa et al.37,38 SWCNTs have two effects on confined water: a restricted geometry and nanopore interactions. As a result, the confined water shows unique properties. Unusual ring structures are the result of hydrogen bonding of water in highly restricted nanopores rather than of water–nanopore interactions. The intermolecular interactions between water molecules are dominant in water interactions.16 IR spectroscopic analysis of water confined in SWCNTs by Byl et al. showed an anomalous stretching frequency, which is attributed to strained hydrogen-bonding between water molecules at room temperature.39 However, our understanding of the water structure at a molecular level is still far from complete, and the existence of high- and low-density water in nanopores is not clearly understood. Density-dependent water structures should therefore be investigated in detail to provide a better understanding of the molecular behavior of water in nanopores. In this paper, we investigate water-assembly structures in nanopores of SWCNT at 303 K by synchrotron XRD for different water densities.
The adsorbed-water density d was evaluated from the N2 adsorption isotherm at 77 K and the water-vapor adsorption isotherm at 303 K, as shown in Fig. S1 and S2.† Here, the nanopore volume of the SWCNTs was 0.69 mL g−1 (evaluated by αS analysis of the N2 adsorption isotherm). Water vapor was hardly adsorbed at relative pressures P/P0 of less than 0.6 (d < 0.2 g mL−1) but was predominantly adsorbed at P/P0 > 0.7 (0.4 g mL−1 < d < 0.8 g mL−1), and it filled the SWCNTs at P/P0 ≈ 1.0. In the desorption stage, a gradual decrease above P/P0 = 0.6 and intensive desorption just below P/P0 = 0.6 were observed, accompanied by significant adsorption hysteresis. We chose the adsorption stage for evaluating the adsorbed water structure in SWCNTs because d can be controlled precisely by controlling the vapor pressure.
SWCNTs were synthesized by the super-growth method; such SWCNTs have an extremely longer nanotube length and wider nanopores than typical SWCNTs, and furthermore, do not contain metal-catalyst impurities.40,41 As the SWCNTs rarely form bundles, water-vapor is dominantly adsorbed in the internal nanopores. Hence, the SWCNTs are considered ideal candidates for investigating water structures in SWCNTs. Adsorption isotherms for water-vapor adsorption in SWCNTs were measured at 303 K after preheating the SWCNTs at 423 K and 0.1 Pa for more than 2 h. The equilibrium adsorption amount was measured after more than 12 h, when the pressure change was less than 10 Pa h−1. The SWCNTs were placed in an XRD capillary tube, and water-vapor at controlled vapor pressures was introduced into the tube at 303 K. The d values of 0.2, 0.4, 0.5, 0.8, and 1.0 g mL−1 corresponded to water-vapor pressures of 2.8, 3.0, 3.1, 3.5, and 3.8 kPa, respectively, in the adsorption isotherm. Dry SWCNTs, for which d is zero, were also prepared for reference. In situ XRD measurements of water-vapor adsorbed in the SWCNTs at 303 K were performed at Spring-8, at a wavelength of 0.1000 nm and an accumulation time of 0.5 h for all the d values mentioned above.
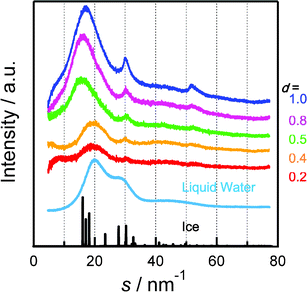
Fig. 1 shows the difference XRD patterns for SWCNTs with adsorbed water (d = 0.2, 0.4, 0.5, 0.8, and 1.0) and dry SWCNTs (the raw XRD patterns are shown in Fig. S3†). The scattering intensities were normalized to the adsorption of water vapor in a SWCNT. These patterns were attributed to the scattering amounts between the water molecules and between a water molecule and a carbon atom of a SWCNT. There are three distinct peaks at the scattering parameters s = 16–20, 30, and 52 nm−1, where s = 4πsinθ/λ, and λ is the X-ray wavelength. In contrast, the XRD pattern of liquid water has two peaks at s = 20 and 30 nm−1. The first peak of adsorbed water at s = 16–20 nm−1 results from the distance between water molecules. The second and third peaks, at s = 30 and 52 nm−1, are the result of the regular water structure formed by hydrogen bonding. The first peak positions were 16 nm−1 for d = 0.6–1.0 g mL−1 and 20 nm−1 for d = 0.2–0.4 g mL−1 and bulk liquid water. The main peak of bulk ice is at 16 nm−1. Thus, water adsorbed in SWCNTs has an ice-like structure at d = 0.6–1.0 g mL−1 even at room temperature, but a liquid water-like structure for d < 0.4 g mL−1.
 | ||
| Fig. 1 Difference XRD patterns for water-vapor adsorbed SWCNTs at d = 0.2, 0.5, 0.8, and 1.0 g mL−1, and dry SWCNTs. XRD patterns of bulk liquid water and ice are shown for reference. Scattering intensities are represented in arbitrary units for liquid water and ice. | ||
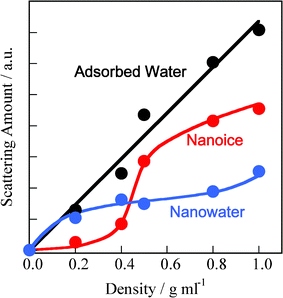
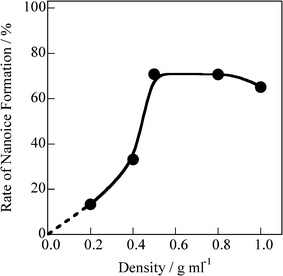
The first peak positions for bulk ice and liquid water correspond to the intermolecular distances of water: 0.28 and 0.30 nm, respectively. Hence, the first peak for the adsorbed water could be fitted by two peaks at s = 16 and 20 nm−1 resulting from nanosized ice (nanoice) and liquid water (nanowater), respectively (see Supporting Information† for fitting curves). The unit sizes of the nanoice and nanowater are 0.8 nm (evaluated from the Scherrer equation). The integral XRD intensities for nanoice and nanowater and that of the original XRD pattern indicate the scattering amounts of the nanoice and nanowater components and of adsorbed water in the SWCNTs, respectively. Fig. 2 shows the changes in nanoice and nanowater scattering amounts for different water densities in the SWCNTs; the scattering amount indicates the abundance of the component. This is confirmed by the linear increase in scattering with increasing water density. Nanoice was hardly formed at d < 0.4 g mL−1, but increased sharply at higher densities. In contrast, nanowater was observed at a low water density, but the amount was maintained in spite of increasing water density. Therefore, water is in the liquid phase even below d = 0.4 g mL−1 and then, predominant nanoice growth was observed at d = 0.4 g mL−1. A significant amount of nanoice was formed in the SWCNTs above the density, despite water being in the vapor phase at this temperature and pressure. The nanoice formation rate was evaluated from the abundance of nanoice against adsorbed water, as shown in Fig. 3. This rate increased linearly up to d = 0.4 g mL−1, and then sharply at d = 0.5 g mL−1 to over 70%. Thus, the significant transformation between the nanoice- and nanowater-dominant phases occurred at d = 0.4–0.5 g mL−1. Predominant water-vapor adsorption was also observed at these water densities, as seen in Fig. S2.† Hence, predominant water-vapor adsorption is associated with predominant nanoice growth in the SWCNTs; this is explained by a self-stabilized mechanism of water adsorption in two-dimensional nanospaces by nanocluster formation.16
 | ||
| Fig. 2 Abundances of nanoice and nanowater in SWCNTs as a function of the density of adsorbed water. | ||
 | ||
| Fig. 3 Rate change of nanoice formation in SWCNTs as a function of the density of adsorbed water. | ||
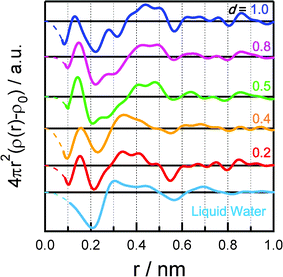
The conformation of adsorbed water in the SWCNTs was obtained from the electron–electron radial distribution functions calculated by Fourier transforms of the difference patterns (Fig. 4). Three peaks, at 0.30, 0.45, and 0.70 nm, were observed for bulk liquid water, and were assigned to the distances between a water molecule and its first-, second-, and third-nearest neighbors, respectively. For water in SWCNTs, distinct peaks appeared at 0.13–0.15, 0.4 (including some peaks at 0.28–0.50 nm), 0.65, 0.75, and 0.86 nm. The significant broad peaks at 0.28–0.50 nm were assigned to the intermolecular distances in nanoice or nanowater. The intermolecular distances for d = 0.2 and 0.4 g mL−1 were 0.35 nm, somewhat longer than those in bulk liquid water, although the shapes in the radial distribution functions were similar to that of the bulk liquid water. The broad peak was split into several peaks for d = 0.5–1.0 g mL−1; the peaks were at 0.4–0.5 nm, and another peak emerged at 0.28 nm with increasing water density. The peaks at 0.28 nm agree with the intermolecular distance in ice. The peaks at 0.4–0.5 nm were also assigned by assuming an ice-like structure in the SWCNTs. The peaks at 0.65, 0.75, and 0.86 nm were similar to each other for all water densities. Structural differences between nanoice and nanowater were observed at 0.2–0.56 nm: nanoice was observed above 0.5 g mL−1, but nanowater below 0.4 g mL−1. Therefore, the average nanoice size is 0.56 nm, corresponding to a hexamer to a decamer. The peak at 0.13–0.15 nm was observed for water in SWCNTs for all water densities except bulk liquid water. However, it is impossible to assign the intermolecular distances of water except for the intermolecular OH distance. This distance is too short for the OH distance in bulk liquid water, so the H atom might be shared between two O atoms in SWCNTs. Further studies on the conformation of the H atoms by neutron diffraction and IR and NMR spectroscopy are necessary for a better understanding of the water structure.
 | ||
| Fig. 4 Electron–electron radial distribution functions of water adsorbed in SWCNTs at d= 0.2, 0.4, 0.5, 0.8, and 1.0 g mL−1. The radial distribution function of liquid water is shown for comparison. | ||
Conclusions
We have demonstrated the water structure in SWCNTs for d = 0.2–1.0 g mL−1. Distinct XRD peaks of the adsorbed water were observed simply by introducing water-vapor. The intermolecular distance at s = 16 nm−1 for d ≥ 0.5 g mL−1 is considerably longer than that in bulk liquid water, suggesting nanoice formation in SWCNTs even at room temperature. The electron–electron radial distribution functions also indicated nanoice formation at d > 0.5 g mL−1. Therefore, the predominant structure of water in SWCNTs changed from nanowater to nanoice at d values over 0.5 g mL−1. The predominance of nanoice growth at room temperature may be an important point in the development of nanochemistry in aqueous conditions and for a basic understanding of nanowater properties. Further studies are required on the structure dependence of water adsorbed in nanopores on nanotube size and temperature.Acknowledgements
We thank Dr J. Kim and N. Tsuji for their help in recording the XRD data at Spring-8. TEM observations were conducted at the Chemical Analysis Center, Chiba University. This research was supported by a Research Fellowship from the Foundation of the Promotion of Ion Engineering, Kurata Memorial Hitachi Science and Technology Foundation, Nippon Sheet Glass Foundation, Global COE program, MEXT, Japan, and a Grant-in-Aid for Scientific Research (No. 21241026 and 23350072) by the Japan Society for the Promotion of Science as well as the JSPS Program “Strategic Young Researcher Overseas Visits Program for Accelerating Brain Circulation”.References
- H. J. Bakker and J. L. Skinner, Chem. Rev., 2010, 110, 1498–1517 CrossRef CAS.
- D. Laage and J. T. Hynes, J. Phys. Chem. B, 2008, 112, 14230–14242 CrossRef CAS.
- T. Tokushima, Y. Harada, O. Takahashi, Y. Senda, H. Ohashi, L. G. M. Pettersson, A. Nilsson and S. Shin, Chem. Phys. Lett., 2008, 460, 387–400 CrossRef CAS.
- F. Paesanl and G. A. Voth, J. Phys. Chem. B, 2009, 113, 5702–5719 CrossRef.
- C. Vega, J. L. F. Abascal, M. M. Conde and J. L. Aragones, Faraday Discuss., 2009, 141, 251–276 RSC.
- I.-C. Lin, A. P. Seitsonen, M. D. Coutinho-Neto, I. Tavernelli and U. Rothlisberger, J. Phys. Chem. B, 2009, 113, 1127–1131 CrossRef CAS.
- M. Matsumoto, S. Saito and I. Ohmine, Nature, 2002, 416, 409–413 CrossRef CAS.
- T. Head-Gordon and G. Hura, Chem. Rev., 2002, 102, 2651–2670 CrossRef CAS.
- A. Bizid, L. Bosio, A. Defrain and M. Oumezzine, J. Chem. Phys., 1987, 87, 2225–2230 CrossRef CAS.
- M.-C. Bellissent-Funel, J. Teixeira and L. Bosio, J. Chem. Phys., 1987, 87, 2231–2235 CrossRef CAS.
- A. K. Soper and M. A. Ricci, Phys. Rev. Lett., 2000, 84, 2881 CrossRef CAS.
- C. Huang, K. T. Wikfeldt, T. Tokushima, D. Nordlund, Y. Harada, U. Bergmann, M. Niebuhr, T. M. Weiss, Y. Horikawa, M. Leetmaa, M. P. Ljungberg, O. Takahashi, A. Lenz, L. Ojamäe, A. P. Lyubartsev, S. Shin, L. G. M. Pettersson and A. Nilsson, Proc. Natl. Acad. Sci. U. S. A., 2009, 106, 15214–15218 CrossRef CAS.
- H. M. Lee, S. B. Suh, J. Y. Lee, P. Tarakeshwar and K. S. Kim, J. Chem. Phys., 2000, 112, 9759 CrossRef CAS.
- J. M. Headrick, E. G. Diken, R. S. Walters, N. I. Hammer, R. A. Christie, J. Cui, E. M. Myshakin, M. A. Duncan, M. A. Johnson and K. D. Jordan, Science, 2005, 308, 1765–1769 CrossRef CAS.
- S. Maheshwary, N. Patel, N. Sathyamurthy, A. D. Kulkarni and S. R. Gadre, J. Phys. Chem. A, 2001, 105, 10525–10537 CrossRef CAS.
- T. Ohba, H. Kanoh and K. Kaneko, J. Am. Chem. Soc., 2004, 126, 1560–1562 CrossRef CAS.
- T. Werder, J. H. Walther, R. L. Jaffe, T. Halicioglu and P. Koumoutsakos, J. Phys. Chem. B, 2003, 107, 1345–1352 CrossRef CAS.
- A. P. Terzyk, P. A. Gauden and G. Rychlicki, Colloids Surf., A, 1999, 148, 271–281 CrossRef CAS.
- L. Cossarutto, T. Zimny, J. Kaczmarczyk, T. Siemieniewska, J. Bimer and J. V. Weber, Carbon, 2001, 39, 2339–2346 CrossRef CAS.
- N. Desbiens, I. Demachy, A. H. Fuchs, H. Kirsch-Rodeschini, M. Soulard and J. Patarin, Angew. Chem., Int. Ed., 2005, 44, 5310–5313 CrossRef CAS.
- A. M. Slasli, M. Jorge, F. Stoeckli and N. A. Seaton, Carbon, 2003, 41, 479–486 CrossRef CAS.
- M.-C. Bellissent-Funel, R. Sridi-Dorbez and L. Bosio, J. Chem. Phys., 1996, 104, 10023 CrossRef.
- C. Beauvais, A. Boutin and A. H. Fuchs, ChemPhysChem, 2004, 5, 1791–1793 CrossRef CAS.
- I. I. Salame and T. J. Bandosz, Langmuir, 1999, 15, 587–593 CrossRef CAS.
- N. Naguib, H. Ye, Y. Gogotsi, A. G. Yazicioglu, C. M. Megaridis and M. Yoshimura, Nano Lett., 2004, 4, 2237–2243 CrossRef CAS.
- A. Striolo, Nano Lett., 2006, 6, 633–639 CrossRef CAS.
- G. Cicero, J. C. Grossman, E. Schwegler, F. Gygi and G. Galli, J. Am. Chem. Soc., 2008, 130, 1871–1878 CrossRef CAS.
- S. Joseph and N. R. Aluru, Nano Lett., 2008, 8, 452–458 CrossRef CAS.
- A. Alexiadis and S. Kassinos, Chem. Rev., 2008, 108, 5014–5034 CrossRef CAS.
- A. Striolo, K. E. Gubbins, M. S. Gruszkiewicz, D. R. Cole, J. M. Simonson, A. A. Chialvo, P. T. Cummings, T. D. Burchell and K. L. More, Langmuir, 2005, 21, 9457–9467 CrossRef CAS.
- T. Ohba and K. Kaneko, J. Phys. Chem. C, 2007, 111, 6207–6214 CAS.
- J.-C. Liu and P. A. Monson, Ind. Eng. Chem. Res., 2006, 45, 5649–5656 CrossRef CAS.
- D. D. Do and H. D. Do, Carbon, 2000, 38, 767–773 CrossRef CAS.
- J. C. Dore, M.-C. Bellissent-Funel, A. Burian, H. P. Castricum, J. Jelassi, K. Kaneko, T. Ohba, H. Tanaka and J. B. W. Webber, J. Phys.: Conf. Ser., 2009, 177, 012010 CrossRef.
- T. Ohba, H. Kanoh and K. Kaneko, Chem.–Eur. J., 2005, 11, 4890–4894 CrossRef CAS.
- K. Koga, G. T. Gao, H. Tanaka and X. C. Zeng, Nature, 2001, 412, 802–805 CrossRef CAS.
- Y. Maniwa, H. Kataura, M. Abe, A. Udaka, S. Suzuki, Y. Achiba, H. Kira, K. Matsuda, H. Kadowaki and Y. Okabe, Chem. Phys. Lett., 2005, 401, 534–538 CrossRef CAS.
- H. Kyakuno, K. Matsuda, H. Yahiro, Y. Inami, T. Fukuoka, Y. Miyata, K. Yanagi, Y. Maniwa, H. Kataura, T. Saito, M. Yumura and S. Iijima, J. Chem. Phys., 2011, 134, 244501 CrossRef.
- O. Byl, J.-C. Liu, Y. Wang, W.-L. Yim, J. K. Johnson and J. T. J. Yates Jr., J. Am. Chem. Soc., 2006, 128, 12090–12097 CrossRef CAS.
- K. Hata, D. N. Futaba, K. Mizuno, T. Namai, M. Yumura and S. Iijima, Science, 2004, 306, 1362–1364 CrossRef CAS.
- T. Ohba, T. Matsumura, K. Hata, M. Yumura, S. Iijima, H. Kanoh and K. Kaneko, J. Phys. Chem. C, 2007, 111, 15660–15663 CAS.
Footnote |
| † Electronic Supplementary Information (ESI) available: the N2 adsorption isotherm on SWCNT at 77 K, water-vapor adsorption isotherm at 303 K, XRD patterns of adsorbed water and transmission electron microscopy. See DOI: 10.1039/c2ra20290e/ |
| This journal is © The Royal Society of Chemistry 2012 |
