DFT and DRIFTS studies of the oxidative carbonylation of methanol over γ-Cu2Cl(OH)3: the influence of Cl†
Qingsen
Meng
,
Zengzhu
Wang
,
Yongli
Shen
,
Bing
Yan
,
Shengping
Wang
and
Xinbin
Ma
*
Key Laboratory for Green Chemical Technology of Ministry of Education, School of Chemical Engineering and Technology, Tianjin University, Tianjin, 300072, China. E-mail: xbma@tju.edu.cn; Fax: +86-22-87401818
First published on 20th July 2012
Abstract
This paper describes a detailed fundamental study regarding the influence of Cl species in γ-Cu(OH)3Cl catalyzed oxidative carbonylation of methanol employing density functional theory (DFT) calculations as well as in situ diffuse reflectance infrared fourier transform spectroscopy (DRIFTS) experiments. The methanol was found positioned with the H atom towards the Cl atom—which in the first layer of the γ-Cu2Cl(OH)3(021) surface—in a close a-top position with a hydrogen bond between them at all adsorption sites; while the Cl atom plays a key role in the pre-reaction for H–O bond activation. The methoxide, which was formed through a substitution reaction, adsorbed on the surface through two O–Cu bonds; while the formed HCl weakly adsorbed on the surface and can easily escape from the surface. One new intermediate product was found during the calculation of minimum energy path (MEP), which connects the adsorbed methanol and coadsorbed methoxide and HCl, and its existence was confirmed through in situ DRIFTS experiments. During the reaction, the Cl atom escaped from the surface and bonded with the methanol first (forming CH3OH⋯Cl) and then reacted with the methanol to form adsorbed methoxide and HCl. The existence of Cl seriously decreased the energy cost for methanol oxidation to methoxide.
1. Introduction
Dimethyl carbonate (DMC) is a potential fuel additive to replace methyl tert-butyl ether (MTBE), and a precursor for synthesis of carbonic acids and derivatives. It can also be used as a methylating agent to replace methyl halides and dimethyl sulfate, and as an intermediate for the synthesis of polycarbonates and isocyanates.1–4 Wacker-type catalysts (CuCl2–PdCl2) are known to be active catalysts for gas-phase oxidative carbonylation of methanol to DMC (2CH3OH + CO + 1/2O2 → (CH3O)2CO + H2O).4–14 Particularly, copper oxychloride (Cu2Cl(OH)3) formed in the preparation of Wacker-type catalysts can increase the activity and thus is recognized as the active component.4–9,12 However, the formed Cu2Cl(OH)3 is in a polycrystalline form, thus determination of the influence of crystal facet on catalytic reactivity is a challenge.8,15–17Meanwhile, based on the previous experimental reports, the presence of chlorine seems essential for designing a catalyst with high activity for methanol oxidative carbonylation.4,7,13,18 The activated carbon (AC)-supported CuCl2 catalyst showed high methanol conversion with DMC selectivity of 80%–90%,7,19 and the catalytic activity was improved by the addition of palladium chloride or potassium acetate.5,20 But the chloride-containing catalysts (e.g., CuCl2–PdCl2, CuCl2, Cu(OH)3Cl) cause reactor corrosion and deactivated quickly because of losing the chlorine anion.16,21 Indeed, several fundamental investigations have been carried out to explore the reaction mechanism of methanol oxycarbonylation and the role of Cl species in the reaction. The results pointed out that the Cl species mainly acted as the oxidant for the methanol to methoxide reaction,22,23 as well as the bridge that connects the oxido–reduction pathways between Cu(I) and Cu(II).24 However, a detailed understanding of the role of the Cl species in the catalytic cycle is still not available. For example, how does the Cl species oxidize methanol to methoxide? Why is the Cl species is necessary for the catalyst? Methoxide and HCl are proposed to be oxidation products of methanol on chloride-containing catalysts,22,23 however the detailed mechanism still needs further discussion.
On the other hand, in order to avoid the negative effect of Cl, the Cu-exchanged zeolite catalyst has been introduced and discussed experimentally and theoretically.25–30 However, the activity for the Cu-exchanged zeolite catalyst was not favorable compared to the chloride-containing catalysts.26,27 Thus, how to design a catalyst with high activity and without the Cl anion leaching problem is becoming the first problem in the catalytic gaseous oxidative carbonylation field. Accordingly, getting underlying insight into mechanism for the influence of the chlorine in the catalytic process would provide some essential information for designing new catalysts.
Early work proposed a possible mechanism for the oxidative carbonylation of methanol to DMC on Cu2Cl(OH)3 that is summarized as follows:19,31,32
 | (1) |
| (CH3O)*(CH3O)* + CO→(CH3O)2CO + ** | (2) |
 | (3) |
* and  represent the active sites of the catalyst, the * is formed by removing the Cl atom at
  . However, this mechanism is largely speculative. This, in turn, renders that fundamental investigations on the kinetics and thermodynamic characteristics of the oxidative carbonylation of methanol over a Cu2Cl(OH)3 single crystal surface are also necessary.
In this paper, with particular emphasis on the substitution reaction of methoxide (eqn (1)), DFT calculations combined with in situ DRIFTS studies are employed to describe the influence of the Cl species in the γ-Cu2Cl(OH)3 catalyzed oxidation carbonylation of methanol. We focus on geometric and energetic parameters of the adsorbed species as well as on their kinetic and thermodynamic properties. The γ-Cu2Cl(OH)3(021) surface was chosen as a representative of a close-packed facet.33 Additionally, in situ DRIFTS was employed to confirm the existence of the structures we obtained in the calculation. We attempt to address two questions in this paper: (i) the influence of Cl in the catalytic process and (ii) the detailed reaction mechanism.
2. Method
2.1 Experimental
The Cu2(OH)3Cl catalyst was prepared by an impregnation method on MCM-41 zeolite following the method reported in ref. 17. A copper chloride solution was prepared by dissolving 0.27 g CuCl2 in 60 ml ethanol. 2 g MCM-41 zeolite was impregnated with copper chloride solution for 4 h then dried under a flow of N2 at 403 K for 4 h. The dried sample was cooled to room temperature. A second impregnation was conducted in sodium hydroxide solution for 4 h. The catalyst was again subjected to thermal treatment under a flow of N2 at 403 K for 4 h.In situ DRIFTS was performed on a Thermo Fisher Nicolet 6700 FTIR Spectrometer. The catalyst sample was pre-treated in situ for 30 min at 473 K with a flow of He. All spectra were collected with four scans and a resolution of 4 cm−1.
2.2 Calculations
Theoretical investigation was carried out by using density functional theory and a periodical slab model. Electronic structure and equilibrium geometries of the model systems were calculated by using the Dmol3 program package in Materials Studio,34–36 at the spin-unrestricted level. Exchange–correlation effects were described by the generalized gradient approximation (GGA) with the BLYP functional.37,38 Extended numerical all-electron basis sets (double-zeta plus polarization, DNP) were used to describe the electronic structure of all atoms in the model systems except for copper on which the 10-electron core is approximated by an effective core potential (ECP). A Monkhorst–Pack grid39 of 3 × 3 × 1 was used to simplify the Brillouin zone. Geometry optimization was performed with a numerical displacement accuracy of the atom centers of 5 × 10⁻³ Å. Possible transition states (TSs) were located by using the complete linear and quadratic synchronous transit (LST, QST) method connecting the reactants and products.40 The nudged elastic band (NEB) method was used to calculate the MEP for all the reactions.41 The MEP for each reaction was discretized by a total of ten images between the initial and final states. All TSs were confirmed by the vibrational frequency analysis. The convergence criteria were set to 2 × 10⁻⁵ Ha for energy, 0.004 Ha Å−1 for force, 0.005 Å for displacement and 1 × 10⁻⁵ Ha for SCF. A Fermi smearing of 0.005 Ha was used to improve the calculation performance.Adsorption energies, Ead, were calculated as:
| Ead = Eads/sub − Eads − Esub | (4) |
| Er = ∑Eproducts −∑Ereactants | (5) |
In addition to geometric and energetic quantities, Mulliken population analysis was performed using ultrasoft pseudo-potentials generated from the “Ultrasoft” method implemented within the CASTEP module.42 The generalized gradient approximation with a Perdew and Wang (PW91) functional43 was used and a plane-wave cutoff energy of 340 eV was applied for all calculations. The default convergence criteria of CASTEP were applied 0.05eV Å−1 for the root-mean-square residual force on movable atoms.
γ-Cu2Cl(OH)3 possesses a hexagonal structure with lattice parameters of a = 13.654 Å, c = 14.041 Å, and its elementary cell is formed by two lattices with four elemental units sharing one arris.44 One lattice consists of an octagonal array of four OH groups and two Cl atoms with the copper atom. The other lattice is formed by an octagonal of six OH group with the copper. The ratio of these two lattices is 3![[thin space (1/6-em)]](https://www.rsc.org/images/entities/char_2009.gif) :
:![[thin space (1/6-em)]](https://www.rsc.org/images/entities/char_2009.gif) 1.44 As one of the most stable surfaces, the (021) surface was chosen to describe the character of γ-Cu2Cl(OH)3 in our calculation.33
1.44 As one of the most stable surfaces, the (021) surface was chosen to describe the character of γ-Cu2Cl(OH)3 in our calculation.33
The γ-Cu2Cl(OH)3(021) surface (Fig. 1) was modeled by a 12 atomic layer (4.10 Å thick, 67 atoms) slab in the (021) direction, a p (1 × 1) unit cell in the lateral directions, and a vacuum of 15 Å between slabs; the last 7 upper atomic layers were allowed to relax, with the atoms in the bottom layers fixed (yellow spheres in Fig. 1(b)) during the calculation. The calculated structure parameters and atomic Mulliken analysis results of the surface are summarized in Table S1 and S2.†
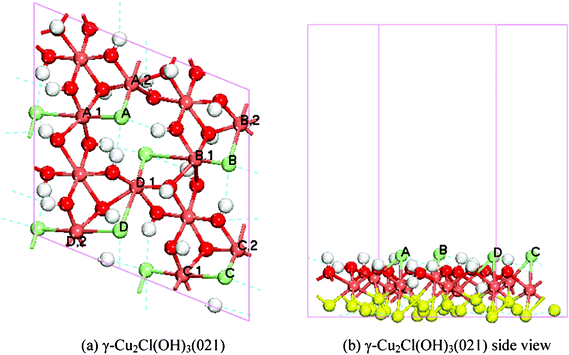 | ||
| Fig. 1 Top (a) and side (b) views of the 12 atomic slayer model of γ-Cu2Cl(OH)3(021) surface; the dark red, light red, green, and white spheres represent O atoms, Cu atoms, Cl atoms, and H atoms, respectively. The color of each atom is consistant throughout the paper. The yellow atoms in (b) indicate the fixed ones during the calculation. | ||
3. Results and discussion
3.1 CH3OH adsorption on γ-Cu2Cl(OH)3(021)
Experimentally, the presence of chlorine seems essential for designing a catalyst with high activity for methanol oxycarbonylation4,7,13,18 and the Cl atom is considered as the connection between the methanol and the active center of the catalyst.19,31,32 On this basis, the Cl atom was treated as the only adsorption site for methanol on the γ-Cu2Cl(OH)3(021) surface. On each Cl atom that was on the top of the γ-Cu2Cl(OH)3(021) surface (Fig. 1(b)), two different initial methanol absorption configurations are considered: one is CH3OH adsorbed on the top of the Cl atom through the interaction between the H atom of a hydroxyl and a Cl atom with its C–O bond vertical to the surface; another is CH3OH adsorbed on the surface with its C–O bond parallel to the substrate (denoted as X1 and X2; X indicates the different adsorption sites, 1 and 2 represent vertical and parallel adsorption, respectively). The optimized structures are shown in Fig. 2.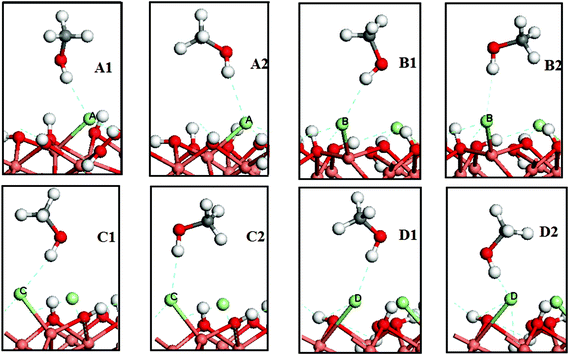 | ||
| Fig. 2 The final states of methanol molecular adsorption on γ-Cu2Cl(OH)3(021) surface. The dark grey spheres are C atoms. | ||
Notably, the bond distance of hydroxyl in surface bound CH3OH is longer than in the gaseous phase (0.970 Å), indicating ready activation of methanol upon adsorption. From the adsorption energies (Table 1), CH3OH adsorption is an exothermic process; and the thermodynamic stability of the two configurations for each adsorption site are nearly the same. However, the Mulliken analysis (Table 1) shows that the methanol in A2 has larger H–Cl bond population and smaller O–H bond population than A1, which indicates a more stable adsorbed and better activated methanol in A2. Meanwhile, the calculated activation energies also show that the methanol in A2 has a lower activation energy for the substitution reaction (supplementary material, Table S15, S16†). Thus, A2 is proposed to be preferable for the substitution reaction at the A site. Employing the same calculations, the B1, C1 and D1 are also pointed out (Table 1, and Table S17–S22 in supplementary material†). Meanwhile, the atomic Mulliken populations show that the valence electron of the Cl atom at an adsorption site, and the H atom and O atom of hydroxyl in CH3OH were changed upon adsorption (Table 2). It suggests that surface electrons were redistributed and the electron transfer process happened upon CH3OH adsorption, stabilizing the complex and activating the CH3OH.
| Configurations | H–O | H–Cl | Cl-CuX,1a | Cl-CuX,2 | Ead (eV) |
|---|---|---|---|---|---|
| a X indicates the corresponding adsorption site of methanol. | |||||
| A1 | 0.980 Å | 2.494 Å | 2.861 Å | 2.414 Å | −0.47 |
| 0.56 | 0.02 | 0.06 | 0.32 | ||
| A2 | 0.983 Å | 2.331 Å | 2.870 Å | 2.404 Å | −0.51 |
| 0.54 | 0.03 | 0.06 | 0.33 | ||
| B1 | 0.982 Å | 2.303 Å | 2.356 Å | 3.193 Å | −0.44 |
| 0.53 | 0.05 | 0.36 | 0.02 | ||
| B2 | 0.980 Å | 2.471 Å | 2.353 Å | 3.166 Å | −0.39 |
| 0.54 | 0.03 | 0.37 | 0.03 | ||
| C1 | 0.986 Å | 2.303 Å | 3.320 Å | 2.416 Å | −0.53 |
| 0.53 | 0.06 | 0.02 | 0.32 | ||
| C2 | 0.983 Å | 2.323 Å | 3.310 Å | 2.413 Å | −0.48 |
| 0.53 | 0.04 | 0.02 | 0.32 | ||
| D1 | 0.986 Å | 2.241 Å | 3.434 Å | 3.102 Å | −0.60 |
| 0.52 | 0.06 | 0.05 | 0.10 | ||
| D2 | 0.986 Å | 2.430 Å | 3.408 Å | 3.181 Å | −0.50 |
| 0.55 | 0.04 | 0.05 | 0.10 | ||
| Configurations | Ha | Oa | Cl | Sumab |
|---|---|---|---|---|
| a H and O are the H atom and O atom of hydroxyl in methanol. b Suma is the total charge of adsorbed methanol; a positive value indicates the electron loss from methanol. | ||||
| A2 | 0.49 | −0.70 | −0.47 | 0.08 |
| B1 | 0.48 | −0.72 | −0.50 | 0.08 |
| C1 | 0.47 | −0.68 | −0.47 | 0.10 |
| D1 | 0.49 | −0.69 | −0.46 | 0.11 |
| Before adsorbtion | 0.53 | −0.70 | −0.40 | 0 |
Based on the reaction equation of the oxidative carbonylation, two methanol molecules are needed to form one DMC.4–14 Thus, coadsorpion of two methanol molecules is discussed here as the reactant of the methoxide substitution. The configurations were optimized and are shown in Fig. 3; the marks (e.g., AB) indicate the two sites that methanol adsorbed on. Additionally, only the preferable adsorption configurations of methanol (A2, B1, C1, and D1) were chosen in this discussion.
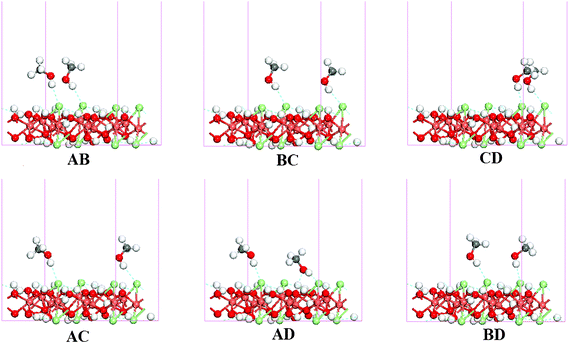 | ||
| Fig. 3 The optimized structure of two methanol molecules coadsorbed on the γ-Cu2Cl(OH)3(021) surface. | ||
Adsorption energies of all configurations are summarized in Table 3. The similar values between the Ead and Es indicate the methanol in the coadsorption configurations has the same thermodynamic stability as it adsorbed alone. Comparing the overlap population and distances of the relative bonds between single methanol adsorption configurations (Table 1) and coadsorption configuration (Table 3), the adsorption structures are barely changed upon the second methanol adsorption, suggesting that the coadsorption does not affect the activation of methanol prominently. Additionally, the characteristics for the coadsorption of three and four methanol molecules on γ-Cu2Cl(OH)3(021) were also calculated (supplementary material, Fig. S9–S10, Table S23–S24†), the results show that the coadsorbed methanol molecules have the same stability and activity as it does in single adsorption configurations.
| Configurations | a(ab) | b(ab) | Ead (eV)a | Es (eV)b | ||
|---|---|---|---|---|---|---|
| R(H–O) | R(H–Cl) | R(H–O) | R(H–Cl) | |||
| a Ead was calculated as the total adsorption energy of two methanol molecules. b Es was the sum of the adsorption energies of corresponding singly adsorbed methanol in Table 1. | ||||||
| AB | 0.982 Å | 2.481 Å | 0.980 Å | 2.362 Å | −0.93 | −0.94 |
| 0.54 | 0.03 | 0.54 | 0.03 | |||
| BC | 0.980 Å | 2.403 Å | 0.986 Å | 2.309 Å | −0.96 | −0.97 |
| 0.54 | 0.03 | 0.54 | 0.05 | |||
| CD | 0.986 Å | 2.304 Å | 0.987 Å | 2.193 Å | −1.11 | −1.13 |
| 0.53 | 0.06 | 0.52 | 0.07 | |||
| AC | 0.983 Å | 2.331 Å | 0.986 Å | 2.303 Å | −1.04 | −1.04 |
| 0.54 | 0.03 | 0.53 | 0.05 | |||
| AD | 0.983 Å | 2.349 Å | 0.992 Å | 2.156 Å | −1.23 | −1.10 |
| 0.54 | 0.03 | 0.53 | 0.07 | |||
| BD | 0.981 Å | 2.377 Å | 0.986 Å | 2.197 Å | −1.01 | −1.04 |
| 0.54 | 0.04 | 0.52 | 0.06 | |||
From Table 3, the O–H bond of methanol adsorbed at the D site has the longest distance and smallest overlap population, suggesting the most activated methanol and a preferable complex for the substitution reaction. Meanwhile, the calculated energy barriers for the substitution reaction of singly adsorbed methanol also show that the methanol vertically adsorbed at the D site has the smallest barrier (supplementary material, Table S15–S22†). Furthermore, these calculations also proved that the methanol vertically adsorbed at the C site has a lower energy barrier for the reaction compared to the A site and B site. Thus, the CD configuration, which contains two methanol with the largest activity, was chosen as the preferable reactant configuration.
3.2 Coadsorption of methanol, methoxide and HCl on γ-Cu2Cl(OH)3(021)
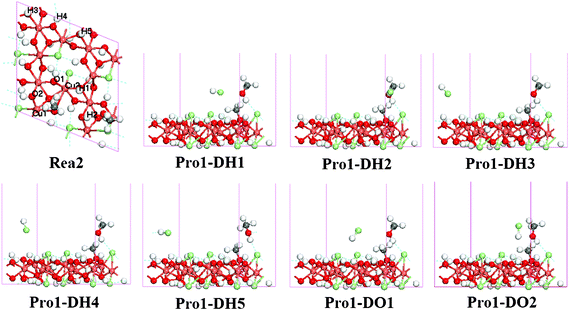 | ||
| Fig. 4 Optimized structure for Pro1-DX systems (side view, X indicates the different HCl adsorption sites); the top site of the labeled atoms in Rea2 were the adsorption sites of HCl (top view). | ||
The methoxide species adsorbed on the surface through the O–Cu bond with its C–O axis nearly normal to the substrate with a tilting angle close to 14°, which is in agreement with the work by Amemiya et al.45 and Gomes et al.46 on methoxide adsorption on a Cu surface. The calculated C–O bond length, 1.391 Å, for the adsorbed species is also in good agreement with the experimental results reported by Hofmann et al.47 Furthermore, two O–Cu bonds were found in the Mulliken analysis (bond population is 0.16 for O–Cu1, 0.03 for O–Cu2), while the adsorption energy for methoxide is 0.95 eV.
In our calculations, the top site of H/O atoms surrounding the adsorbed methoxide were chosen as the adsorption sites of HCl. Seven coadsorption configurations were calculated (Fig. 4) and the adsorption energies and key structural parameters are summarized in Table 4. The low adsorption energies (lower than 0.3 eV) and long distance between the substrate and HCl species indicate a weak adsorption of HCl, except in the H2 and H5 configurations. For the H2 and H5 configurations, the Mulliken analysis shows an interaction between the H atom in HCl and the O atom in methanol adsorbed at C site (bond population is 0.20 in H2 and 0.14 in H5), which could be the main reason for the higher HCl adsorption energy. Despite this, it is still reasonable to propose that HCl adsorption on the γ-Cu2Cl(OH)3(021) surface is weak and moveable.
| H1 | H2 | H3 | H4 | H5 | O1 | O2 | |
|---|---|---|---|---|---|---|---|
| a Distance from the surface was set to be the distance between the top atom of the surface and the bottom atom of HCl in the normal direction. | |||||||
| Adsorption energy (eV) | −0.27 | −0.56 | −0.25 | −0.24 | −0.55 | −0.29 | −0.27 |
| Distance from the surface (Å)a | 2.785 | 2.783 | 2.635 | 2.984 | 2.725 | 2.067 | 2.648 |
On the other hand, since HCl is removable from the surface, it was treated as diffusing into the gaseous phase and removed from the coadsorbed complex. The last coadsorbed complex with methoxide adsorbed at the D site and methanol vertically adsorbed at the C site was built to be the reactant for the following substitution reaction of methoxide at the C site (denoted as Rea2, Fig. 4).
 | ||
| Fig. 5 Optimized structure for Pro2-CX systems (side view, X indicates the different HCl adsorption sites). | ||
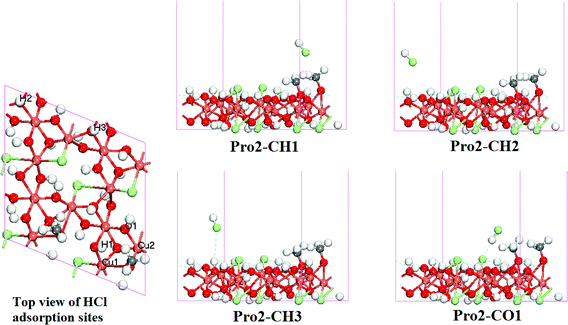
In Fig. 5, the methoxide adsorbed at the D site is very similar with that in Fig. 4. Another methoxide adsorbed at the C site also through O–Cu bonds, and with its C–O axis almost vertical to the catalyst surface, has a calculated C–O bond length of 1.410 Å. The Milliken population analysis shows two O–Cu bonds (bond population is 0.02 for O–Cu1 and 0.26 for O–Cu2) between the methoxide and the surface; and the adsorption energy is 0.99 eV.
The top sites of H/O atoms surround the C site were treated as the adsorption sites of HCl. Four different optimized structures were found (Fig. 5) but all are similar in terms of HCl adsorption energy. The low adsorption energies of HCl (lower than 0.40 eV, Table 5) and long distance between the HCl and the catalyst surface (larger than 3 Å, Table 5) indicate the weak and movable adsorption of HCl. Furthermore, the coadsorption of HCl with a single methoxide molecule was also calculated (supplementary material, Fig. S1–S4, Table S3–S6†), all HCl weakly adsorbed on the surface, and adsorption energies were lower than 0.45 eV. On this basis, we expect that HCl is weakly adsorbed on the γ-Cu2Cl(OH)3(021) surface and is easy to move, which can also explain the phenomenon of the leaching of Cl species observed from experimental measurements.6,16,22,48,49
| H1 | H2 | H3 | O1 | |
|---|---|---|---|---|
| a Distance from the surface was set to be the distance between the top atom of the surface and the bottom atom of HCl in the normal direction. | ||||
| Adsorption energy (eV) | −0.22 | −0.23 | −0.24 | −0.38 |
| Distance from the surface (Å)a | 3.921 | 3.045 | 3.392 | 3.377 |
3.3 Substitution reaction of methoxide on the γ-Cu2Cl(OH)3(021) surface
In PATH(I), the final state adopts the Pro1-DH1 configuration. During the MEP calculation, one minimum energy state was located and its configuration (denoted as Mid1-DH1) is depicting in Fig. 6. The calculated values of the distance and overlap population for the corresponding bonds are summarized in Table 6.
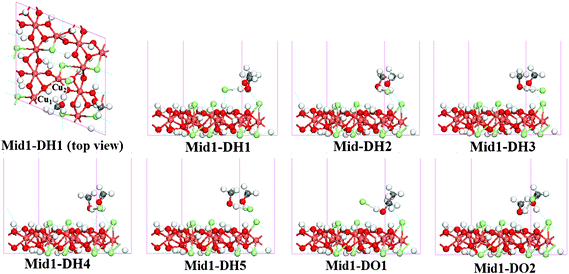 | ||
| Fig. 6 Structure of Mid1-DX configurations located in the MEP for PATH(I) to PATH(VII). D indicates that the methanol joined in the reaction adsorbed at the D site, H1–O2 indicate the different HCl adsorption sites. | ||
| Cl–Cu1 | Cl–Cu2 | Cl–H | H–O | |
|---|---|---|---|---|
| Mid1-DH1 | 6.248 Å | 4.425 Å | 2.104 Å | 0.996 Å |
| 0 | 0 | 0.10 | 0.50 | |
| Mid1-DH2 | 6.189 Å | 6.366 Å | 2.243 Å | 0.992 Å |
| 0 | 0 | 0.08 | 0.51 | |
| Mid1-DH3 | 3.831 Å | 5.762 Å | 2.211 Å | 0.993 Å |
| 0.02 | 0 | 0.08 | 0.51 | |
| Mid1-DH4 | 5.919 Å | 7.336 Å | 2.177 Å | 0.992 Å |
| 0 | 0 | 0.07 | 0.51 | |
| Mid1-DH5 | 4.795 Å | 5.746 Å | 2.117 Å | 0.995 Å |
| 0 | 0 | 0.10 | 0.50 | |
| Mid1-DO1 | 5.790 Å | 5.359 Å | 2.158 Å | 0.997 Å |
| 0 | 0 | 0.09 | 0.51 | |
| Mid1-DO2 | 5.335 Å | 6.237 Å | 2.128 Å | 1.000 Å |
| 0 | 0 | 0.10 | 0.51 |
From Fig. 6, it is clear that the Cl atom at the D site escaped from the surface and only interacts with the H atom of the hydroxyl group in methanol; the Mulliken analysis shows that the overlap populations of both Cl–Cu1 and Cl–Cu2 bonds have dropped to zero. Meanwhile, the distance between Cl⋯H in Mid1-DH1 is 2.177 Å and the overlap population is 0.10, indicating a weak bond was already formed. Meanwhile, the O–H bond is slightly weaker than in the gaseous phase (0.992 Å, 0.49 in Mid1-DH1 configuration; 0.970 Å, 0.54 in the gaseous phase). The other bonds of methanol are barely changed.
In the other PATHs, similar configurations (denoted as Mid1-DX, X indicates the corresponding HCl adsorptions) were also located and are depicted in Fig. 6, the corresponding geometric parameters and overlap population values are also summarized in Table 6. All the Mid1-DX configurations have similar structural characteristics.
Taking the Mid1-DX configurations as the intermediate product, the reaction pathways were reconstructed and the activation energies are summarized in Table 7. PATH(1) to PATH(7) correspond to seven reaction paths have CD configurations as reactants and seven Mid1-DX configurations as products, respectively. PATH(A) to PATH(G) correspond to seven reaction paths and have Mid1-DX configurations as the reactant and the corresponding Pro1-DX configurations as the product, respectively.
| — | PATH(I) | PATH(II) | PATH(III) | PATH(IV) | PATH(V) | PATH(VI) | PATH(VII) |
|---|---|---|---|---|---|---|---|
| a PATH(1) to PATH(7) correspond to reaction paths that have CD configuration as reactants and four Mid1-DX configurations as products, respectively. b PATH(A) to PATH(G) correspond to reaction paths that have Mid1-DX configurations as reactants and corresponding Pro1-DX configurations as products, respectively. | |||||||
| Reactant | CD | CD | CD | CD | CD | CD | CD |
| Product | Pro1-DH1 | Pro1-DH2 | Pro1-DH3 | Pro1-DH4 | Pro1-DH5 | Pro1-DO1 | Pro1-DO2 |
| Ea (eV) | 1.82 | 2.48 | 1.61 | 1.61 | 1.93 | 1.68 | 1.96 |
| Er (eV) | 0.77 | 0.52 | 0.79 | 0.78 | 0.52 | 0.78 | 0.63 |
| PATH(1)a | PATH(2) | PATH(3) | PATH(4) | PATH(5) | PATH(6) | PATH(7) | |
| Reactant | CD | CD | CD | CD | CD | CD | CD |
| Product | Mid1-DH1 | Mid1-DH2 | Mid1-DH3 | Mid1-DH4 | Mid1-DH5 | Mid1-DO1 | Mid1-DO2 |
| Ea (eV) | 0.85 | 0.52 | 0.13 | 0.17 | 0.36 | 0.81 | 0.22 |
| Er (eV) | 0.01 | 0.04 | 0.04 | 0.01 | 0.15 | 0.15 | 0.16 |
| PATH(A)b | PATH(B) | PATH(C) | PATH(D) | PATH(E) | PATH(F) | PATH(G) | |
| Reactant | Mid1-DH1 | Mid1-DH2 | Mid1-DH3 | Mid1-DH4 | Mid1-DH5 | Mid1-DO1 | Mid1-DO2 |
| Product | Pro1-DH1 | Pro1-DH2 | Pro1-DH3 | Pro1-DH4 | Pro1-DH5 | Pro1-DO1 | Pro1-DO2 |
| Ea (eV) | 0.92 | 1.13 | 1.47 | 1.02 | 1.03 | 0.81 | 0.76 |
| Er (eV) | 0.76 | 0.48 | 0.75 | 0.77 | 0.38 | 0.63 | 0.47 |
Comparing the calculated results, the activation energies for PATH(1) to PATH(7) and PATH(A) to PATH(G) are much lower compared to PATH(I) to PATH(VII), which indicates the new reaction paths built by using the new Mid1-DX configurations should be preferable to describe the methoxide substitution reaction at the D site on the γ-Cu2Cl(OH)3(021) surface. Furthermore, PATH 1–7 are slightly endothermic, suggesting a similar stability between the intermediates and the CD configuration.
During the MEP calculation for these PATHs, configurations similar to the Mid1-DX configurations were also found (denoted as Mid2-CX, X indicates corresponding HCl adsorption sites; Fig. 7). In all Mid2-CX configurations, the Cl atom escaped from the C site; the Cl–Cu1 bond and Cl–Cu2 bond are both broken (overlap populations are 0); and the Mulliken analysis also shows a weak bond between the Cl and H atoms (Table 8).
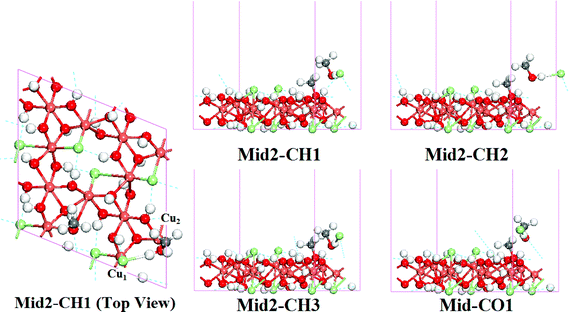 | ||
| Fig. 7 Structure of Mid2-CX configurations located in the reaction PATH(I) to PATH(VII). C indicates that the methanol joined in the reaction and adsorbed at the C site, H1–O1 indicate the different HCl adsorption sites. | ||
| Cl–Cu1 | Cl–Cu2 | Cl–H | H–O | |
|---|---|---|---|---|
| Mid2-CH1 | 3.906 Å | 4.641 Å | 2.096 Å | 0.994 Å |
| 0.02 | 0.01 | 0.10 | 0.52 | |
| Mid2-CH2 | 6.129 Å | 5.529 Å | 2.220 Å | 0.992 Å |
| 0 | 0 | 0.08 | 0.52 | |
| Mid2-CH3 | 3.880 Å | 4.646 Å | 2.102 Å | 0.996 Å |
| 0.02 | 0 | 0.11 | 0.53 | |
| Mid2-CO1 | 4.734 Å | 4.883 Å | 2.089 Å | 0.997 Å |
| 0.01 | 0.01 | 0.10 | 0.52 |
Similar to the reaction at the D site, the reaction pathways of the substitution reaction at the C site were also rebuilt using the Mid2-CX configurations. Comparing the activation energies summarized in Table 9, it is clear that the new reaction paths should be preferable to describe the methoxide substitution reaction at the C site, too.
| PATH(VIII) | PATH(IX) | PATH(X) | PATH(XI) | |
|---|---|---|---|---|
| a PATH(8) to PATH(11) correspond to four reaction paths that have a Rea2 configuration as reactants and four Mid2-CX configurations as products, respectively. b PATH(H) to PATH(K) correspond to four reaction paths that have Mid2-CX configurations as reactants and corresponding Pro2-CX configurations as products, respectively. | ||||
| Reactant | Rea2 | Rea2 | Rea2 | Rea2 |
| Product | Pro2-CH1 | Pro2-CH2 | Pro2-CH3 | Pro2-CO1 |
| Ea (eV) | 1.96 | 1.75 | 1.98 | 1.56 |
| Er (eV) | 0.93 | 0.78 | 0.92 | 0.96 |
| PATH(8)a | PATH(9) | PATH(10) | PATH(11) | |
| Reactant | Rea2 | Rea2 | Rea2 | Rea2 |
| Product | Mid2-CH1 | Mid2-CH2 | Mid2-CH3 | Mid2-CO1 |
| Ea (eV) | 0.73 | 0.57 | 1.10 | 0.74 |
| Er (eV) | 0.35 | 0.44 | 0.40 | 0.28 |
| PATH(H)b | PATH(I) | PATH(J) | PATH(K) | |
| Reactant | Mid2-CH1 | Mid2-CH2 | Mid2-CH3 | Mid2-CO1 |
| Product | Pro2-CH1 | Pro2-CH2 | Pro2-CH3 | Pro2-CO1 |
| Ea (eV) | 1.27 | 1.09 | 1.13 | 0.89 |
| Er (eV) | 0.58 | 0.34 | 0.52 | 0.68 |
Notably, structures similar to Mid1-DX and Mid2-CX were also found during the MEP calculations for the substitution reaction of the singly adsorbed methanol (supplementary material, Fig. S5–S8, Table S7–S14†); the new paths build employing the new intermediates, which all have lower activation barriers (supplementary material, Table S15–S22†). Thus, the appearance of the new intermediate during our calculation should not be a fluke. In order to confirm the existence of the new intermediates, in situ DRIFTS experiments were carried out to examine the intermediates involved in the substitution reaction of methoxide on the γ-Cu2Cl(OH)3 catalyst.
3.4 DRIFTS study
During the DRIFTS experiments, the reaction temperature was set to 413 K; the introduction of CH3OH was carried out using a bubble device, in which the bubble temperature was 278 K. All flow rates were approximately 30 cm3 min−1. Once steady-state was reached, the stream was switched to He to remove gas-phase CH3OH from the atmosphere, as well as any weakly adsorbed species.The infrared spectra observed during exposure of the γ-Cu2Cl(OH)3 catalyst to methanol in He at 413 K are shown in Fig. 8. Upon addition to the flow of He, methanol reacts rapidly with the catalyst to form methoxide species, which exhibit asymmetric and symmetric CH3 stretching vibration at 2923 and 2828 cm−1, respectively.50–53 Meanwhile, the bands at 2956 and 2854 cm−1 are confirmed to be the anti-symmetric and symmetric C–H stretching vibration of molecularly adsorbed methanol on a MCM-41 zeolite.50,53 Notably, two bands appeared at 2931 and 2845cm−1; which can be assigned to the anti-symmetric and symmetric of C–H vibration in the new intermediate (CH3OH⋯Cl). Additionally, the calculated low adsorption energies of CH3OH⋯Cl (around 0.6 eV) indicated it could be removed under reaction conditions, which also agreed with the DRIFTS results that these two bands are disappeared after 20 min of flushing with He.
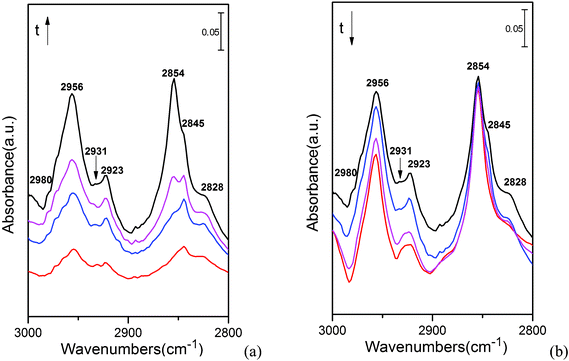 | ||
| Fig. 8 IR spectra recorded during transient-response experiments: (a) catalyst exposure to CH3OH for 20 min; (b) He flushing for 30 min. | ||
Accordingly, we propose the following mechanism of methoxide substitution reaction on the γ-Cu2Cl(OH)3(021) surface as:
 | (6) |
| * + CH3O⋯H⋯Cl→(CH3O)* + HCl | (7) |
The most suitable reaction pathways for the reaction of methanol coadsorbed at the C site and D site are summarized in Fig. 9. Notably, the highest reaction barrier in the mechanism is 0.89 eV, much lower than the calculated bond energy of hydroxyl in methanol (4.68 eV). This indicates that the existence of Cl species successfully decreases the energy cost for the oxidation of methanol.
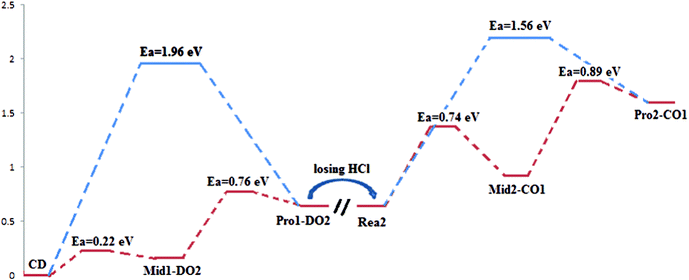 | ||
| Fig. 9 Reaction pathways for the substitution reaction of methoxide over γ-Cu2Cl(OH)3(021) surface. Blue curve indicates the substitution mechanism proposed in the previous experimental research; red curve indicates the mechanism we build in this work. | ||
4. Conclusions
DFT calculations and DRIFTS experiments have been performed to study the substitution reaction of methoxide on the γ-Cu2Cl(OH)3(021) surface and investigate the influence of Cl in the catalytic process. The methanol was found positioned with the H atom towards the Cl atom on the surface in a close a-top position at all adsorption sites, and the Cl atom plays a role in the pre-reaction for H–O bond activating. We have also shown that the methanol in coadsorption configurations has the same stability and activity as in single adsorption configurations.The methoxide adsorbed on the catalyst surface via two O–Cu bonds. HCl was found weakly adsorbed on the surface, which can explain the experimental phenomenon regarding leaching of the Cl species.
The MEP for each reaction pathway that connects the adsorbed methanol and coadsorbed methoxide and HCl has been explored and one minimum energy state was located. The existence of the corresponding configurations has been confirmed by DRIFTS results. A plausible new mechanism of methoxide substitution reaction on γ-Cu2Cl(OH)3(021) has been built by using the new intermediate. Based on the mechanism, we found that the Cl atom escaped from the surface and bonded with the methanol first (forming the CH3OH⋯Cl species), which then reacted with the methanol to form adsorbed methoxide and HCl. The existence of the Cl atom in the catalyst seriously decreased the activation energy for the oxidation of methanol to form methoxide.
Acknowledgements
Financial support from the National Natural Science Foundation of China (NSFC) (grant no. 20876112, 20936003), the Specialized Research Fund for the Doctoral Program of Higher Education (SRFDP) (grant no. 20090032110021), the Program for New Century Excellent Talents in University (NCET-04-0242), the Seed Foundation of Tianjin University (60303002), and the Program of Introducing Talents of Discipline to Universities (B06006) is gratefully acknowledged.References
- Y. Ono, Pure Appl. Chem., 1996, 68, 367 CrossRef CAS.
- Y. Ono, Appl. Catal., A, 1997, 155, 133 CrossRef CAS.
- M. A. Pacheco and C. L. Marshall, Energy Fuels, 1997, 11, 2 CrossRef CAS.
- N. Keller, G. Rebmann and V. Keller, J. Mol. Catal. A: Chem., 2010, 317, 1 CrossRef CAS.
- W. Yanji, Z. Xinqiang, Y. Baoguo, Z. Bingchang and C. Jinsheng, Appl. Catal., A, 1998, 171, 255 CrossRef.
- R. Jiang, Y. Wang, X. Zhao, S. Wang, C. Jin and C. Zhang, J. Mol. Catal. A: Chem., 2002, 185, 159 CrossRef CAS.
- M. S. Han, B. G. Lee, I. Suh, H. S. Kim, B. S. Ahn and S. I. Hong, J. Mol. Catal. A: Chem., 2001, 170, 225 CrossRef CAS.
- P. Yang, Y. Cao, W.-L. Dai, J.-F. Deng and K.-N. Fan, Appl. Catal., A, 2003, 243, 323 CrossRef CAS.
- P. Yang, Y. Cao, J.-C. Hu, W.-L. Dai and K.-N. Fan, Appl. Catal., A, 2003, 241, 363 CrossRef CAS.
- Y. Cao, P. Yang, C.-Z. Yao, N. Yi, W.-L. Feng, W.-L. Dai and K.-N. Fan, Appl. Catal., A, 2004, 272, 15 CrossRef CAS.
- P. Yang, Y. Cao, X. H. Bao, W. L. Dai and K. N. Fan, Chin. J. Catal., 2004, 25, 995 CAS.
- R. Y. Wang, Z. Li, H. Y. Zheng and K. C. Xie, Chin. J. Catal., 2009, 30, 1068 CAS.
- Y. B. Song, A. G. Luo, Y. H. Du and Y. W. Fang, Prog. Chem., 2008, 20, 221 CAS.
- J. Song, T. Zhao and Y. Du, Chin. J. Catal., 2006, 27, 386 CrossRef CAS.
- Z. Zhang, X. Ma, P. Zhang, Y. Li and S. Wang, J. Mol. Catal. A: Chem., 2007, 266, 202 CrossRef CAS.
- Z. Zhang, X. Ma, J. Zhang, F. He and S. Wang, J. Mol. Catal. A: Chem., 2005, 227, 141 CrossRef CAS.
- M. S. Han, B. G. Lee, B. S. Ahn, H. S. Kim, D. J. Moon and S. I. Hong, J. Mol. Catal. A: Chem., 2003, 203, 137 CrossRef CAS.
- X. Ma, Z. Li, B. Wang and G. Xu, React. Kinet. Catal. Lett., 2002, 76, 179 CrossRef CAS.
- K. Tomishige, T. Sakaihori, S.-i. Sakai and K. Fujimoto, Appl. Catal., A, 1999, 181, 95 CrossRef CAS.
- P.-Y. Yang and Y.-G. Zhou, ChemInform, 2004, 35 Search PubMed.
- A. Punnoose, M. S. Seehra, B. C. Dunn and E. M. Eyring, Energy Fuels, 2001, 16, 182 CrossRef.
- 1991.
- R. Jiang, T. Monroe, R. McRogers and P. J. Larson, Haemophilia, 2002, 8, 1 CrossRef CAS.
- D. Delledonne, F. Rivetti and U. Romano, Appl. Catal., A, 2001, 221, 241 CrossRef CAS.
- S. A. Anderson and T. W. Root, J. Mol. Catal. A: Chem., 2004, 220, 247 CrossRef CAS.
- Y. Zhang, I. J. Drake, D. N. Briggs and A. T. Bell, J. Catal., 2006, 244, 219 CrossRef CAS.
- P. Zhang, S. Huang, Y. Yang, Q. Meng, S. Wang and X. Ma, Catal. Today, 2010, 149, 202 CrossRef CAS.
- X. Zheng and A. T. Bell, J. Phys. Chem. C, 2008, 112, 5043 CAS.
- S. Huang, Y. Wang, Z. Wang, B. Yan, S. Wang, J. Gong and X. Ma, Appl. Catal., A, 2012, 417–418, 236 CrossRef CAS.
- Y. Shen, Q. Meng, S. Huang, S. Wang, J. Gong and X. Ma, RSC Adv., 2012, 2, 7109 RSC.
- K. Huang, R. Han, Solid State Physics, Higher Education Press, Beijing, 1980 Search PubMed.
- U. Romano, R. Tesel, M. M. Mauri and P. Rebora, Ind. Eng. Chem. Prod. Res. Dev., 1980, 19, 396 CrossRef CAS.
- C. Palache, H. Berman and C. Frondel, Dana's system of mineralogy, 7th edn, Wiley, New York, 1951, vol. II, p. 74 Search PubMed.
- B. Delley, J. Chem. Phys., 1990, 92, 508 CrossRef CAS.
- B. Delley, J. Phys. Chem., 1996, 100, 6107 CrossRef CAS.
- B. Delley, J. Chem. Phys., 2000, 113, 7756 CrossRef CAS.
- A. D. Becke, Phys. Rev. A: At., Mol., Opt. Phys., 1988, 38, 3098 CrossRef CAS.
- C. Lee, W. Yang and R. G. Parr, Phys. Rev. B, 1988, 37, 785 CrossRef CAS.
- H. J. Monkhorst and J. D. Pack, Phys. Rev. B: Solid State, 1976, 13, 5188 CrossRef.
- T. A. Halgren and W. N. Lipscomb, Chem. Phys. Lett., 1977, 49, 225 CrossRef CAS.
- G. Henkelman and H. Jónsson, J. Chem. Phys., 2000, 113, 9978 CrossRef CAS.
- M. D. Segall, P. J. D. Lindan, M. J. Probert, C. J. Pickard, P. J. Hasnip, S. J. Clark and M. C. Payne, J. Phys.: Condens. Matter, 2002, 14, 2717 CrossRef CAS.
- J. P. Perdew and Y. Wang, Phys. Rev. B: Condens. Matter, 1992, 45, 13244 CrossRef.
- M. Fleet, Acta Crystallogr., Sect. B: Struct. Crystallogr. Cryst. Chem., 1975, 31, 183 CrossRef.
- K. Amemiya, Y. Kitajima, Y. Yonamoto, S. Terada, H. Tsukabayashi, T. Yokoyama and T. Ohta, Phys. Rev. B: Condens. Matter, 1999, 59, 2307 CrossRef CAS.
- J. R. B. Gomes and J. A. N. F. Gomes, Surf. Sci., 2001, 471, 59 CrossRef CAS.
- P. Hofmann, K. M. Schindler, S. Bao, V. Fritzsche, D. E. Ricken, A. M. Bradshaw and D. P. Woodruff, Surf. Sci., 1994, 304, 74 CrossRef CAS.
- Z. Zhang, X. Ma, P. Zhang, Y. Li and S. Wang, J. Mol. Catal. A: Chem., 2007, 266, 202 CrossRef CAS.
- R. Jiang, S. Wang, X. Zhao, C. Wang and C. Zhang, Appl. Catal., A, 2003, 238, 131 CrossRef CAS.
- Y. Zhang and A. T. Bell, J. Catal., 2008, 255, 153 CrossRef CAS.
- K. S. T, Catal. Today, 1997, 33, 173 CrossRef.
- J. Engeldinger, M. Richter and U. Bentrup, Phys. Chem. Chem. Phys., 2012, 14 Search PubMed.
- S. A. Anderson and T. W. Root, J. Catal., 2003, 217, 396 CAS.
Footnote |
| † Electronic Supplementary Information (ESI) available. See DOI: 10.1039/c2ra20570j/ |
| This journal is © The Royal Society of Chemistry 2012 |
