Exploring the topography of free energy surfaces and kinetics of cytochrome c oxidases interacting with small ligands†
Massimiliano
Porrini‡
,
Vangelis
Daskalakis§
and
Stavros C.
Farantos
*
Department of Chemistry, University of Crete, Heraklion 71003, Crete, Greece, and Institute of Electronic Structure and Laser, Foundation for Research and Technology-Hellas (FORTH), PO Box 1527, Vasilika Vouton, Heraklion, 71110, Crete, Greece
First published on 13th April 2012
Abstract
Free energy landscape explorations have been performed for Cytochrome c Oxidases, aa3 from Paracoccus denitrificans and ba3 from Thermus thermophilus, interacting with small gas molecules (CO, NO, O2), as well as Xe. The calculations were carried out with thermodynamic perturbation theory, the validity of which has been examined by previous molecular dynamics calculations. This approach allows us to bypass the immense computational time required in such problems. The free energy surfaces are constructed as functions of the three Cartesian coordinates of the center of mass of the ligand and averaging over the orientation angles of the molecule. Hydrophilic/hydrophobic cavities and channels around the distal heme-a3 pocket were detected and the corresponding free energy minima and barriers were estimated. These free energy extrema permit us to extract kinetic parameters and to discuss the biochemical functions of the enzymes in conjunction with experimental results. The conserved cavities found in the two enzymes as well as in previous results of myoglobin demonstrate that topographical characteristics in the distal region of the active sites of the heme oxidase proteins are structurally stable.
1 Introduction
Free energy (hyper)surfaces (FES)1 defined in a multidimensional coordinate space are the cornerstones in studying macromolecules, since from these functions we can extract most of the properties of macroscopic states of matter. Years of research have advanced the computational tools and, in conjunction with the progress in computer technology, the calculations of free energy changes along reaction paths have progressed tremendously. Most of these algorithms belong to the class of thermodynamic integration methods, which require a large number of computer simulations for the intermediate or adaptive systems.2 Nevertheless, limitations on the size of the molecules studied and the ambiguity in obtaining ergodic sets of microstates over which average quantities are acquired, still exist. The problem becomes even more difficult, since in most of the studies we require a parametric investigation of the thermodynamic quantities, for example temperature dependence or different types of substrate and ligand. In these cases the demand in computational time can exceed the present computational resources. Therefore, qualitative theories such as bifurcation analysis of stationary objects in non-linear dynamical systems,3 as well as approximate theories such as thermodynamic perturbation theories,4 in which a limited number of molecular simulations is carried out, usually for the unperturbed system, are worth pursuing.With respect to computing free energies via thermodynamic perturbation theory (TPT), Schulten and co-workers5 have introduced an economical method to calculate the free energies of proteins interacting with small ligand molecules. The authors assumed only van der Waals interactions and they obtained satisfactory results for myoglobin interacting with small diatomic molecules, such as O2, CO and NO.
In the perturbation theory, the Hamiltonian of the protein–ligand system, H, consists of the sum of the unperturbed protein Hamiltonian, H0, plus the interaction term V,
| H(q,p,r,pr) = H0(q,p) + K(pr) + V(q,r) | (1) |
| r → ∞, V(q,r∞) = 0 | (2) |
Also, we assume that the internal degrees of freedom of the ligand molecule are kept fixed at their equilibrium values. Then, the free energy as a function of r is approximated by the formula1 (see also the Appendix)
 | (3) |
Nevertheless, the equation needs to be applied very carefully, as perturbation theory provides accurate estimates of the free energy under the sine qua non condition that the perturbed protein is fairly akin to the unperturbed one. A criterion that ensures such a requirement (V(q,r)/kBT ≪ 1) is extracted in the Appendix by expanding the exponential function in eqn (3) with a Taylor series. However, this is a very strict criterion for exploring an area of a hypersurface, and thus, we are seeking other tests to examine the validity of the perturbation method. Furthermore, the phase space important regions of the protein–ligand system must be sampled adequately through the exploration of the lone protein microstates; a very useful pictorial representation of this concept can be found in Ref. 6.
As a matter of fact, reliability and efficiency are the two main issues in calculating free energies. The representation of the system, i.e. the choice of the force field (FF), and the finite sampling are the two most significant sources of error in a free energy evaluation. In the current work we assume that systematic errors arising from the choice of the FF are negligible and that the major error does not derive from an incomplete sampling of the lone protein. These assumptions are well justified in the distal region of the active site of the protein, as we shall explain later.
In this article we explore and compare the free energy landscapes of cytochrome c oxidase enzymes interacting with a series of diatomic molecules, like the non-polar O2 and the polar CO and NO, as well as the Xe atom. The potential V incorporates both van der Waals and Coulomb interactions.
Cytochrome c oxidase (CcO) is the terminal enzyme in the respiratory electron transport chain of mitochondria and many bacteria.7 Receiving four electrons from cytochrome c and binding four protons from the mitochondrial matrix, it operates the reduction of molecular oxygen to water, while it pumps four protons across the inner mitochondrial membrane, to add to the transmembrane gradient of the proton electrochemical potential necessary for synthesizing ATP.8,9
As it has already been demonstrated in the literature,5,10,11 in order to follow the dynamics of a ligand molecule it is important to consider the channels that the ligand can migrate through, the cavities where it can spend significant portions of time as well as its diffusion. Although X-ray analysis and other techniques used to identify cavities in static structures are very important to trace preexisting rigid internal docking sites, the packing defects, detected only through dynamical motions, can give rise to alternative pathways, through which the ligand can permeate.12 Many theoretical and experimental articles in the literature debate whether the ligand can permeate the protein bulk via thermal fluctuations because of packing defects12,13 or via simple diffusion in pre-existing channels and cavities delimited in a rigid structure.14,15 It has been suggested that around the active site of CcO, which includes the binuclear heme-a3/CuB site, the cavities must be rigid and permanent in order to shelter the ligand and bring it efficiently to bind CuB,14 whereas the diffusion from the exterior throughout the protein matrix is rather due to a permeation effect, cooperated by the role of packing defects. Hence, dynamical studies are necessary to probe pathways and cavities, which are difficult to explore or detect via X-ray experiments.
Besides, we have to consider that dynamic and kinetic processes in protein–ligand systems cover a large range of time scales: from the ultrafast and fast dynamics, that span a range of a few hundreds of femtoseconds to picoseconds, up to the slow dynamics, from microseconds to milliseconds. For the CcO–CO complex from Thermus thermophilus it has been experimentally proven that carbon monoxide binds to CuB in less than 1 ps after dissociation from heme-a3 iron,16,17 whereas a very slow kinetic process takes place on the millisecond time scale, for geminate recombination.18 In the latter, the authors experimentally analyzed the microsecond time scale kinetics, and apart from the transfer from Fe to Cu, they identified the presence of a docking site, internal to the heme-a3 pocket, which shelters around 20% of CO.
In a recent publication19 we have studied the intracavity molecular dynamics20 (MD) of the photodissociated carbon monoxide from ba3-CcO, sampling the phase space with hundreds of trajectories each integrated up to 100 ps. It was shown that up to this time CO resides in the inner heme-a3 cavity and when the ring-D propionate of heme is deprotonated, CO can escape into an outer cavity close to heme. To reach further regions in the protein, or even more to study the kinetics of the process, requires much longer integration times, which are currently not achievable. Therefore, by employing thermodynamic perturbation theory we bypass the spacial and temporal limitations of MD in enzyme kinetics. One of the objectives of the present study, which does not include the membrane in which the protein lies, is to compare the landscape and stability of the free energy surfaces of proteins interacting with different ligands in the domain around the distal area of the active site, which has the property to be pretty taut, as previously stated.
The rest of the article is divided into three sections: the first one deals with the definition of the system and the computational techniques used, in the second the results are presented and discussed with respect to experimental observations, and finally, in the third section we summarize and draw the main conclusions of this study.
2 Computational procedure
The calculations were based on the X-ray structures of ba3-CcO from Thermus thermophilus and aa3-CcO from Paracoccus denitrificans. The ba3 enzyme structure consists of three chains (A, B and C), two hemes (b and a3) and three atoms of Cu (the dinuclear CuA and CuB);21 whereas in the case of the aa3 structure the enzyme presents two chains (A and B), heme-a and heme-a3, three atoms of copper, one of magnesium and one of calcium.We have used the MD package of programs Tinker22 to construct the potential energy surfaces (PES) and to minimize the structures. We employed the parameters from the Amber99 FF23 for the protein matrix and the TIP3P model24 for water molecules. The active site, made up of around 100 atoms, consists of a heme-a3 with five-coordinated iron. The fifth axial ligand of Fe is His384 (for ba3) and His411 (for aa3) and CuB ligated to the residues His282, His283 and His233 (cross-linked to Tyr237) for ba3 and His325, His326 and His276 (cross-linked to Tyr280) for aa3 . The parameters for the active sites were taken from the Charmm27 FF,25 and further optimized by reproducing geometrical and spectroscopic results from DFT calculations of the active site (see Ref. 19 for ba3 and Ref. 26 for aa3).
The ligands were modelled with the following parameters. The equilibrium internuclear distances (in Å) are equal to 1.13, 1.15 and 1.12 for CO, NO and O2, respectively. The partial charges (in a.u.) were −0.05 and 0.05 for the CO carbon and oxygen atoms, respectively, and −0.03 and 0.03 for NO nitrogen and oxygen. For the Lennard–Jones parameters (ε and σ) we implemented the following atomic parameters: 0.086 kcal mol−1 and 3.4 Å for the C atom, 0.170 kcal mol−1 and 3.25 Å for the N atom, 0.104 kcal mol−1 and 2.96 Å for the O atoms and 0.439 kcal mol−1 and 4.05 Å for the Xe atom.
Although the fitting of the potential parameters of the active site was achieved by employing the Tinker software, the calculations for the total protein were performed with the MD package of programs DL_POLY.27 Care was taken to transfer the force fields from the Tinker to DL_POLY format: we properly modified the DL_POLY program in order to implement exactly the same potential functions in both programs. Most of the calculations were carried out in the EGI¶ European Grid computational infrastructure.28,29
After equilibrating the system at 300 K, 5 independent trajectories with different initial velocities were run up to 5 ns (for a total of 25 ns of simulation time) in a canonical ensemble, using the Berendsen thermostat,30 with a temperature-coupling constant equal to 0.1 ps.
A direct Coulomb sum was implemented to calculate long-range electrostatic potentials and all the non-bonded interactions were set to zero for interatomic distances greater than 12 Å. Storing configurations every 1 ps, a set of 25![[thin space (1/6-em)]](https://www.rsc.org/images/entities/char_2009.gif) 000 structures was obtained to calculate probability distributions (see Appendix). In the case of ba3 the root mean square deviation was 2.39 Å for the backbone and 1.54 Å for a sphere centred at heme-a3 Fe and with a radius of 20 Å after analysing one trajectory.
000 structures was obtained to calculate probability distributions (see Appendix). In the case of ba3 the root mean square deviation was 2.39 Å for the backbone and 1.54 Å for a sphere centred at heme-a3 Fe and with a radius of 20 Å after analysing one trajectory.
The free energies are expressed as functions of the three Cartesian coordinates, (x,y,z), of the center of mass of the ligand and averaged over the two orientation angles (62 rotational configurations in total) of the diatom. For ba3 we explore a box of dimensions 28 × 28 × 10 Å3 centered at the iron atom of heme-a3. The grid points in each dimension are separated by 0.5 Å. The x,y plane coincides with the plane of the heme and it is oriented so as to have the x axis along the bisector of ring-A–Fe–ring-D angle and the y axis along the bisector of ring-D–Fe–ring-C angle. Instead, in the case of aa3 , we have considered a volume of dimensions 38 × 38 ×10 Å3. In calculating the free energies we re-define the grid of points for every snapshot according to the current orientation of the heme plane.
In order to test the suitability of the method we adopted the formula derived by Cohen et al.5 as given below:
 | (4) |
For simplicity and to achieve better statistics, the environment was replaced with a uniform box of water molecules. Following this procedure we placed a single copy of the three diatomic ligands and xenon each in a cube full of water molecules (58 × 58 × 58 Å3 large) and, after minimising and equilibrating the system at 300 K, we ran a 500 ps MD simulation in a canonical ensemble. The TIP3P water model was used as implemented in the Amber99 FF of the Tinker package, no constraints were applied to bonds involving hydrogen atoms, a time step of 0.5 fs was used and all diatomic ligands were treated as rigid rotors. The interaction energy values were collected every 1 ps, so that we had 500 values to derive the averages, which are the following: −1.82, −1.77, −1.56 and −2.254 kcal mol−1 for CO, NO, O2 and Xe, respectively, whereas the errors are 0.4, 0.2, 0.05 and 0.4 kcal mol−1, respectively. Other simulation parameters were set at the values given above.
Implementing eqn (4), we are able to evaluate the errors on the free energy. For instance, considering 5000 microstates of the lone protein derived from one trajectory and CO as ligand, which has the most attractive interaction energy among the diatoms, Vopt, if we obtained a free energy value of −1.0 kcal mol−1 the error would be about 0.0005 kcal mol−1, with a free energy of 3.0 and 5.0 kcal mol−1 it would be 0.3 and 1.7 kcal mol−1, respectively, and so on.
3 Results and discussion
The free energy has been calculated in a three dimensional grid of points that describes the binuclear active site of ba3 and aa3 enzymes interacting with CO, NO, O2 and Xe. The exploration of the topographical characteristics of the surfaces is done by employing the VMD graphics package.31 Two representative pictures for the O2 ligand are shown in Fig. 1 and Fig. 2 for ba3 and aa3 , respectively. We distinguish the cavities (low energy regions), that are common to both proteins, DP (distal pocket), Xe1 and W1, in spite of their differences in residues and metals. However, differences are also found such as the Xe2 and Xe3 cavities in aa3-CcO belonging to the third channel close to the hydroxyfarnesilethyl group and they are discussed in the next subsections. For ba3-CcO we can see a cavity above ring-B, but no pathway of this cavity to the copper was located.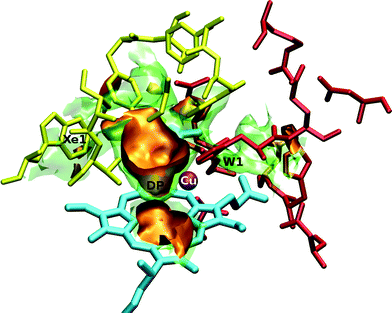 | ||
| Fig. 1 Three-dimensional view of the ba3-CcO active site interacting with the O2 ligand. The orange surfaces correspond to a free energy isovalue of −1.8 kcal mol−1 and the transparent green ones correspond to −0.4 kcal mol−1. The yellow residues depict the hydrophobic Xe1 cavity, while the red residues depict the hydrophilic W1 cavity. Iron atom is displayed in green (but hidden by the orange isosurface), copper in purple and the heme-a3 is represented in cyan. | ||
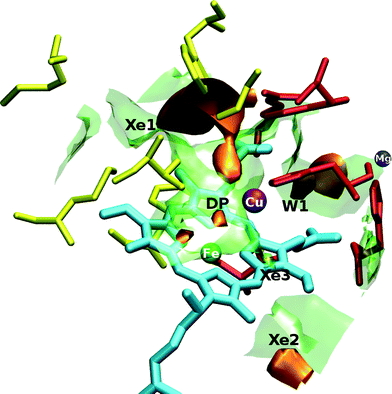 | ||
| Fig. 2 Three-dimensional view of the active site of aa3-CcO interacting with the O2 ligand. The orange surfaces correspond to a free energy isovalue of −0.85 kcal mol−1 and the transparent green ones correspond to 1.6 kcal mol−1. The yellow residues depict the hydrophobic Xe1 cavity and the red ones depict the hydrophilic W1 cavity. Xe2 and Xe3 cavities belonging to the channel accounted as the third one in the text and close to the hydroxyfarnesilethyl group are also shown. Iron atom is displayed in green, copper in purple, magnesium in blue and the heme-a3 is represented in cyan. | ||
3.1 ba 3-CcO
In Fig. 3 the two dimensional contour plots derived by averaging the free energy along the z axis in the range of [0.0,4.5] Å are shown for the three ligands (a) CO, (b) NO and (c) O2, as well as for (d) the Xe atom. Three docking sites are visible around the active site in all four systems. The first is inside the heme distal pocket (above ring-D), called DP cavity, and for CO it matches the “inner cavity” found in our previous work;19 the second is outside the heme-a3 pocket, which is the “outer cavity” in our previous publication19 and it coincides with the so-called Xe1 docking site of Ref. 32. The third docking site resides between the two propionate groups A and D, designated as “water pocket” (W1).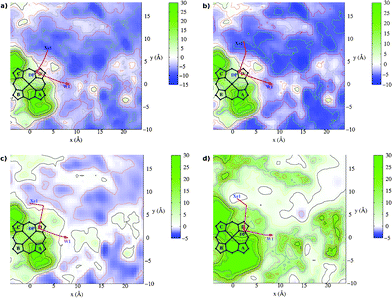 | ||
| Fig. 3 Free energy contour plots for the ba3-ligand systems. The contours represent free energy values (kcal mol−1) averaged along the z coordinate. The origin of the coordinates system is on the Fe atom and the heme lies on the x,y plane. Panel (a) CO, (b) NO, (c) O2 and (d) Xe. The red arrows indicate schematically the pathways to enter and to exit the active site. | ||
As has already inferred in the literature, molecular oxygen enters the binuclear center from the Xe1 cavity, characterized as hydrophobic, since it is essentially bounded by amino acids with non-polar side chains: Tyr133, Thr134, Phe228, Trp229, Gly232, Ile235, Val236 and Trp239. Upon reduction of O2, the produced water leaves the active site from the DP cavity towards the third cavity between the propionates, which coincides with a water pocket.33 This pocket is well conserved among all the cytochrome c oxidase enzymes and it is connected to the periplasmatic side of the membrane via chains of positively and negatively charged residues.
Following the nomenclature of Ref. 34, two pathways originate at this pocket (W1) connected to the solvent: the channel-R for ejecting the produced water molecule and the protons pathway (to pump the protons to the P-side of the membrane) in proximity to CuA. W1 is characterized as hydrophilic, since it is surrounded by amino acids with polar and charged side chains: Gln151, Arg225, His283, Gln284, Asp287, Asp372, His376, Asn377, Arg449, Arg450 and Glu126 (of B chain) as well as the propionates.
The calculations also provide the barriers that the ligands have to overcome passing from one docking site to the other, as depicted in Fig. 4. The plotted curves clearly show the differences between polar (CO, NO) and non-polar (O2, Xe) gases. At the hydrophobic channel (right), CO and NO reside at a deeper minimum and they have to overcome higher barriers in order to get into the binuclear active site, whereas O2 and Xe can migrate more easily from the Xe1 to DP and vice versa. Escaping from the active site (hydrophilic channel), all the ligands and Xe, except oxygen, encounter quite significant barriers. This trend is explained in terms of two contributions: the Coulomb interactions and steric effects. The former reflects the increased work that a polar ligand needs to do in order to pass through a space of positive and negative charged atoms and the latter reflects the volume sizes of these atoms.
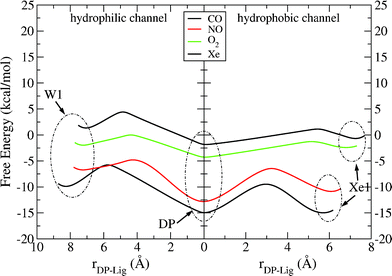 | ||
| Fig. 4 Free energy profiles for the entrance of the ligand into the binuclear center through the hydrophobic channel and its exit through the hydrophilic channel in ba3-ligand systems. The origin of the reaction coordinate (rDP – Lig) is placed at the minimum of DP cavity. | ||
Results obtained by the run of a single trajectory of 5 ns have been plotted to see how they are compared with the five trajectories’ averages and are given in the supplementary information. As is expected, better convergence is found for the minima than for the saddles. In Figure 4(SI),† the dashed curves are derived by neglecting the charges on CO and NO and, indeed, they show smaller barriers to overcome (from DP to W1), though still quite high, which means that the largest contribution is due to steric effects. On the same line, we observe that for Xe and O2, where the Coulomb interactions are absent, the barrier for xenon is the highest among the four ligands while for oxygen it is the smallest. The steric hindrance, which is large for xenon, is damped for dioxygen because of its rotational degrees of freedom, which permit oxygen to overcome the barriers more easily (the diameter of the Xe atom is as large as the bond of the O2 molecule). As a matter of fact, the overall smoothing of the barriers for all the ligands (and remarkably for the Xe atom), passing from one trajectory calculation to five, can be ascribed to the natural thermal fluctuations of the protein side chains, which are responsible for creating dynamical pathways through which the ligands can migrate inside the protein matrix, as demonstrated by Ruscio et al.35.
The location of the stationary points of the FES along isomerization pathways allows one to estimate the rate constants (and lifetimes) from the formula:
 | (5) |
| ligand | ΔG‡Xe1 → DP | ΔGXe1 → DP | τ Xe1 → DP (ns) |
|---|---|---|---|
| CO | 5.5 | 0.0099 | 1.6 |
| NO | 4.4 | −1.95 | 0.26 |
| O2 | 1.1 | −1.8 | 0.001 |
| Xe | 1.8 | −1.1 | 0.003 |
| ligand | ΔG‡DP → W1 | ΔGDP → W1 | τ DP → W1 (ns) |
|---|---|---|---|
| CO | 9.2 | 5.1 | 805 |
| NO | 8.0 | 6.1 | 108 |
| O2 | 4.3 | 2.3 | 0.2 |
| Xe | 6.2 | 3.2 | 5.6 |
One should consider this kinetics information as semi-quantitative, due to the fact that there are limitations inherent to the free energy formalism. Specifically, among the evaluated extrema, only the minima have a more solid meaning, whilst the barriers along a particular reaction coordinate might not correspond to the actual transition states. Furthermore, there are limitations led by the mapping itself, in that tracing a pathway that goes from one point to another, one has to visit all the intermediate points.
3.2 aa 3-CcO
Similarly to ba3 in the case of aa3 oxidase (see Fig. 5) we found the hydrophobic Xe1 cavity, surrounded by the residues Trp164, Val279, Phe412, Met99, Gly275, Met416 and ring-D methyl group, and a water exit cavity, W1, which is located between the A and D propionates and is formed by the residues His403, His326, Trp272, Ala330, Arg473, Prop-A and Prop-D. This cavity is connected to the important and well conserved magnesium cavity and it is considered the doorstep for the produced water molecules towards the P-side of the membrane.34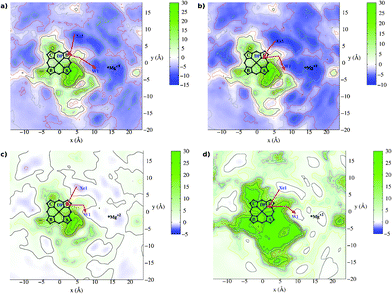 | ||
| Fig. 5 Free energy contour plots for the aa3-ligand systems. The contours represent free energy values (kcal mol−1) averaged along the z coordinate. The origin of the coordinates system is on Fe atom and the heme lies on the x,y plane. Panel (a) CO, (b) NO, (c) O2 and (d) Xe. The red arrows indicate schematically the pathways to enter and to exit the active site. | ||
We have also found one cavity in aa3 , which corresponds to the DP cavity of ba3 , placed approximately above ring-D and surrounded by Val279, Gly275, Prop-D, ring-D methyl, ring-C ethyl, Tyr280, His276 and His326.
In Ref. 38, a study of CcO from bovine heart, the authors propose three channels through which oxygen can migrate to the binuclear center: a) a channel almost perpendicular to heme-a3, originated at the lipid bilayer membrane “above” heme-a3 and ending at CuB ; b) a channel that originates at the lipidic surface of subunit III and ends at a very well known hydrophobic cavity near the binuclear center;39,40 c) a third channel which involves the area near hydroxyfarnesilethyl group attached to the ring-B of heme-a3.
To the best of our knowledge, in previous works the researchers have mainly studied the second channel (b).39–42 In Fig. 5 we can observe the ending part of this pathway, which is the cavity named Xe1, and it is a well established entrance for the gas to the binuclear center. Besides, we can clearly distinguish a shorter channel near the hydroxyfarnesilethyl area that originates at the contact region between the lipid bilayers (hydrophobic environment well adapted to host dioxygen gas) and the enzyme. This channel consists mainly of two cavities: Xe2 (formed by Met341, Val388, Met345 and Thr344 residues and ring-B methyl) and Xe3 (see Fig. 2). Although this channel is shorter in length, it can not be considered as the most favorable channel because of kinetic and thermodynamic reasons (further discussions below).
In Fig. 6 we draw the possible pathways for the ligands to react with CuB and the putative water exit. We can observe that there are big differences between polar and non-polar ligands as in the case of ba3, but the barriers to reach the DP cavity from Xe1 are generally similar to ba3 systems (except of Xe atom). On the other hand, in the case of aa3 we find bigger barriers on the way out of the active site to the external W1 pocket (apart from O2 ligand), as we can observe from the hydrophilic channel shown in Fig. 6.
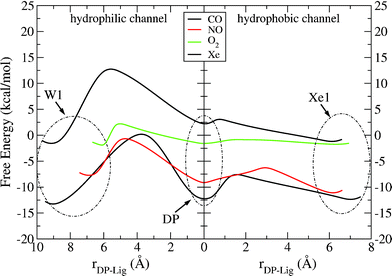 | ||
| Fig. 6 Free energy profiles for the entrance of the ligand into the binuclear center through the hydrophobic channel and its exit through the hydrophilic channel in protein–ligand systems. The origin of the reaction coordinate (rDP – Lig) is placed at the minimum of the DP cavity. | ||
In Tables 3 and 4, activation free energies, free energy differences between the minima and lifetimes are tabulated for the considered hydrophobic/hydrophilic channels. It is fairly noticeable that the values are generally close to those produced for ba3 and that for oxygen we get the smallest barrier (and lifetime, τXe1 → DP = 0.7 ps) to reach DP. Because of the calculated huge barriers, it is very difficult for CO and Xe to reach W1 from DP.
| ligand | ΔG‡Xe1 → DP | ΔGXe1 → DP | τ Xe1 → DP (ns) |
|---|---|---|---|
| CO | 4.8 | 0.14 | 0.47 |
| NO | 4.8 | 1.95 | 0.52 |
| O2 | 0.9 | 0.16 | 0.0007 |
| Xe | 4.0 | 3.4 | 0.13 |
| ligand | ΔG‡DP → W1 | ΔGDP → W1 | τ DP → W1 (ns) |
|---|---|---|---|
| CO | 12.4 | −1.0 | 178![[thin space (1/6-em)]](https://www.rsc.org/images/entities/char_2009.gif) 714 714 |
| NO | 8.5 | 1.4 | 233 |
| O2 | 3.8 | −0.3 | 0.088 |
| Xe | 10.5 | −3.8 | 7309 |
3.3 Ligand kinetics
From Tables 1 and 3, one can deduce that in the ba3-O2 system the time for oxygen to reach DP from Xe1 is 1 ps, whereas, in the aa3 case, this time is 0.7 ps. It has been demonstrated that ligands, in order to react at the fully reduced active site, bind CuB first and then coordinate to heme-a3.43 This means that the ligand follows a pathway that brings it directly and efficiently onto copper.From the above times, one can assume that the channel allowing oxygen to reach the active site (actually the DP cavity) is more favorable in aa3 than in ba3 in terms of kinetics. However, from a thermodynamic point of view, the difference of free energy gives a higher affinity for oxygen to the DP pocket of ba3 , since for aa3 ΔGXe → DP = 0.16 kcal mol−1 whereas for ba3 ΔGXe1 → DP = −1.8 kcal mol−1. This entails the fact that, at equilibrium, a higher concentration of oxygen in the ba3 DP cavity can be achieved. We might then speculate that the ba3 enzyme can pre-concentrate O2 in the DP cavity, in order to be able to reduce a higher number of dioxygen molecules in the required time. So, it functions efficiently, primarily, by accumulating more dioxygen molecules in the DP cavity.
In previous works21,32,42 it has been proposed that ba3-CcO from Thermus Thermophilus should have a channel that lets oxygen reach the active site more directly and without many impediments from the exterior space, since it is produced by a bacterium that lives in poor oxygen environments. In fact, the enzyme lacks an important proton D-pathway residue, well conserved among the cytochrome c oxidase group: the Glu278 (P. denitrificans numbering). In its place there is a highly hydrophobic residue, the above mentioned Ile235, which presents quite a high affinity for oxygen.
In the next two subsections a comparison with kinetics experimental results follows. This could be done only for CO and NO ligands, in that these are the only ones to be either Raman or IR active.
From the outcomes of the present work, which refer only to the deprotonated propionate D species, we can propose with higher certainty that CO can be sheltered in the DP cavity (B1 state), and it is later funnelled to the Xe1 cavity (B0 state). The process exerts a barrier of ca. 6 kcal mol−1 (DP → Xe1 in Fig. 4), which corresponds to a few nanoseconds, which is a lifetime consistent with the experimental result.37
For the aa3-CO system we refer to the work of Pinakoulaki et al.45 In this work, they observed that CO-recombination to heme-a3 occurs at about 20 ms.
Based on our results, we may argue that in the aa3 case the second NO molecule could be either bound to CuB or accommodated in the DP docking site. We also propose that the second time phase can be due to NO sheltered in Xe1 (after diffusing along some internal channels), since the time needed to reach DP from this location is 0.52 ns (τXe1 → DP).
In the case of ba3, a candidate docking site for NO is Xe1, from which 80% of the molecule reaches the DP cavity in around 0.26 ns (and then it binds CuB), while the other 20% binds iron after exploring other regions of the protein on the microsecond time scale.
4 Conclusions
By employing thermodynamic perturbation theory we have calculated the free energy surfaces of two types of cytochrome c oxidases, ba3 and aa3 , interacting with polar (CO, NO) and non-polar (O2) diatomic molecules as well as a xenon atom. The free energy surfaces have been constructed as functions of the center of mass of the diatomic molecules by taking into account van der Waals and Coulomb interactions. We have explored the cavities and migration channels of the distal active site of heme-a3 and the near surrounding region. We have found well conserved cavities (DP, Xe1 and W1) for both enzymes and all interacting species. By locating the most favorable isomerization pathways and their free energy barriers we estimate the times of the intermediate migration out/in of the active site. Furthermore, by assigning spectroscopic intermediate states to these cavities, we have argued that the times we estimate do not contradict current experimentally proposed values.The validity of the perturbation theory is based on two assumptions; i) the interaction of the ligand with the protein is weak, and ii) the sampled microstates of the unperturbed protein guarantee converged results. Comparison of the present thermodynamic perturbation calculations with previous results from MD of the photodissociated CO from ba3-CcO19 indicates that the first assumption is satisfied. In MD calculations we have run hundreds of 100 ps long trajectories and we have shown that CO is accumulated above ring-D of heme-a3 (DP cavity), and after escaping into the outer region CO preferentially populates the Xe1 cavity. However, it is more difficult to check the second assumption. Comparison of the FESs by averaging over 5 ns Boltzmann sampling (one trajectory) with the 25 ns one shows no significant differences for the minima but differences in the energy of the barriers; this behaviour can be attributed to the spontaneous thermal fluctuations, which are able to open certain gates in the protein matrix. Nevertheless, the trends remain the same. From the calculations on myoglobin interacting with the same gas ligand molecules in Ref. 5, the authors have drawn the same conclusions for the cavities found in several mutants of the protein. As it is also expected from the biological evolution of the proteins, structural stability of the area around the active site of the proteins is confirmed.
In the present work we have restricted the calculations to the inner part of the enzyme. Future work is planned to calculate the free energy for the protein immersed in the membrane to consider the channels/cavities of the whole protein and into a bulk explicit solvent. Furthermore, more accurate evaluation of the free energy differences are planned via the so called multiple thermodynamic perturbation theory, in which the interaction potential is expressed in terms of a control parameter λ48 which varies from 0 to 1, as described in the Appendix.
Appendix: thermodynamic perturbation theory for computing protein–ligand free energy hypersurfaces
Herein, details of thermodynamic perturbation theory1 as is applied in cytochrome c oxidase enzymes interacting with small gas molecules are presented. The protein–ligand system is described by the Hamiltonian| H(q,p,r,ps,r,pr) = H0(q,p) + K(ps,pr) + V(q,s,r) | (6) |
| r → ∞, V(q,s,r∞) = 0 | (7) |
| A(r) = −kBTIn[Q(r)] | (8) |
 | (9) |
At r∞ and assuming the same kinetic term K(ps, pr) the partition function is given by the equation
 | (10) |
The free energy difference is then written as
 | (11) |
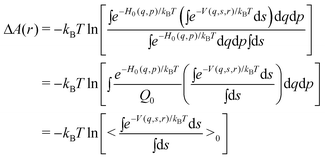 | (12) |
Thus,
| ΔA(r) = −kBTIn [<U(q,r)>0] | (13) |
 | (14) |
 | (15) |
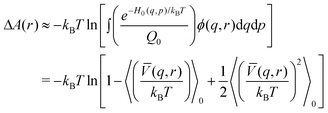 | (16) |
![[V with combining macron]](https://www.rsc.org/images/entities/i_char_0056_0304.gif) denotes the average interaction term with respect to s. Expanding the logarithm in a series and keeping first and second order terms we get
denotes the average interaction term with respect to s. Expanding the logarithm in a series and keeping first and second order terms we get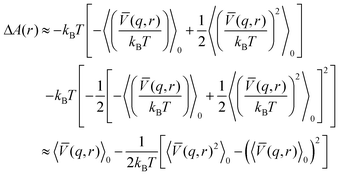 | (17) |
 | (18) |
We conclude that the second order correction term is always negative and the free energy decreases.
An improvement of the above theory can be achieved if we write the perturbing potential to depend on a parameter λ
| Hλ = H0 + Vλ | (19) |
 | (20) |
 | (21) |
The ensemble averages (<>λ) are obtained from simulations of hybrid systems, that of a protein interacting with the ligand constrained at r and perturbation term, Vλ(q, s, r). Obviously, even using only one hybrid system (λ = 0.5) the amount of simulations needed is at least equal to the number of grid points on which the FES is represented.
Acknowledgements
We are grateful to Prof. Constantinos Varotsis for stimulating discussions and to Dr Stamatis Stamatiadis and Manos Giatromanolakis for their computational assistance. The present work was financially supported by the European Union ToK grant GRID-COMPCHEM (MTKD-CT-2005-029583). We also acknowledge the EGI European project for providing us with the necessary computational facilities, as well as the COST CMST D37 Action, GRIDCHEM.References
- Free Energy Calculations. Theory and Applications in Chemistry and Biology, ed. C. Chipot and A. Pohorille, Springer Verlag, Berlin, New York, 2007 Search PubMed.
- E. Darve, D. Rodrguez-Gómez and A. Pohorille, J. Chem. Phys., 2008, 128, 144120 CrossRef.
- S. C. Farantos, R. Schinke, H. Guo and M. Joyeux, Chem. Rev., 2009, 109, 4248–4271 CrossRef CAS.
- P. Kollman, Chem. Rev., 1993, 93, 2395–2417 CrossRef CAS.
- J. Cohen, A. Arkhipov, R. Braun and K. Schulten, Biophys. J., 2006, 91, 1844–1857 CrossRef CAS.
- N. Lu and D. A. Kofke, J. Chem. Phys., 2001, 114, 7303–7312 CrossRef CAS.
- G. T. Babcock and M. Wikström, Nature, 1992, 356, 301–309 CrossRef CAS.
- H. Michel, J. Behr, A. Harrenga and A. Kannt, Annu. Rev. Biophys. Biomol. Struct., 1998, 27, 329–356 CrossRef CAS.
- M. I. Verkhovsky, A. Jasaitis, M. L. Vekhovskaya, J. E. Morgan and M. Wikström, Nature, 1999, 400, 480–483 CrossRef CAS.
- D. R. Nutt and M. Meuwly, Biophys. J., 2003, 85, 3612–3623 CrossRef CAS.
- H. Frauenfelder, P. W. Fenimore and B. H. McMahon, Biophys. Chem., 2002, 98, 35–48 CrossRef CAS.
- J. Cohen, K. Kim, P. King, M. Seibert and K. Schulten, Structure, 2005, 13, 1321–1329 CrossRef CAS.
- C. Bossa, A. Amadei, I. Daidone, M. Anselmi, B. Vallone, M. Brunori and A. D. Nola, Biophys. J., 2005, 89, 465–474 CrossRef CAS.
- L. Salomonsson, A. Lee, R. B. Gennis, P. Brzezinski and D. C. Rees, Proc. Natl. Acad. Sci. U. S. A., 2004, 101, 11617–11621 CrossRef CAS.
- M. Svensson-Ek, J. Abramson, G. Larsson, S. Tornroth, P. Brzezinski and S. Iwata, J. Mol. Biol., 2002, 321, 329–339 CrossRef CAS.
- J. Treuffet, K. J. Kubarych, J.-C. Lambry, E. Pilet, J.-B. Masson, J. Martin, M. H. Vos, M. Joffre and A. Alexandrou, Proc. Natl. Acad. Sci. U. S. A., 2007, 104, 15705–15710 CrossRef CAS.
- M. H. Vos, Biochim. Biophys. Acta, Bioenerg., 2008, 1777, 15–31 CrossRef CAS.
- C. Koutsoupakis, T. Soulimane and C. Varotsis, J. Biol. Chem., 2003, 278, 36806–36809 CrossRef CAS.
- M. Porrini, V. Daskalakis, S. C. Farantos and C. Varotsis, J. Phys. Chem. B, 2009, 113, 12129–12135 CrossRef CAS.
- D. C. Rapaport, The Art of Molecular Dynamics Simulation, Cambridge University Press, 1995 Search PubMed.
- T. Soulimane, G. Buse, G. P. Bourenkov, H. D. Bartunik, R. Huber and M. E. Than, EMBO J., 2000, 19, 1766–1776 CrossRef CAS.
- J. W. Ponder, Tinker-Software Tools for Molecular Design, Department of Biochemistry and Molecular Biophysics, Washington University School of Medicine, 4th edn, 2004 Search PubMed.
- J. Wang, P. Cieplak and P. A. Kollman, J. Comput. Chem., 2000, 21, 1049–1074 CrossRef CAS.
- W. L. Jorgensen, J. Chandrasekhar, J. D. Madura, R. W. Impey and M. L. Kleins, J. Chem. Phys., 1983, 79, 926–935 CrossRef CAS.
- N. Foloppe and A. D. MacKerell, J. Comput. Chem., 2000, 21, 86–104 CrossRef CAS.
- V. Daskalakis, S. C. Farantos and C. Varotsis, J. Am. Chem. Soc., 2008, 130, 12385–12393 CrossRef CAS.
- W. Smith, T. R. Forester, I. T. Todorov and M. Leslie, The DL POLY Molecular Simulation Package, CSE Department, STFC Daresbury Laboratory, 4th edn, 2006 Search PubMed.
- European Grid Infrastructure (EGI), 2010 Search PubMed.
- V. Daskalakis, M. Giatromanolakis, M. Porrini, S. C. Farantos and O. Gervasi, in Computer Physics, chapter 4: Grid computing multiple shooting algorithms for extended phase space sampling and long time propagation in Molecular Dynamics, Nova Science Publishers, Inc., New York, 2012 Search PubMed.
- H. J. C. Berendsen, J. P. M. Postma, W. F. van Gunsteren, A. DiNola and J. R. Haak, J. Chem. Phys., 1984, 81, 3684–3690 CrossRef CAS.
- W. Humphrey, A. Dalke and K. Schulten, J. Mol. Graphics, 1996, 14, 33–38 CrossRef CAS.
- V. M. Luna, Y. Chen, J. A. Fee and C. D. Stout, Biochemistry, 2008, 47, 4657–4665 CrossRef CAS.
- B. Schmidt, J. McCracken and S. Ferguson-Miller, Proc. Natl. Acad. Sci. U. S. A., 2003, 100, 15539–15542 CrossRef CAS.
- R. Sugitani and A. A. Stuchebrukhov, Biochim. Biophys. Acta, Bioenerg., 2009, 1787, 1140–1150 CrossRef CAS.
- J. Z. Ruscio, D. Kumar, M. Shukla, M. G. Prisant, T. M. Murali and A. V. Onufriev, Proc. Natl. Acad. Sci. U. S. A., 2008, 105, 9204–9209 CrossRef CAS.
- C. Koutsoupakis, T. Soulimane and C. Varotsis, J. Am. Chem. Soc., 2003, 125, 14728–14732 CrossRef CAS.
- E. Pinakoulaki, T. Ohta, T. Soulimane, T. Kitagawa and C. Varotsis, J. Biol. Chem., 2004, 279, 22791–22794 CrossRef CAS.
- T. Tsukihara, H. Aoyama, E. Yamashita, T. Tomizaki, H. Yamaguchi, K. Shinzawa-Itoh, R. Nakashima, R. Yaono and S. Yoshikawa, Science, 1996, 272, 1136–1144 CAS.
- M. Wikström, M. I. Verkhovsky and G. Hummer, Biochim. Biophys. Acta, Bioenerg., 2003, 1604, 61–65 CrossRef.
- I. Hofacker and K. Schulten, Proteins: Struct., Funct., Genet., 1998, 30, 100–107 CrossRef CAS.
- S. Riistama, G. Hummer, A. Puustinen, R. Dyer, W. Woodruff and M. Wikström, FEBS Lett., 1997, 414, 275–280 CrossRef CAS.
- S. Riistama, A. Puustinen, A. García-Horsman, S. Iwata, H. Michel and M. Wikström, Biochim. Biophys. Acta, Bioenerg., 1996, 1275, 1–4 CrossRef.
- O. Einarsdóttir, R. B. Dyer, D. D. Lemon, P. M. Killough, S. M. Hubig, S. J. Atherton, J. J. Lopez-Garriga, G. Palmer and W. H. Woodruff, Biochemistry, 1993, 32, 12013–12024 CrossRef.
- G. Branden, M. Branden, B. Schmidt, D. A. Mills, S. Ferguson-Miller and P. Brzezinski, Biochemistry, 2005, 44, 10466–10474 CrossRef.
- E. Pinakoulaki and C. Varotsis, Biochemistry, 2003, 42, 14856–14861 CrossRef CAS.
- M. H. Vos, G. Lipowski, J. C. Lambry, J. L. Martin and U. Liebl, Biochemistry, 2001, 40, 7806–7811 CrossRef CAS.
- E. Pilet, W. Nitschke, F. Rappaport, T. Soulimane, J. C. Lambry, U. Liebl and M. H. Vos, Biochemistry, 2004, 43, 14118–14127 CrossRef CAS.
- W. L. Jorgensen and C. Ravimohan, J. Chem. Phys., 1985, 83, 3050–3050 CrossRef CAS.
Footnotes |
| † Electronic supplementary information (ESI) available. See DOI: 10.1039/c2ra20625k |
| ‡ Current Address: Institute for Condensed Matter and Complex Systems, School of Physics & Astronomy, The University of Edinburgh, James Clerk Maxwell Building, The King's Buildings, Mayfield Road, Edinburgh EH9 3JZ |
| § Current Address: Department of Environmental Science and Technology, Cyprus University of Technology, P.O. Box 50329, 3603 Lemesos, Cyprus. |
| ¶ EGI project is the successor of the former EGEE project funded by the European Union. The EGEE infrastructure was built on the EU Research Network GEANT. The infrastructure provides interoperability with other Grids around the world, including Israel, Russia, US and Asia, with the purpose of establishing a worldwide Grid infrastructure. |
| This journal is © The Royal Society of Chemistry 2012 |
