High performance lithium-ion cells using one dimensional electrospun TiO2 nanofibers with spinel cathode†
P.
Suresh Kumar‡
a,
V.
Aravindan‡
b,
J.
Sundaramurthy‡
a,
V.
Thavasi
c,
S.G.
Mhaisalkar
ab,
Seeram
Ramakrishna
*d and
S.
Madhavi
*ab
aSchool of Materials Science and Engineering, Nanyang Technological University, Singapore 639798, Singapore. E-mail: Madhavi@ntu.edu.sg
bEnergy Research Institute@NTU (ERI@N), Nanyang Technological University, Research Techno Plaza, 50 Nanyang Drive, Singapore 637553, Singapore. E-mail: aravind_van@yahoo.com
cNUS Nanoscience and Nanotechnology Initiative, National University of Singapore, Singapore 117576
dMechanical Engineering, National University of Singapore, Singapore 117576, Singapore. E-mail: seeram@nus.edu.sg
First published on 10th July 2012
Abstract
Eco-friendly, high performance lithium-ion cells (LiMn2O4/TiO2) are fabricated using electrospun one dimensional anatase phase TiO2 nanofibers. The cells deliver an initial discharge capacity of ∼104 mAh g−1 (at 1 C) with an operating potential of ∼2.1 V and stay stable for up to 100 cycles with limited capacity fading.
Nano-architectured materials have emerged as attractive alternatives to conventional (bulk or micron size) materials by virtue of their unique electronic, chemical, physical and electrochemical properties, which has created increasing interest in their applications in electrochemical energy storage devices, particularly as electrode materials for lithium-ion batteries (LIBs).1–4 The advantages of using such nano-structured electrode materials are faster Li-ion diffusion and electron transport as well as good contact towards current collectors, and highly exposed area towards electrolytes, which facilitates a higher Li-ion flux across the electrode/electrolyte interface.5–7 Carbonaceous materials (for example, graphite) conquered the LIB industries as an anode especially for portable applications, since the commercialization of LIBs by Sony in 1991. They exhibited excellent properties as negative electrodes in lower operating potentials (<0.25 V vs. Li) with good cycleability, appreciable capacity (372 mAh g−1) and eco-friendliness. Further, the use of such anodes in commercial cells provides some additional benefits which includes: higher operating potential (∼4 V), high energy density (∼150 Wh kg−1 and ∼400 Wh dm−3), and high coloumbic efficiency (>95%).8,9 Nevertheless, owing to the processing costs for graphitic anodes, durability and safety issues, the large-scale application of state-of-the-art LIBs particularly for electric vehicle (EV) and hybrid-electric vehicles (HEV) are limited. The operating potential (<0.25 V vs. Li) of carbonaceous anodes is very close to that of metallic lithium, leading to unavoidable dendrite formation resulting in internal short circuiting of the cell, especially at high current operations. Moreover, at lower potentials electrolyte decomposition occurs and consequently a solid electrolyte interphase (SEI) forms on the anode surface, which results in charge consumption and evolution of dangerous gas during the first insertion of Li.10 Hence, to circumvent the limitations of carbonaceous anodes, new alternative low potential (vs. Li) insertion hosts such as anatase-TiO2 and Li4Ti5O12 have been proposed as promising materials for LIBs.11 One of the major advantages of these anodes in practical LIBs is that there is no SEI formation since the Li-insertion/extraction potential falls within thermodynamic stability (>0.8 V vs. Li) of the conventional electrolyte solutions (carbonate based). However, a slightly higher Li-insertion potential (>1.5 V vs. Li) than graphite certainly provides a decrease in the energy density of the Li-ion power packs. Among the materials proposed, Li4Ti5O12 seems promising from a cycle life point of view, however suffers from drawbacks such as restricted capacity (theoretical capacity is 170 mAh g−1), poor diffusion co-efficient (<10−6 cm2 s−1) and inherent electronic conductivity (<10−13 S cm−2).12,13 On the other hand, anatase-TiO2 exhibits a higher theoretical capacity (335 mAh g−1) providing enhanced volumetric energy density than Li4Ti5O12. Hence, an attempt has been made to develop one dimensional TiO2 nanofibers using the electrospinning technique;14 such fibrous nanostructures can enable facile insertion and extraction of Li-ions especially at high current rates. The prepared TiO2 nanofibers were studied in half-cell configuration (Li/TiO2) and subsequently adopted along with commercial LiMn2O4 as the cathode in a full-cell (LiMn2O4) at high current density of 150 mA g−1 in both cases and presented.
Titanium(IV) isopropoxide (99%) and N, N-dimethyl formamide (DMF, 99.8%), polyvinyl acetate (PVAc, MW: 5 × 10⁵) and acetic acid (99.7%) were purchased from Aldrich and used without any further purification. In a typical synthesis, a sol–gel homogeneous solution was prepared by mixing 1.6 g of PVAc polymer into 10 ml DMF under constant stirring for an hour. 1.2 ml of titanium(IV) isopropoxide was then introduced drop by drop to the homogeneous solution followed by 0.6 ml of acetic acid under vigorous stirring for ∼10 h and maintained at neutral pH. The prepared sol–gel solution was then introduced into a 5 ml syringe (dia. of 11.9 mm) with 27 G stainless steel needle which has a diameter of 0.025 cm. The experiment has been carried out in a controlled electrospinning setup (ELECTROSPUNRA, Microtools Pvt. limited, and Singapore). The humidity level of the synthesis electrospinning chamber was maintained at about 40% for the whole experimental process. The distance between needle and static collector (aluminium foil) was maintained at 12 cm with an applied AC voltage of 17.5 kV and at a flow rate of 1 ml h−1 using a syringe pump (KDS 200). The composite TiO2/PVAc fibers were obtained which were then annealed at 500 °C for 1 h with a ramping rate of 5 °C min−1 at a pressure of 1 mbar using a carbolite furnace which putrefies the PVAc polymer into TiO2 nanofibers.14 Structural properties were studied using X-ray diffraction (Bruker AXS, D8 Advance) equipped with Cu-Kα radiation. Rietveld refinement was conducted using Topas V3 software for the obtained patterns. The surface morphologies of the samples were characterized by a field emission scanning electron microscope (FE-SEM, JEOL JSM). A transmission electron microscope (TEM, JEM-2010, JEOL USA Inc.) was employed to investigate the internal structure of TiO2 nanofibers. The electrochemical studies were performed using standard CR 2016 coin-cell configurations. A detailed description of the electrode preparation is given elsewhere.15 In brief, the composite electrodes were formulated with exactly 20 mg of active material, 3 mg of super P, and 3 mg of conductive binder (Teflonized acetylene black, TAB). It was pressed on a 200 mm2 stainless steel mesh, which was served as current collector under a pressure of 300 kg cm−2 and dried at 60 °C overnight. The 1 M LiPF6 in ethylene carbonate (EC)/diethyl carbonate (DEC) (1![[thin space (1/6-em)]](https://www.rsc.org/images/entities/char_2009.gif) :
:![[thin space (1/6-em)]](https://www.rsc.org/images/entities/char_2009.gif) 1 wt%, DAN VEC) mixture was used as the electrolyte solution. Cyclic voltammograms (CV) were recorded using Solartron, 1470E and SI 1255B Impedance/gain-phase analyzer coupled with a potentiostat in a two electrode configuration. Galvanostatic cycling performances were recorded at a constant current density of 150 mA g−1 for both half and full cell configurations using an Arbin 2000 battery tester at room temperature.
1 wt%, DAN VEC) mixture was used as the electrolyte solution. Cyclic voltammograms (CV) were recorded using Solartron, 1470E and SI 1255B Impedance/gain-phase analyzer coupled with a potentiostat in a two electrode configuration. Galvanostatic cycling performances were recorded at a constant current density of 150 mA g−1 for both half and full cell configurations using an Arbin 2000 battery tester at room temperature.
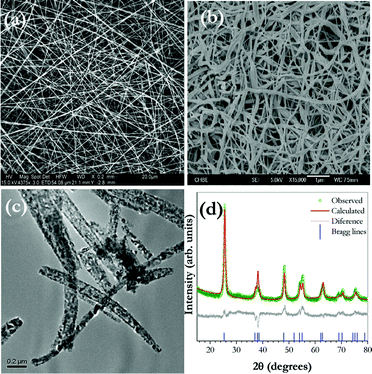
Fig. 1(a–b) shows the surface morphology of as-prepared composite TiO2/PVAc fibers and the corresponding annealed TiO2 nanofibers at 500 °C. The FE-SEM image of as-prepared samples shows the formation of a highly interconnected network composite TiO2/PVAc nanofibers with average diameters of about 100–250 nm (Fig. 1(a)). For annealed samples at 500 °C, the formation of a pure TiO2 phase with a fibrous morphology, even after the decomposition of PVAc polymer with diameters 50–100 nm is shown in Fig. 1 (b). The TEM picture reflects the internal structure of the TiO2 fiber which is composed of ultrafine crystallite particles (∼15 nm calculated from the Scherrer formula) embedded in the individual fibers. We believe that such a unique morphology will facilitate faster diffusion of Li-ions during the electrochemical reaction and enables a higher contact area towards the electrode/electrolyte interface. It is well known that, Li-ion insertion is more facile in the anatase TiO2 matrix than other phases of TiO2. As far as the structural features of anatase TiO2 are concerned, it contains a tetragonal body-centered type arrangement with the space group I41/amd, and comprises TiO6 octahedra sharing two adjacent edges with two other octahedra, so that planar double chains are formed. In this framework, Li-ions diffused along a reaction path connecting the octahedral interstitial sites.16Fig. 1d represents the powder X-ray diffraction pattern (XRD) of anatase TiO2 nanofibers sintered at 500 °C. The XRD reflections exhibited a strong diffraction peak at 25.12° which corresponds to a (101) orientation of TiO2 fibers. No additional residual impurities or rutile phase were detected suggesting the pure crystalline anatase TiO2 phase was formed. The collected XRD pattern was subjected to Rietveld refinement and the lattice parameter values are calculated (a = 3.786(6) Å and c = 9.477(9) Å) and it is consistent with the literature values (JCPDS#21-1272).
 | ||
| Fig. 1 SEM image of (a) as-spun anatase TiO2 nanofibers, (b) TiO2 nanofibers annealed at 500 °C for 1 h (c) TEM images of sintered fibers and (d) Rietveld refined powder X-ray diffraction pattern of TiO2 nanofibers sintered at 500 °C. | ||
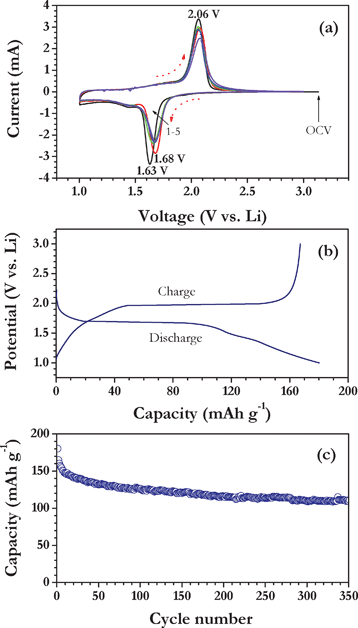
Fig. 2a illustrates the CV traces of Li/TiO2 nanofiber half-cells for the first five cycles between 1–3 V at a scan rate of 0.1 mV s−1, in which metallic lithium act as both counter and reference electrode. The Li/TiO2 nanofiber cell showed the open circuit voltage (OCV) of ∼3.1 V vs. Li and the cell was first discharged to insert the Li into TiO2 by reducing Ti4+ to Ti3+. The cell showed the reduction potential at 1.63 V and subsequently oxidized at 2.06 V vs. Li. The sharp reduction and oxidation reactions indicate the insertion and extraction of Li-ions with a two phase reaction mechanism. During reduction in the second cycle, a small deviation towards a higher potential was observed, which is due to the structural rearrangement of the TiO2 crystal system during Li-insertion and subsequent cycles there is such deviation is noted. It is obvious to notice that, CV curves showed excellent reversibility during reduction/oxidation according to the following two phase reaction mechanism,
| TiO2 + xLi+ + xe− ↔ LixTiO2 | (1) |
 | ||
| Fig. 2 (a) Cyclic voltammetric traces of Li/TiO2 nanofiber cell cycled between 1–3 V at a scan rate of 0.1 mV s−1, in which metallic lithium act as counter and reference electrode, (b) galvanostatic discharge-charge curves of Li/TiO2 nanofiber cell at 150 mA g−1 current density, and (c) plot of discharge capacity vs. cycle number. | ||
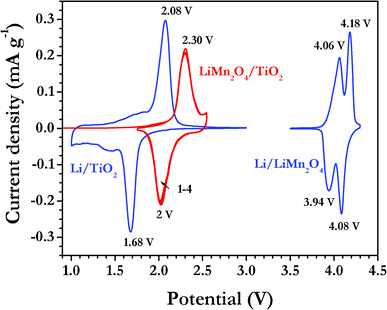
Fig. 3 depicts the family of CV traces for LiMn2O4/TiO2 nanofiber cell cycled between 1.75–2.55 V at the scan rate of 0.1 mV s−1 along with half-cell traces of individual components (LiMn2O4 and TiO2 nanofibers). The LiMn2O4/TiO2 nanofiber cell displayed an OCV of ∼130 mV and charged first to extract Li-ions from the cathode and simultaneous insertion in to the anatase TiO2 nanofiber anode according to the following equation,
| LiMn2O4 + TiO2 ↔ 2 λ-MnO2 + LiTiO2 | (2) |
![[thin space (1/6-em)]](https://www.rsc.org/images/entities/char_2009.gif) :
:![[thin space (1/6-em)]](https://www.rsc.org/images/entities/char_2009.gif) 1.64 ratio.
1.64 ratio.
 | ||
| Fig. 3 Family of cyclic voltammograms of LiMn2O4/TiO2 nanofiber cell cycled between 1.75–2.55 V at the scan rate of 0.1 mV s−1. The blue colour line indicates the CV signatures of Li/TiO2 nanofiber and Li/LiMn2O4 cells for comparison and recorded in the same conditions. | ||
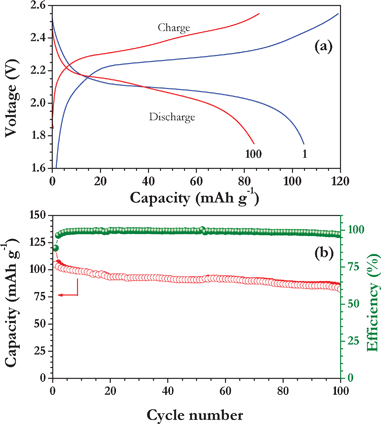
Fig. 4a represents the galvanostatic cycling performance of a full cell, LiMn2O4/TiO2 nanofiber cycled between 1.75–2.55 V at constant current density of 150 mA g−1 in room temperature. The freshly made LiMn2O4/TiO2 nanofiber cell showed an OCV of ∼100 mV and it is charged to an upper cut-off potential (2.55 V) to extract Li-ions from the spinel LiMn2O4 cathode and simultaneously intercalate in to the TiO2 host. The full cell LiMn2O4/TiO2 delivered a capacity of ∼120 and ∼104 mAh g−1 at a current density of 150 mA g−1 for first charge and discharge, respectively. Here, specific capacity has been calculated based on the active material of cathode, hence the current density 150 mA g−1 has been assumed as 1 C. The cell exhibits a long, distinct plateau at ∼2.1 V during discharge and this potential region is consistent with CV traces obtained above (Fig. 3). The cycling profile of the LiMn2O4/TiO2 nanofiber cell is presented for up to 100 cycles in Fig. 4b with coulombic efficiency. The above full cell showed a coulombic efficiency over 99% (except a few initial cycles), which indicates an excellent reversibility of Li-ions during the charge–discharge process up to 100 cycles. However, the small amount of capacity fading (0.2 mAh g−1 per cycle) is noted during cycling with a capacity retention of over 81% even after 100 cycles at the current density of 150 mA g−1. The structural changes from tetragonal to orthorhombic phase in TiO2 electrodes during Li-insertion may be the main cause for such capacity fading. Nevertheless, a small amount of capacity fading observed from LiMn2O4 electrodes cannot be excluded (given in the ESI).† The superior performance of such cells is ascribed to the reduced diffusion pathways accessible from the one dimensional TiO2 fibers, high surface area and good contact towards the current collectors. Further studies are in progress to improve the energy density of the cell by minimizing the capacity fading through adopting surface coatings in both electrodes, utilizing custom-made cathodes, creating one dimensional nanostructures with porous structure and different morphologies, etc. Aravindan et al.25 reported the full-cell assembly of LiMn2O4/LiCrTiO4 and showed a capacity retention of 88% after 50 cycles at a current density of 15 mA g−1 with an operating potential of ∼2.5 V. Similarly, NASICON type LiTi2(PO4)3 anodes in full-cell assembly showed a capacity retention of 72% after 200 cycles at a current density of 150 mA g−1 with a working potential of ∼1.45 V reported by Aravindan et al.26 Choi et al.27 reported the performance of LiFePO4/anatare TiO2-graphene composite cell and displayed good cyclability of about 700 cycles at a 1 C rate.
 | ||
| Fig. 4 (a) Typical galvanostatic charge–discharge curves of LiMn2O4/TiO2 nanofiber cells cycled between 1.75–2.55 V at 150 mA g−1. Current density (1 C) in room temperature, and (b) plot of cycle number vs. capacity with coulombic efficiency, in which filled circles correspond to charge capacity and open circle correspond to discharge capacity. | ||
Conclusions
To conclude, a lithium-ion cell was fabricated using one dimensional anatase TiO2 nanofiber as the anode along with commercial spinel LiMn2O4 as the cathode. The LiMn2O4/TiO2 nanofiber cell delivered a discharge capacity of ∼104 mAh g−1 at a current density of 150 mA g−1 and 81% of this capacity was retained after 100 cycles. First, the electrospun anatase TiO2 fibers were tested against metallic lithium for the mass balance with spinel LiMn2O4 cathode. The Li/TiO2 nanofiber half-cell demonstrated excellent performance up to 350 cycles with low capacity fading and showed an initial discharge capacity of 180 mAh g−1 at a current density of 150 mA g−1.Acknowledgements
We thank National Research Foundation (NRF, Singapore) for financial support through Competitive Research Programme (CRP) (Grant No. NRF-CRP4-2008-03) and Clean Energy Research Project (CERP) (Grant No. NRF-2009-EWT-CERP001-036).References
- M. S. Whittingham, Proc. IEEE, 2012, 100, 1518–1534 CrossRef CAS.
- A. Manthiram, A. Vadivel Murugan, A. Sarkar and T. Muraliganth, Energy Environ. Sci., 2008, 1, 621–638 CAS.
- C. Liu, F. Li, L.-P. Ma and H.-M. Cheng, Adv. Mater., 2010, 22, E28–E62 CrossRef CAS.
- R. Pitchai, V. Thavasi, S. G. Mhaisalkar and S. Ramakrishna, J. Mater. Chem., 2011, 21, 11040–11051 RSC.
- P. G. Bruce, B. Scrosati and J.-M. Tarascon, Angew. Chem., Int. Ed., 2008, 47, 2930–2946 CrossRef CAS.
- A. S. Arico, P. Bruce, B. Scrosati, J.-M. Tarascon and W. van Schalkwijk, Nat. Mater., 2005, 4, 366–377 CrossRef CAS.
- C. R. Sides, N. Li, C. J. Patrissi, B. Scrosati and C. R. Martin, MRS Bull., 2002, 27, 604–607 CrossRef CAS.
- B. J. Landi, M. J. Ganter, C. D. Cress, R. A. DiLeo and R. P. Raffaelle, Energy Environ. Sci., 2009, 2, 638–654 CAS.
- N. A. Kaskhedikar and J. Maier, Adv. Mater., 2009, 21, 2664–2680 CrossRef CAS.
- V. Aravindan, J. Gnanaraj, S. Madhavi and H.-K. Liu, Chem.–Eur. J., 2011, 17, 14326–14346 CrossRef CAS.
- Z. Yang, D. Choi, S. Kerisit, K. M. Rosso, D. Wang, J. Zhang, G. Graff and J. Liu, J. Power Sources, 2009, 192, 588–598 CrossRef CAS.
- K. Naoi, S. Ishimoto, Y. Isobe and S. Aoyagi, J. Power Sources, 2010, 195, 6250–6254 CrossRef CAS.
- T.-F. Yi, L.-J. Jiang, J. Shu, C.-B. Yue, R.-S. Zhu and H.-B. Qiao, J. Phys. Chem. Solids, 2010, 71, 1236–1242 CrossRef CAS.
- P. S. Kumar, S. A. S. Nizar, J. Sundaramurthy, P. Ragupathy, V. Thavasi, S. G. Mhaisalkar and S. Ramakrishna, J. Mater. Chem., 2011, 21, 9784–9790 RSC.
- V. Aravindan, K. Karthikeyan, K. S. Kang, W. S. Yoon, W. S. Kim and Y. S. Lee, J. Mater. Chem., 2011, 21, 2470–2475 RSC.
- M. Wagemaker, A. A. van Well, G. J. Kearley and F. M. Mulder, Solid State Ionics, 2004, 175, 191–193 CrossRef CAS.
- M. Wagemaker, A. P. M. Kentjens and F. M. Mulder, Nature, 2002, 418, 397–399 CrossRef CAS.
- L.-F. Cui, Y. Yang, C.-M. Hsu and Y. Cui, Nano Lett., 2009, 9, 3370–3374 CrossRef CAS.
- G. Sudant, E. Baudrin, D. Larcher and J. M. Tarascon, Journal of Materials Chemistry, 2005, 15, 1263–1269 CAS.
- M. V. Reddy, R. Jose, T. H. Teng, B. V. R. Chowdari and S. Ramakrishna, Electrochim. Acta, 2010, 55, 3109–3117 CrossRef CAS.
- S. H. Nam, H.-S. Shim, Y.-S. Kim, M. A. Dar, J. G. Kim and W. B. Kim, ACS Appl. Mater. Interfaces, 2010, 2, 2046–2052 CAS.
- H. Han, T. Song, J.-Y. Bae, L. F. Nazar, H. Kim and U. Paik, Energy Environ. Sci., 2011, 4, 4532–4536 CAS.
- P. Zhu, Y. Wu, M. V. Reddy, A. Sreekumaran Nair, B. V. R. Chowdari and S. Ramakrishna, RSC Adv., 2012, 2, 531–537 RSC.
- H.-W. Lu, W. Zeng, Y.-S. Li and Z.-W. Fu, J. Power Sources, 2007, 164, 874–879 CrossRef CAS.
- V. Aravindan, W. Chuiling and S. Madhavi, ChemPhysChem, 2012 DOI:10.1002/cphc.201200398.
- V. Aravindan, W. Chuiling and S. Madhavi, RSC Adv., 2012 10.1039/c2ra20826a.
- D. Choi, D. Wang, V. V. Viswanathan, I.-T. Bae, W. Wang, Z. Nie, J.-G. Zhang, G. L. Graff, J. Liu, Z. Yang and T. Duong, Electrochem. Commun., 2010, 12, 378–381 CrossRef CAS.
Footnotes |
| † Electronic Supplementary Information (ESI) available: electrochemical performance of LiMn2O4 electrodes in half-cell configuration. See DOI: 10.1039/c2ra20645e/ |
| ‡ Authors contributed equally |
| This journal is © The Royal Society of Chemistry 2012 |
