Fe2O3 nanocluster-decorated graphene as O2 electrode for high energy Li–O2 batteries†
Wenyu
Zhang
ab,
Yi
Zeng
a,
Chen
Xu
ab,
Huiteng
Tan
ab,
Weiling
Liu
a,
Jixin
Zhu
a,
Ni
Xiao
a,
Huey Hoon
Hng
a,
Jan
Ma
a,
Harry E.
Hoster
b,
Rachid
Yazami
ab and
Qingyu
Yan
*abc
aSchool of Materials Science and Engineering, Nanyang Technological University, Singapore, 639798, Singapore. E-mail: alexyan@ntu.edu.sg; Fax: +65 6790 9081; Tel: +65 6790 4583
bTUM CREATE Research Centre@NTU, Nanyang Technological University, Singapore, 637459, Singapore
cEnergy Research Institute@NTU, Nanyang Technological University, Singapore, 637553, Singapore
First published on 26th July 2012
Abstract
Fe2O3 nanocluster-decorated graphene (Fe2O3/graphene) hybrids with controlled contents of Fe2O3 were prepared by a facile electrochemical process. These Fe2O3/graphene hybrids were tested as O2 electrodes for Li–O2 batteries, which exhibited enhanced discharge capacities as compared to that of a pure graphene based O2 electrode, e.g. the Fe2O3/graphene electrode with 29.0 wt% of Fe2O3 delivered a discharge capacity of 8290 mA h g−1 and a round-trip efficiency of 65.9% as compared to 5100 mA h g−1 and 57.5% for a pure graphene electrode. The excellent electrochemical properties of Fe2O3/graphene as an O2 electrode is ascribed to the combination of the fast kinetics of electron transport provided by the graphene sheets and the high electrocatalytic activity for O2 reduction provided by the Fe2O3.
Introduction
Recently, lithium–O2 batteries (LOBs) have attracted much attention due to their ultra-high theoretical specific energy of 11![[thin space (1/6-em)]](https://www.rsc.org/images/entities/char_2009.gif) 680 W h kg−1 (electrode level), which is an order of magnitude higher than that of Li ion batteries1 currently used commercially.2 At present, a prototype aprotic LOB includes Li metal, aqueous or non-aqueous electrolyte and an O2 electrode.3–7 In a typical discharge process of LOBs, two reduction reactions with O2 have been suggested to take place at the O2 electrode:8,9
680 W h kg−1 (electrode level), which is an order of magnitude higher than that of Li ion batteries1 currently used commercially.2 At present, a prototype aprotic LOB includes Li metal, aqueous or non-aqueous electrolyte and an O2 electrode.3–7 In a typical discharge process of LOBs, two reduction reactions with O2 have been suggested to take place at the O2 electrode:8,9| 2Li + 2e− + O2 → Li2O2 (U0 = 2.96 V) | (1) |
| 4Li + 4e− + O2 → 2Li2O (U0 = 2.91 V) | (2) |
High catalytic activity of the O2 electrodes is a critical factor to facilitate the O2 reduction processes, which affects the overall performance of LOBs.2,5,9 Transition-metal oxides, e.g. MnO2-based materials, have been investigated as O2 electrodes in LOBs with carbonate-based electrolytes due to their low cost and low toxicity.10–13 However, a recent report has indicated that the usage of carbonate-based electrolytes in LOBs involves complex decomposition chemistry of the electrolytes, which influences the proper characterization of the specific capacities of the LOBs.14 Ether-based electrolytes have been proved to be more suitable for LOBs as no obvious decomposition of the electrolytes takes place during the discharge process.14 However, there are limited reports on transition-metal oxide based O2 electrodes with ether-based electrolytes.
Apart from catalytic activity, it is also important for the O2 electrodes to possess high surface area and high electrical conductivity to achieve large specific capacities of the LOBs. Graphene-based materials have been extensively studied for applications in energy storage and conversion systems15–27 due to their promising properties, e.g. high electrical conductivity, high surface area, mechanical strength and high thermal conductivity.28 Hierarchically porous graphene prepared with the Hummer's method has shown exciting performance as LOB O2 electrodes.29 Attaching transition-metal oxides onto graphene could be a promising route to O2 electrodes for LOBs. This approach combines the catalytic effects from transition-metal oxides with the high surface area and high electrical conductivity of graphene. As extensively studied electrode materials in Li ion batteries, the graphene based hybrid electrodes are typically prepared by Hummer's method,27,30 which is a multi-step process. It should be noted that other methods also exist for graphene preparation, e.g. chemical vapor deposition,31–33 mechanical exfoliation34 and electrochemical exfoliation,35,36 but some of these methods may not be easily adapted for large-scale sample preparation.
Here, in this work, we carried out the study using Fe2O3 nanocluster-decorated graphene (Fe2O3/graphene) as the flexible O2 electrode in LOBs. The Fe2O3/graphene samples are prepared by a facile electrochemical process, which combines the exfoliation of graphene and deposition of metal oxides in one step. It is shown in our study that the Fe2O3/graphene O2 electrodes shows higher discharge capacities as compared to that of O2 electrodes made of pure graphene prepared by a similar electrochemical process. For example, the Fe2O3/graphene electrode with 29.0 wt% of Fe2O3 exhibits a discharge capacity of 8290 mA h g−1 and a round-trip efficiency of 65.9% as compared to 5100 mA h g−1 and 57.5% for a pure graphene electrode. The discharge capacities of Fe2O3/graphene based O2 electrodes with different Fe2O3 weight percentages (CFe2O3) were also examined. The increased discharge capacities for Fe2O3/graphene based O2 electrodes are proposed to be related to the superior electron transporting properties of graphene and high electrocatalytic O2 reduction activity of Fe2O3.
Experimental
Synthesis of Fe2O3/graphene
Fe2O3/graphene was produced in an electrochemical approach. In a typical process, the electrochemical cell comprises of a highly oriented pyrolytic graphite (HOPG) sheet as the working electrode and a Pt wire as the counter electrode. An electrolyte consisting of 0.1 M FeSO4 and 0.9 M Na2SO4 in deionized water was used. Step voltages with 0 V (10 s) and 10 V (10 s) were applied between the working and counter electrodes. The precipitates were collected via vacuum filtration and washed with deionized water several times. The products were subsequently sintered in argon gas at 400 °C for 1 h.Two further electrolyte solutions with different concentrations (0.03 M FeSO4 + 0.97 M Na2SO4 and 0.15 M FeSO4 + 0.85 M Na2SO4) were also used to prepare Fe2O3/graphene with different contents of Fe2O3.
Synthesis of graphene
Pure graphene was synthesized electrochemically using a previously reported method.35 Graphene sheets were produced via electrochemical exfoliation. A highly oriented graphite sheet (HOPG) was used as the working electrode and a Pt wire was used as the counter electrode. The electrolyte was prepared by dissolving 1 M Na2SO4 in deionized water. A constant voltage of 10 V was applied for 5 min at room temperature. The exfoliated graphene sheets were collected via vacuum filtration and washed several times. The products were then sintered in argon gas at 400 °C for 1 h.Materials characterization
Field-emission scanning electron microscopy (FESEM) and transmission electron microscopy (TEM) imaging of the samples were performed on a field-emission scanning electron microscope (JEOL, Model JSM-7600F) and transmission electron microscope (JEOL, Model JEM-2100). Atomic force microscopy (AFM) measurement was performed on a Dimension 3100 (Veeco, CA, USA). Raman microscopy was carried out on a WITec CRM 200 with a wavelength of 488 nm and a spot size of 0.5 mm. Thermogravimetric analyses were obtained on a TGA Q500 at a heating rate of 10 K min−1. X-Ray photoelectron spectroscopy (XPS) was performed on Thermo Scientific Theta Probe XPS.The X-ray diffraction (XRD) patterns were obtained on a powder X-ray diffraction (Shimadzu XRD-6000 X-ray diffractometer with Cu-Kα irradiation, λ = 1.5406 Å). Prior to XRD analysis of the discharged electrodes, the electrodes were carefully extracted from the cells and cleaned with 1,2-dimethoxyethane in a glove-box with contents of moisture and O2 below 0.1 ppm. After drying in vacuum for several hours, the electrodes were sealed with parafilm in the glove box and tested by XRD with parafilm wrapped on.
Electrochemical measurements
The electrochemical performance of the samples was examined in a Li–O2 cell. The O2 electrodes were fabricated by mixing the samples (90 wt%) and poly(vinylidene fluoride) (10 wt%) in N-methyl-2-pyrrolidone. Then the slurry was stirred overnight and cast onto a separator (Whatman GF/D microfiber filter paper), followed by vacuum-drying at 50 °C for 24 h. The Li–O2 cell configuration was designed as proposed in a previous report.37 Typically, a lithium metal foil as the counter and reference electrode was placed on a stainless-steel current collector. Then a separator (Whatman GF/D microfiber filter paper) was put on top of the lithium foil, followed by adding 20 μL electrolyte (0.1 M LiClO4 in 1,2-dimethoxyethane). The O2 electrode was then put on top with a stainless steel mesh and a stainless steel spring was used as the current collector. The cells were assembled in a glove box. After assembly, the cells were sealed and tested on a NEWARE system between 2 and 4.5 V under a pure O2 flow of 1 mL min−1.Results and discussion
The Fe2O3/graphene hybrids were fabricated via an electrochemical method combining the deposition of metal oxides and the exfoliation of graphene sheets in a single process. Step voltages were applied in the process (Fig. S1, ESI†). The first step with no voltage applied was set to eliminate the ion concentration gradient so as to obtain homogeneous deposits. A high voltage of 10 V was used. This led to the electrochemical deposition of metal oxides onto the graphite surface while sulfate ions were driven by the electric field into the graphene layers, resulting in the expansion of graphene interspacing and the exfoliation of the outer graphene layers off the graphite surface. After cycling the above steps, the products were collected for further investigation. The amount of oxides in the hybrids can be easily tuned by varying the concentrations of FeSO4 in the electrolyte.The XRD pattern (Fig. 1a) of the sample prepared with a FeSO4 concentration (IFeSO4) of 0.1 M can be indexed to the tetragonal Fe2O3 phase (JCPDS 25-1402). There is no crystalline impurity detected in the XRD pattern. The grain size of Fe2O3 is estimated to be 6.9 nm according to the Scherrer equation. The FESEM and TEM images (Fig. 1b and c) show that Fe2O3 nanoclusters with diameters of 30–40 nm are uniformly anchored onto the graphene surface. The high-magnification image (Fig. 1d) reveals that these Fe2O3 nanoclusters are composed of many crystallites with size in the range of 30–40 nm. Varying IFeSO4 values to 0.03 and 0.15 M resulted in hybrid samples with similar phases and morphology (Fig. S2 and S3, ESI†). Only the tetragonal Fe2O3 phase was detected in the XRD patterns while the size of the Fe2O3 nanoclusters is in the range of 20–50 nm for these hybrid samples.
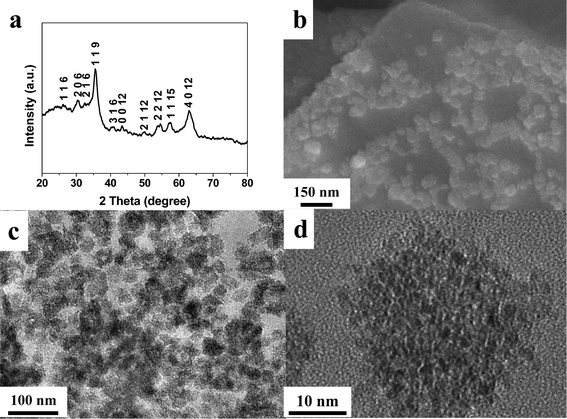 | ||
| Fig. 1 (a) XRD pattern, (b) SEM image, (c) TEM and (d) high magnification TEM image of the Fe2O3/graphene hybrid with IFeSO4 = 0.1 M. | ||
The detailed structure of the graphene in the as-prepared samples was studied by HRTEM (Fig. 2a). The interlayer spacing of the graphene sheet with a trilayer structure is estimated to be ∼0.49 nm, which is consistent with the AFM results (Fig. 2b).
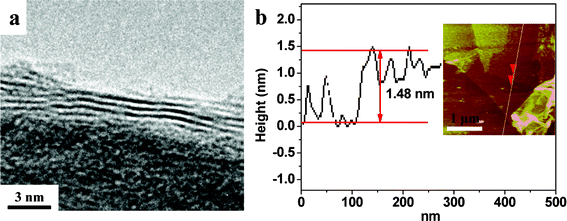 | ||
| Fig. 2 HRTEM image and AFM image of the Fe2O3/graphene hybrid with IFeSO4 = 0.1 M. | ||
The quality of the as-prepared graphene sheets in the Fe2O3/graphene samples was examined by Raman spectroscopy (Fig. S4, ESI†). The intensity ratio I2D:G of the 2D band (located at 2720 cm−1) to the G band (located at 1580 cm−1) was estimated to be ∼0.36 for the sample prepared with IFeSO4 = 0.1 M. This I2D:G value is higher than that of reduced graphene oxide (∼0.15).38 The I2D:G is proved to be relevant to the recovery for sp2 C![[double bond, length as m-dash]](https://www.rsc.org/images/entities/char_e001.gif) C bonds in graphitic structures39 and higher I2D:G indicates fewer layers of graphene. In addition, the low intensity of the D band indicates the small amount of defects. As a comparison, the reduced graphene oxides normally show a D band with higher intensities than those of 2D and G bands.40 Based on the results of the four-point probe measurements, the electrical conductivity of Fe2O3/graphene was calculated to be ∼250 S m−1. Thermogravimetric analysis (TGA) of the Fe2O3/graphene hybrids (Fig. S5, ESI†) reveals that the weight percentages of Fe2O3 (CFe2O3), are 10.7, 29.0 and 52.1 wt% for samples prepared with IFeSO4 = 0.03, 0.1 and 0.15 M, respectively. The Brunauer–Emmett–Teller (BET) analysis of the nitrogen absorption/desorption isotherm (Fig. S6, ESI†) suggests that the specific surface areas of pure graphene and Fe2O3/graphene electrodes with CFe2O3 = 10.7, 29.0 and 52.1 wt% are 218.1, 182.1, 145.2 and 165.7 m2 g−1, respectively.
C bonds in graphitic structures39 and higher I2D:G indicates fewer layers of graphene. In addition, the low intensity of the D band indicates the small amount of defects. As a comparison, the reduced graphene oxides normally show a D band with higher intensities than those of 2D and G bands.40 Based on the results of the four-point probe measurements, the electrical conductivity of Fe2O3/graphene was calculated to be ∼250 S m−1. Thermogravimetric analysis (TGA) of the Fe2O3/graphene hybrids (Fig. S5, ESI†) reveals that the weight percentages of Fe2O3 (CFe2O3), are 10.7, 29.0 and 52.1 wt% for samples prepared with IFeSO4 = 0.03, 0.1 and 0.15 M, respectively. The Brunauer–Emmett–Teller (BET) analysis of the nitrogen absorption/desorption isotherm (Fig. S6, ESI†) suggests that the specific surface areas of pure graphene and Fe2O3/graphene electrodes with CFe2O3 = 10.7, 29.0 and 52.1 wt% are 218.1, 182.1, 145.2 and 165.7 m2 g−1, respectively.
The O2 electrodes were fabricated by coating the Fe2O3/graphene hybrids on a pristine microfiber filter paper (MFFP). This type of filter paper is sponge-like (Fig. S7a, ESI†) with good wettability with most liquid electrolytes and high mechanical flexibility, which makes it suitable as a separator for LOBs. The Fe2O3/graphene-coated MFFP electrode remains robust and bendable (Fig. S7b, ESI†). The LOB configuration is similar to the commonly used coin cells of Li-ion batteries9 with some changes as shown in the scheme (Fig. S7c, ESI†). First, according to previous reports on LOBs,14 1,2-dimethoxyethane (DME) was chosen as the electrolyte instead of using carbonate-based electrolytes (e.g. commonly used in Li ion batteries). The carbonate-based electrolytes are reported to be unstable in LOBs during discharge probably due to the presence of O2 in the working environment. The DME remains stable without obvious decomposition during discharge due to its chemical stability in the presence of superoxide ions and high O2 solubility.8 Secondly, LiClO4 was chosen as the solute in the DME electrolyte instead of using LiPF6 (e.g. commonly used in Li-ion batteries). LiPF6 is highly sensitive to the ambient moisture while LiClO4 is more stable while the average ion mobility and dissociation constant that determine the ionic conductivity of LiClO4 is almost identical to that of LiPF6.41 Additional information on the fabrication of the cells are provided as follows: (1) a stainless steel foil was used as the anode current collector with a lithium foil on top; (2) a MFFP was used as a separator and another MFFP with Fe2O3/graphene was placed on the topside; (3) a stainless steel mesh and a spring were adopted as a cathode current collector; (4) pure O2 gas was purged through a channel on top of the spring.
The XRD patterns of the Fe2O3/graphene electrode (CFe2O3 = 29.0 wt%) and pure graphene electrode before and after discharge are shown in Fig. 3a and b. Results reveal that crystalline hexagonal Li2O2 (JCPDS 09-0355) forms during the discharge process. Due to the small amount of Fe2O3 in the electrode (∼0.5 mg cm−2), the peaks of Fe2O3 are not detectable in the XRD spectra. The observed peaks in the XRD pattern of the electrode before discharge are originated from the microfiber filter paper (MFFP). The grain size of Li2O2 was estimated to be 6.4 nm according to the full width at half maximum (FWHM) of the peaks using the Scherrer equation. Fe2O3/graphene electrodes with other CFe2O3 values show similar XRD patterns.
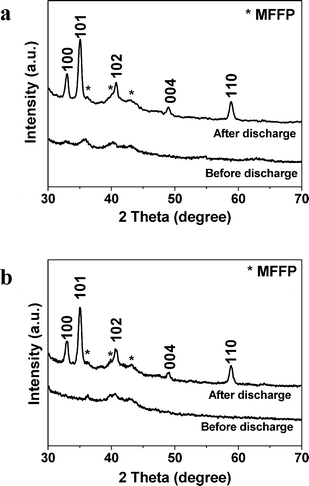 | ||
| Fig. 3 The XRD patterns of (a) the Fe2O3/graphene electrode with CFe2O3 = 29.0 wt% and (b) pure graphene electrode before and after discharge. MFFP refers to microfiber filter paper. | ||
The cathodic scan is carried out to study the catalytic properties of our samples (Fig. 4a). The Fe2O3/graphene electrodes with CFe2O3 = 10.7, 29.0 and 52.1 wt% exhibit oxygen reduction reaction (ORR) onset potentials >2.9 V, which is higher than for pure graphene (∼2.75 V). Moreover, the typical discharge/charge voltage profiles (Fig. 4b) reveal that the round-trip efficiency, defined as discharge voltage/charge voltage, of Fe2O3/graphene with CFe2O3 = 29.0 wt% is ∼65.9% while pure graphene exhibits only 57.5%. These results indicate much improved catalytic properties of Fe2O3/graphene electrodes.
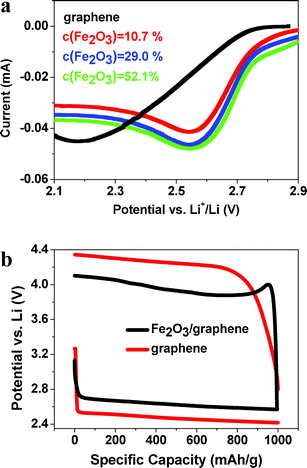 | ||
| Fig. 4 (a) Cathodic scan of Fe2O3/graphene and graphene. (b) Typical voltage profiles of Fe2O3/graphene (29.0%) and graphene at a current density of 200 mA gcarbon−1. | ||
The discharge voltage profiles to 2 V (vs. Li) of Fe2O3/graphene and pure graphene electrodes at a current density of 100 mA g−1 were evaluated (Fig. 5). The pure graphene electrode depicts a discharge capacity of 5100 mA h g−1 at a voltage of 2.5 V. However, the Fe2O3/graphene electrode with CFe2O3 = 10.7, 29.0 and 52.1 wt% are able to deliver much higher discharge capacities of 6420, 8290 and 7920 mA h g−1 at a voltage of ∼2.7 V. The voltage increase of ∼0.2 V with the addition of Fe2O3, indicates the high electrocatalytic activities of Fe2O3, which is comparable to that of gold.8 The specific energies are estimated to be 12![[thin space (1/6-em)]](https://www.rsc.org/images/entities/char_2009.gif) 750 W h kg−1 for pure graphene electrode and 17
750 W h kg−1 for pure graphene electrode and 17![[thin space (1/6-em)]](https://www.rsc.org/images/entities/char_2009.gif) 334, 22
334, 22![[thin space (1/6-em)]](https://www.rsc.org/images/entities/char_2009.gif) 383 and 21
383 and 21![[thin space (1/6-em)]](https://www.rsc.org/images/entities/char_2009.gif) 384 W h kg−1 for Fe2O3/graphene electrodes with CFe2O3 = 10.7, 29.0 and 52.1 wt%, respectively. The energy capacities are significantly higher than that of today's Li-ion batteries (∼387 W h kg−1)9 even when calculated based on the total weight of the electrodes including graphene, Fe2O3 and discharge products (∼2600 W h kg−1 for CFe2O3 = 29.0 wt%). The discharge capacity does not increase continuously with CFe2O3 because excessive amounts of Fe2O3 impede the electron transfer in the electrodes, which compromises the electrochemical performance. The much improved properties enable the Fe2O3/graphene composites to be promising O2 electrodes for LOBs.
384 W h kg−1 for Fe2O3/graphene electrodes with CFe2O3 = 10.7, 29.0 and 52.1 wt%, respectively. The energy capacities are significantly higher than that of today's Li-ion batteries (∼387 W h kg−1)9 even when calculated based on the total weight of the electrodes including graphene, Fe2O3 and discharge products (∼2600 W h kg−1 for CFe2O3 = 29.0 wt%). The discharge capacity does not increase continuously with CFe2O3 because excessive amounts of Fe2O3 impede the electron transfer in the electrodes, which compromises the electrochemical performance. The much improved properties enable the Fe2O3/graphene composites to be promising O2 electrodes for LOBs.
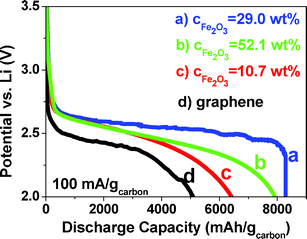 | ||
| Fig. 5 Discharge voltage profiles of Fe2O3/graphene and pure graphene electrodes at 100 mA gcarbon−1. | ||
We have noticed that the discharge curves of our samples are different from previous reports,3,29,42 which is probably due to the different measuring protocols and electrolytes. For example, hybrid electrolytes,3 carbonate-based electrolytes42 and tri(ethylene glycol) dimethyl ether-based electrolytes29 as well as confined discharge/charge capacities3 may result in different voltage curves.
To further examine the electrochemical performance of our samples, we have modified the electrochemical measurement protocols. The voltage range was changed to 2.4–4.5 V and the discharge/charge capacities are confined to 1000 mA h g−1 (Fig. 6). All the Fe2O3/graphene electrodes with CFe2O3 = 10.7, 29.0 and 52.1 wt% depict a stable discharge voltage at ∼2.7 V for 30 cycles. However, the discharge voltage of pure graphene is ∼2.55 V at the 1st cycle and gradually descends to <2.4 V at the 30th cycle.
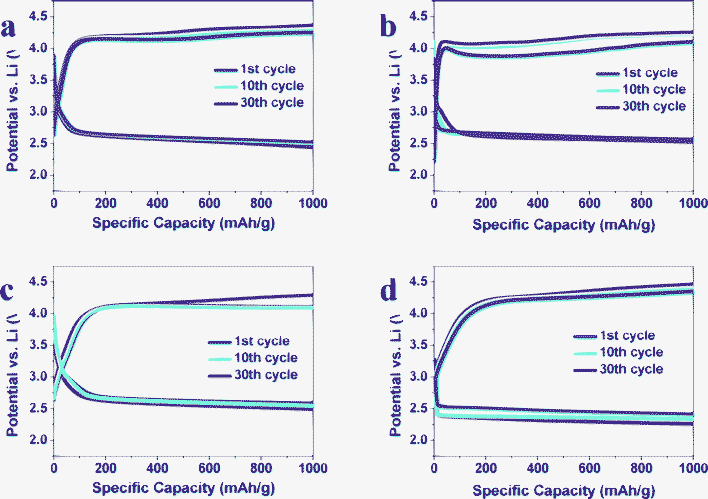 | ||
| Fig. 6 Voltage profiles of selected cycles at 200 mA gcarbon−1 of Fe2O3/graphene with CFe2O3 = (a) 10.7 wt%, (b) 29.0 wt%, (c) 52.1 wt% and (d) graphene at 1000 mA h gcarbon−1. | ||
To study the electrochemical stability of Fe2O3 in the discharge process of LOBs, XPS was carried out on the pristine and discharged electrodes with CFe2O3 = 29.0 wt% (Fig. 7). Before measurements, the discharged electrode was immersed in deionized water to remove Li2O2 that was formed on the electrode. The Fe![[thin space (1/6-em)]](https://www.rsc.org/images/entities/char_2009.gif) 2p3/2 and Fe
2p3/2 and Fe![[thin space (1/6-em)]](https://www.rsc.org/images/entities/char_2009.gif) 2p1/2 bands show peaks at 711.4 and 724.8 eV, respectively, with the satellite peak at ∼720 eV, which confirms the presence of Fe3+.43,44 This indicates that Fe2O3 remains stable during the discharge process without change in the valence state.
2p1/2 bands show peaks at 711.4 and 724.8 eV, respectively, with the satellite peak at ∼720 eV, which confirms the presence of Fe3+.43,44 This indicates that Fe2O3 remains stable during the discharge process without change in the valence state.
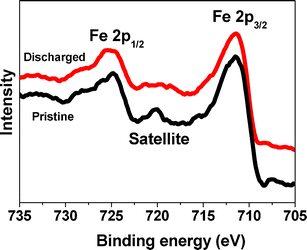 | ||
| Fig. 7 The XPS spectra of the pristine and discharged Fe2O3/graphene electrode with CFe2O3 = 29.0 wt%. | ||
The superior performance of Fe2O3/graphene electrode can be explained in terms of two aspects as shown in the scheme in Fig. 8. First, the incorporation of graphene with high surface area favors the electron transport. Second, Fe-based catalysts can exhibit efficient electrocatalytic activities towards O2 reduction as demonstrated in polymer electrolyte fuel cells 45 and solid oxide fuel cells.44 The iron oxide-based catalysts can easily adsorb O2 on their surface by forming a bond between Fe and O and thereby weakens the bonding within the O2 molecule, which leads to lower activation energy of O2. Therefore, the electrochemical process during discharge can be described as follows (Fig. S8a and b, ESI†): the graphene facilitates the transport of charge electrons to the catalytic sites of Fe2O3, on which O2− is easily adsorbed. The O2− reacts with Li+ to form a layer of LiO2 on top of the Fe2O3/graphene electrode. LiO2 is then quickly converted to Li2O2via disproportionation and further reduction to generate a layer of Li2O2.9 Meanwhile, a new layer of LiO2 forms between the Fe2O3/graphene electrode and the Li2O2 layer and quickly decomposes upon formation. Therefore, at the end of discharge, the electrode is coated with a layer of Li2O2 (Fig. S8b, ESI†). According to previous study,46 the O2 reduction process by lithium on discharge can be summarized as three steps:
| O2 + e− → O2− | (i) |
| Li+ + O2− → LiO2 | (ii) |
| 2LiO2 → Li2O2 + O2 | (iii) |
| or/and |
| LiO2 + Li+ + e− → Li2O2 |
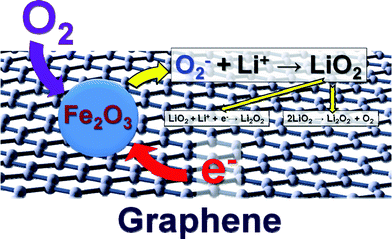 | ||
| Fig. 8 Proposed working mechanism of the Fe2O3/graphene electrode. | ||
The working mechanism of catalysts in Li–air and Li–O2 batteries has been bewildering on account of the buildup of insoluble discharge products. The model proposed here may provide a reasonable explanation and support for further investigation on the role of catalysts in Li–air and Li–O2 batteries.
Conclusions
Fe2O3/graphene composites with different contents of Fe2O3 are prepared electrochemically and investigated as O2 electrodes for Li–O2 batteries. The Fe2O3/graphene electrode with CFe2O3 = 29.0 wt% exhibits a discharge capacity of 8290 mA h g−1 and corresponds to a specific energy of 22![[thin space (1/6-em)]](https://www.rsc.org/images/entities/char_2009.gif) 383 W h kg−1 while a pure graphene electrode delivers only a discharge capacity of 5100 mA h g−1 and a specific energy of 12
383 W h kg−1 while a pure graphene electrode delivers only a discharge capacity of 5100 mA h g−1 and a specific energy of 12![[thin space (1/6-em)]](https://www.rsc.org/images/entities/char_2009.gif) 750 W h kg−1. Moreover, at confined discharge/charge capacities of 1000 mA h g−1, the Fe2O3/graphene electrodes exhibits a stable discharge voltage at ∼2.7 V for 30 cycles while pure graphene exhibits a 1st-cycle voltage at ∼2.55 V and 30th-cycle voltage at <2.4 V. The improved performance is ascribed to the fast electron transport provided by the graphene sheets and the high electrocatalytic activities for O2 reduction provided by the Fe2O3.
750 W h kg−1. Moreover, at confined discharge/charge capacities of 1000 mA h g−1, the Fe2O3/graphene electrodes exhibits a stable discharge voltage at ∼2.7 V for 30 cycles while pure graphene exhibits a 1st-cycle voltage at ∼2.55 V and 30th-cycle voltage at <2.4 V. The improved performance is ascribed to the fast electron transport provided by the graphene sheets and the high electrocatalytic activities for O2 reduction provided by the Fe2O3.
Acknowledgements
The authors gratefully acknowledge, NRF2009EWT-CERP001-026 (Singapore), Singapore National Research Foundation under CREATE program: EMobility, A*STAR SERC grant 1021700144 and Singapore MPA 23/04.15.03 RDP 009/10/102 and MPA 23/04.15.03 RDP 020/10/113 grant.References
- C. K. Chan, H. Peng, G. Liu, K. McIlwrath, X. F. Zhang, R. A. Huggins and Y. Cui, Nat. Nanotechnol., 2007, 3, 31–35 CrossRef.
- G. Girishkumar, B. McCloskey, A. C. Luntz, S. Swanson and W. Wilcke, J. Phys. Chem. Lett., 2010, 1, 2193–2203 CrossRef CAS.
- E. Yoo and H. S. Zhou, ACS Nano, 2011, 5, 3020–3026 CrossRef CAS.
- Y. G. Wang and H. S. Zhou, J. Power Sources, 2010, 195, 358–361 CrossRef CAS.
- Y. C. Lu, Z. C. Xu, H. A. Gasteiger, S. Chen, K. Hamad-Schifferli and Y. Shao-Horn, J. Am. Chem. Soc., 2010, 132, 12170–12171 CrossRef CAS.
- T. Ogasawara, A. Débart, M. Holzapfel, P. Novák and P. G. Bruce, J. Am. Chem. Soc., 2006, 128, 1390–1393 CrossRef CAS.
- R. Black, S. H. Oh, J. H. Lee, T. Yim, B. Adams and L. F. Nazar, J. Am. Chem. Soc., 2012, 134, 2902–2905 CrossRef CAS.
- Y.-C. Lu, D. G. Kwabi, K. P. C. Yao, J. R. Harding, J. Zhou, L. Zuin and Y. Shao-Horn, Energy Environ. Sci., 2011, 4, 2999–3007 CAS.
- P. G. Bruce, S. A. Freunberger, L. J. Hardwick and J. M. Tarascon, Nat. Mater., 2011, 11, 19–29 CrossRef.
- L. Jin, L. P. Xu, C. Morein, C. H. Chen, M. Lai, S. Dharmarathna, A. Dobley and S. L. Suib, Adv. Funct. Mater., 2010, 20, 3373–3382 CrossRef CAS.
- A. Debart, A. J. Paterson, J. Bao and P. G. Bruce, Angew. Chem., Int. Ed., 2008, 47, 4521–4524 CrossRef CAS.
- A. K. Thapa, K. Saimen and T. Ishihara, Electrochem. Solid-State Lett., 2010, 13, A165–A167 CrossRef CAS.
- G. Q. Zhang, J. P. Zheng, R. Liang, C. Zhang, B. Wang, M. Au, M. Hendrickson and E. J. Plichta, J. Electrochem. Soc., 2011, 158, A822–A827 CrossRef CAS.
- B. D. McCloskey, D. S. Bethune, R. M. Shelby, G. Girishkumar and A. C. Luntz, J. Phys. Chem. Lett., 2011, 2, 1161–1166 CrossRef CAS.
- Z. S. Wu, W. C. Ren, D. W. Wang, F. Li, B. L. Liu and H. M. Cheng, ACS Nano, 2010, 4, 5835–5842 CrossRef CAS.
- N. Li, G. Liu, C. Zhen, F. Li, L. L. Zhang and H. M. Cheng, Adv. Funct. Mater., 2011, 21, 1717–1722 CrossRef CAS.
- Y. Shi, L. Wen, F. Li and H. M. Cheng, J. Power Sources, 2011, 196, 8610–8617 CrossRef CAS.
- S. P. Pang, Y. Hernandez, X. L. Feng and K. Mullen, Adv. Mater., 2011, 23, 2779–2795 CrossRef CAS.
- S. B. Yang, X. L. Feng and K. Mullen, Adv. Mater., 2011, 23, 3575–3579 CrossRef CAS.
- J. Zhu, K. Sun, D. Sim, C. Xu, H. H. Hng and Q. Yan, Chem. Commun., 2011, 47, 10383–10385 RSC.
- X. Rui, J. Zhu, D. Sim, C. Xu, Y. Zeng, H. H. Hng, T. M. Lim and Q. Yan, Nanoscale, 2011, 3, 4752–4758 RSC.
- N. Xiao, X. C. Dong, L. Song, D. Y. Liu, Y. Tay, S. X. Wu, L. J. Li, Y. Zhao, T. Yu, H. Zhang, W. Huang, H. H. Hng, P. M. Ajayan and Q. Y. Yan, ACS Nano, 2011, 5, 2749–2755 CrossRef CAS.
- S. Evers and L. F. Nazar, Chem. Commun., 2012, 48, 1233–1235 RSC.
- H. Wang, H. S. Casalongue, Y. Liang and H. Dai, J. Am. Chem. Soc., 2010, 132, 7472–7477 CrossRef CAS.
- H. Wang, Y. Liang, T. Mirfakhrai, Z. Chen, H. Casalongue and H. Dai, Nano Res., 2011, 4, 729–736 CrossRef CAS.
- X. Xie, G. Yu, N. Liu, Z. Bao, C. S. Criddle and Y. Cui, Energy Environ. Sci., 2012, 5, 6862 CAS.
- H. L. Wang, L. F. Cui, Y. A. Yang, H. S. Casalongue, J. T. Robinson, Y. Y. Liang, Y. Cui and H. J. Dai, J. Am. Chem. Soc., 2010, 132, 13978–13980 CrossRef CAS.
- A. K. Geim, Science, 2009, 324, 1530–1534 CrossRef CAS.
- J. Xiao, D. Mei, X. Li, W. Xu, D. Wang, G. L. Graff, W. D. Bennett, Z. Nie, L. V. Saraf, I. A. Aksay, J. Liu and J.-G. Zhang, Nano Lett., 2011, 11, 5071–5078 CrossRef CAS.
- J. Zhu, Z. Yin, H. T. Hai Li, C. L. Chow, H. Zhang, H. H. Hng, J. Ma and Q. Yan, Small, 2011, 7, 3163–3168 CrossRef.
- A. Reina, X. T. Jia, J. Ho, D. Nezich, H. B. Son, V. Bulovic, M. S. Dresselhaus and J. Kong, Nano Lett., 2009, 9, 30–35 CrossRef CAS.
- L. Ci, L. Song, C. H. Jin, D. Jariwala, D. X. Wu, Y. J. Li, A. Srivastava, Z. F. Wang, K. Storr, L. Balicas, F. Liu and P. M. Ajayan, Nat. Mater., 2010, 9, 430–435 CrossRef CAS.
- Z. Chen, W. Ren, L. Gao, B. Liu, S. Pei and H.-M. Cheng, Nat. Mater., 2011, 10, 424–428 CrossRef CAS.
- K. S. Novoselov, A. K. Geim, S. V. Morozov, D. Jiang, Y. Zhang, S. V. Dubonos, I. V. Grigorieva and A. A. Firsov, Science, 2004, 306, 666–669 CrossRef CAS.
- C. Y. Su, A. Y. Lu, Y. P. Xu, F. R. Chen, A. N. Khlobystov and L. J. Li, ACS Nano, 2011, 5, 2332–2339 CrossRef CAS.
- N. Liu, F. Luo, H. X. Wu, Y. H. Liu, C. Zhang and J. Chen, Adv. Funct. Mater., 2008, 18, 1518–1525 CrossRef CAS.
- Y. C. Lu, H. A. Gasteiger, M. C. Parent, V. Chiloyan and Y. Shao-Horn, Electrochem. Solid-State Lett., 2010, 13, A69–A72 CrossRef CAS.
- J. X. Zhu, T. Zhu, X. Z. Zhou, Y. Y. Zhang, X. W. Lou, X. D. Chen, H. Zhang, H. H. Hng and Q. Y. Yan, Nanoscale, 2011, 3, 1084–1089 RSC.
- B. Krauss, T. Lohmann, D. H. Chae, M. Haluska, K. von Klitzing and J. H. Smet, Phys. Rev. B: Condens. Matter Mater. Phys., 2009, 79, 165428 CrossRef.
- J. X. Zhu, Y. K. Sharma, Z. Y. Zeng, X. J. Zhang, M. Srinivasan, S. Mhaisalkar, H. Zhang, H. H. Hng and Q. Y. Yan, J. Phys. Chem. C, 2011, 115, 8400–8406 CAS.
- K. Xu, Chem. Rev., 2004, 104, 4303–4418 CrossRef CAS.
- Y. Li, J. Wang, X. Li, D. Geng, R. Li and X. Sun, Chem. Commun., 2011, 47, 9438–9440 RSC.
- T. Yamashita and P. Hayes, Appl. Surf. Sci., 2008, 254, 2441–2449 CrossRef CAS.
- W. Zhou, L. Ge, Z. G. Chen, F. Liang, H.-Y. Xu, J. Motuzas, A. Julbe and Z. Zhu, Chem. Mater., 2011, 23, 4193–4198 CAS.
- M. Lefevre, E. Proietti, F. Jaouen and J. P. Dodelet, Science, 2009, 324, 71–74 CrossRef CAS.
- C. O. Laoire, S. Mukerjee, K. M. Abraham, E. J. Plichta and M. A. Hendrickson, J. Phys. Chem. C, 2009, 113, 20127–20134 CAS.
Footnote |
| † Electronic supplementary information (ESI) available: Supplementary Raman and TGA results. See DOI: 10.1039/c2ra20757e/ |
| This journal is © The Royal Society of Chemistry 2012 |
