DOI:
10.1039/C2RA21199H
(Paper)
RSC Adv., 2012,
2, 8515-8525
Evaluation on the role of terminal N-substitution in 6-methoxy-2-oxo-1,2-dihydroquinoline-3-carbaldehyde thiosemicarbazones on the biological properties of new water-soluble nickel(II) complexes†
Received
18th June 2012
, Accepted 23rd July 2012
First published on 26th July 2012
Abstract
Five new nickel(II) complexes of 6-methoxy-2-oxo-1,2-dihydroquinoline-3-carbaldehyde 4N-substituted thiosemicarbazones with the general formula {[Ni(HL)2](NO3)2·4H2O} have been synthesised in order to ascertain the biological properties due to the change in substitution at terminal nitrogen of the thiosemicarbazones. The structure of one of the complexes was established by single-crystal X-ray diffraction analysis. DNA/protein interactions of the complexes have been examined by photophysical studies which revealed that all the complexes can bind with calf thymus DNA via intercalation and the complexes bind to bovine serum albumin more strongly. Antioxidant studies showed that the Ni(II) complexes have significant antioxidant activity against 2-2′-diphenyl-1-picrylhydrazyl radical and 2,2′-azino-3-ethylbenzthiazoline-6-sulfonic acid diammonium salt cation radical. The in vitro cytotoxicity of all the complexes against the A549 cell line was assayed; this showed highest cytotoxic activity for the complex containing phenyl substituted thiosemicarbazone – higher than found for cisplatin.
1. Introduction
Though many cisplatin analogs have been screened as potential antitumor agents in addition to cisplatin, only carboplatin and oxaliplatin have entered into clinical use.1 In spite of the achievements made in the use of current platinum drugs, there are some major problems associated with side-effects such as nausea and kidney and liver failure, typical of heavy metal toxicity, in addition to the major problem of resistance.2–6 Hence, attempts are being made to replace these drugs with suitable alternatives, and in this direction, a number of other transition-metal complexes have been synthesized and screened for their potential anticancer activity. In this area, a few heterocyclic thiosemicarbazones and their corresponding transition-metal complexes have received considerable attention due to their coordination behaviour and their valuable pharmacological properties such as antitumor, antibacterial, antiviral and antimalarial activities.7–13 Particular attention has been paid to their antitumor activity that seems to be due to inhibition of DNA synthesis caused by a modification in the reductive conversion of ribonucleotides to deoxyribonucleotides.14 In connection with this, we have recently reported the reactions of various thiosemicarbazones,15–18 heterocycles of thiosemicarbazones,19–22 and semicarbazones23 with diverse transition-metal ions, leading to metal complexes that showed remarkable biological activity. In particular, metal complexes derived from 2-oxoquinoline thiosemicarbazone and its derivatives were found to exhibit excellent DNA/protein binding and antitumor activities, indicating an enhanced antitumor activity due to the presence of heterocycles present in the thiosemicarbazones.19–24 Stimulated by these encouraging and promising results, it was thought worthwhile to study the properties of nickel complexes of 6-methoxy-2-oxo-1,2-dihydroquinoline-3-carbaldehyde 4N-substituted thiosemicarbazones with a focus on evaluation of the effect of substitution at terminal nitrogen of the ligand on biological properties such as DNA binding, antioxidative and cytotoxic activity.
In this paper, we report the synthesis, structure, DNA/protein binding, antioxidative and cytotoxicity studies of five new water-soluble nickel(II) complexes of 6-methoxy-2-oxo-1,2-dihydroquinoline-3-carbaldehyde 4N-substituted thiosemicarbazones. The crystal structure of one of the new complexes has been determined by single-crystal X-ray crystallography. The biological properties of the new nickel complexes have been investigated with a focus on the binding properties with calf thymus DNA (CT-DNA) by UV spectroscopy and competitive binding studies with ethidium bromide (EB). The synthetic route of the complexes is shown in Scheme 1.
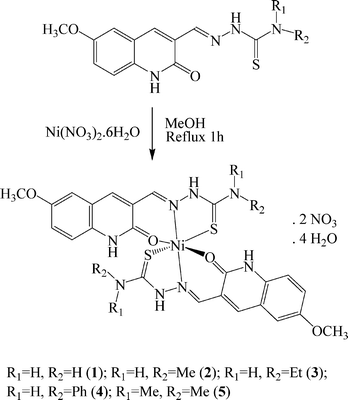 |
| | Scheme 1 The synthetic route of the nickel(II) complexes. | |
2. Results and discussion
2.1. Synthesis and characterization
A series of mononuclear nickel(II) complexes 1–5 were prepared by the direct reaction of Ni(NO3)·6H2O with the appropriate ligand in methanol. Single crystals of complex 5 were grown by slow evaporation of the reaction mixture over a period of several days. The air-stable nickel complexes were characterized by elemental analysis and spectroscopic techniques and the data are given in the Experimental section. They are quite soluble in methanol, ethanol, DMF, DMSO and particularly in water. The IR peak shifts of the ν(C![[double bond, length as m-dash]](https://www.rsc.org/images/entities/char_e001.gif) O), ν(C
O), ν(C![[double bond, length as m-dash]](https://www.rsc.org/images/entities/char_e001.gif) N) and ν(C
N) and ν(C![[double bond, length as m-dash]](https://www.rsc.org/images/entities/char_e001.gif) S) frequencies of the complexes with respect to the free ligand indicated the coordination of the ligand to the nickel ion in the complex.25 In all the complexes, it has been observed that the thiosemicarbazones behaved as ONS neutral tridentate ligands and the complexes were neutralised by two nitrate ions. The electronic spectra of all the complexes exhibited bands in the regions of 261–265 and 412–429 nm which are attributed to the intraligand π→π* transitions within the coordinated ligand moiety and ligand-to-metal charge-transfer (LMCT) transitions, respectively.18
S) frequencies of the complexes with respect to the free ligand indicated the coordination of the ligand to the nickel ion in the complex.25 In all the complexes, it has been observed that the thiosemicarbazones behaved as ONS neutral tridentate ligands and the complexes were neutralised by two nitrate ions. The electronic spectra of all the complexes exhibited bands in the regions of 261–265 and 412–429 nm which are attributed to the intraligand π→π* transitions within the coordinated ligand moiety and ligand-to-metal charge-transfer (LMCT) transitions, respectively.18
2.2. Crystal structure of the complex
Table 1 summarizes the crystal data, data collection and refinement parameters for the new Ni(II) complex 5, and selected bond lengths and bond angles are given in Table 2. Crystal structure analysis revealed that the complex crystallized as a tetrahydrate with the formula [Ni(HL5)2](NO3)2·4H2O (Fig. 1). The nitrate anions are not bonded to the nickel ion and are present outside the coordination sphere. The two ligands are coordinated to nickel ion in tridentate (ONS) node giving a slightly distorted octahedral geometry around the nickel atom. Hybridization of all nitrogen atoms in the ligand is sp2 leading to the two crystallographically equivalent ligands being essentially planar. The methoxy group at the far end of the cation is disordered, equally favouring two different positions. One points directly toward its symmetry equivalent on an adjacent cation, so the other methoxy group is forced to be oriented differently due to high steric interactions and is rotated by 180° around the aryl C–O bond (Fig. S1, ESI†).
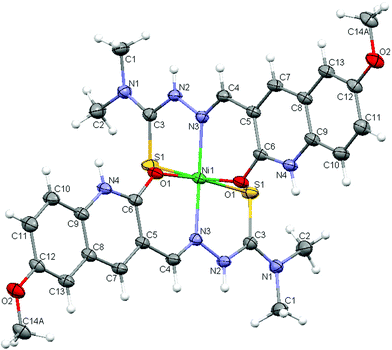 |
| | Fig. 1 ORTEP style view of the nickel(II) complex 5. The nitrate ion and water molecules have been omitted for clarity. | |
Table 1 Experimental data for crystallographic analyses for [Ni(H2L5)2](NO3)2·4H2O (5)
| Chemical formula |
C28H40N10NiO14S2 |
|
M
r
|
863.53 |
| Crystal system |
Monoclinic |
| Space group |
C2/c |
|
T/K |
100 |
|
a/Å |
24.196(3) |
|
b/Å |
9.5392(12) |
|
c/Å |
16.684(2) |
|
β/° |
101.545(2) |
|
V/Å3 |
3772.9(8) |
|
Z
|
4 |
| Radiation type |
Mo-Kα |
|
μ/mm−1 |
0.70 |
| Crystal size/mm |
0.40 × 0.32 × 0.13 |
| Diffractometer |
Bruker AXS SMARTAPEX CCD |
| Absorption correction |
Multi-scan Apex2 v2009.7-0 (Bruker, 2009) |
|
T
min, Tmax |
0.663, 0.746 |
| No. measured reflections |
41![[thin space (1/6-em)]](https://www.rsc.org/images/entities/char_2009.gif) 410 410 |
| No. independent reflections |
5862 |
| No. observed reflections [I > 2σ(I)] |
4756 |
|
R
int
|
0.041 |
|
R[F2 > 2σ(F2)], wR(F2), S |
0.038, 0.104, 1.05 |
| No. reflections |
5862 |
| No. parameters |
274 |
| H-atom treatment |
Mixture of independent and constrained refinement |
| Δρmax, min/e Å−3 |
0.43, −0.35 |
Table 2 Selected bond lengths (Å) and angles (°) for [Ni(H2L5)2](NO3)2·4H2O (5)
| N3–Ni1 |
2.0557(13) |
Ni1–N3i |
2.0557(13) |
| Ni1–O1 |
2.0277(12) |
Ni1–S1i |
2.3594(5) |
| Ni1–O1i |
2.0278(12) |
Ni1–S1 |
2.3594(5) |
| |
| O1–Ni1–O1i |
90.29(7) |
N3–Ni1–S1i |
102.29(4) |
| O1–Ni1–N3 |
88.96(5) |
N3i–Ni1–S1i |
83.86(4) |
| O1i–Ni1–N3 |
84.73(5) |
O1–Ni1–S1 |
172.74(3) |
| O1–Ni1–N3i |
84.73(5) |
O1i–Ni1–S1 |
88.01(4) |
| O1i–Ni1–N3i |
88.96(5) |
N3–Ni1–S1 |
83.86(4) |
| N3–Ni1–N3i |
171.06(8) |
N3i–Ni1–S1 |
102.29(4) |
| O1–Ni1–S1i |
88.01(4) |
S1i–Ni1–S1 |
94.53(3) |
| O1i–Ni1–S1i |
172.74(3) |
|
|
The nitrate anions and the interstitial water molecules are connected with each other and with the complex cations through an intricate web of hydrogen bonds. The amine nitrogen atom (N2) hydrogen bonds to the nitrate group (O5) and the protonated aromatic pyridyl nitrogen (N4) hydrogen bonds to water (O7) in a web of hydrogen bonded water molecules and nitrate anions. Selected hydrogen-bond parameters are summarized in Table 3. The hydrogen bonding interactions lead to formation of wave-like layers of water molecules and nitrate anions (Fig. S2, ESI†), that alternate with layers of the cationic complexes (Fig. 2).
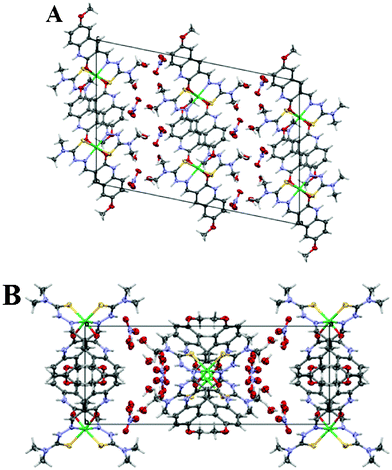 |
| | Fig. 2 (A) and (B) Depiction of the unit cell viewed down the b- and c-axes. Noe that the lattice has two alternating layers: one of complex cations and the other of nitrate anions and water molecules. | |
Table 3 Selected hydrogen-bond parameters
| D–H⋯A |
D–H/Å |
H⋯A/Å |
D⋯A/Å |
D–H⋯A/° |
| Symmetry code(s): −x + 1/2, y + 1/2, −z + 1/2. −x + 1/2, −y + 1/2, −z + 1. x − 1/2, y − 1/2, z. |
| O7–H7OB⋯O4 |
0.871(17) |
2.036(19) |
2.886(2) |
165(3) |
| O7–H7OA⋯O6a |
0.868(17) |
1.985(19) |
2.812(2) |
159(3) |
| O6–H6OB⋯O3b |
0.856(17) |
2.041(19) |
2.876(2) |
165(3) |
| O6–H6OA⋯O4 |
0.867(17) |
2.59(2) |
3.291(2) |
139(3) |
| O6–H6OA⋯O3 |
0.867(17) |
2.065(18) |
2.917(2) |
167(3) |
| N4–H4A⋯O7c |
0.88 |
1.89 |
2.724(2) |
157.3 |
| N2–H2⋯O5b |
0.88 |
2.15 |
2.9852(19) |
158.4 |
Based on the analytical, spectroscopic characterization (FT-IR, UV-visible) and single-crystal X-ray diffraction studies for the complex 5, an octahedral structure has been proposed for all the new Ni(II) complexes (Scheme 1).
2.3. DNA binding studies
For evaluating the antitumor property of any new compound, DNA binding is the predominant property looked for in pharmacology and hence, the understanding of the interaction between DNA and a compound to be investigated is of paramount importance. Hence, the mode and tendency for the binding of the nickel(II) complexes to CT-DNA were studied with different physicochemical methods.
2.3.1. Electronic absorption titration.
In general, electronic absorption spectroscopy is one of the most useful techniques employed to investigate the mode of interaction of metal complexes with DNA.26,27 Normally, a compound binding to DNA through intercalation usually results in hypochromism with or without a small red or blue shift, due to a strong stacking interaction between the planar aromatic chromophore of the compound and the base pairs of DNA.28,29 The results of absorption spectra of the new nickel complexes in the absence and presence of CT-DNA are shown in Fig. 3 and Fig. S3 (ESI†). Upon increasing the concentration of DNA, the absorption bands of complexes 1 and 2 exhibited hypochromism of 24.44 and 29.27% with a red shift of 2 and 3 nm (at 396 and 397 nm) whereas the absorption band of the complex 3 at 399 nm exhibited a hypochromism of about 32.16% with a red shift of 1 nm. However, complex 4 at 423 nm exhibited a hypochromism of about 35.62% with a blue shift of 2 nm and complex 5 at 425 nm exhibited a hypochromism of about 33.17% with a red shift of 2 nm, respectively. These results suggested that all the complexes bind to the DNA helix via intercalation, due to stacking interaction between the planar aromatic chromophore of the complexes and the base pairs of DNA. These observations were comparable to those reported earlier for various metallointercalators.22 However, complex 4 showed higher hypochromicity when compared to the other complexes, indicating that the binding strength of the complex 4 is much stronger than for the other complexes. To get an idea about the relative strength of the binding of the new nickel(II) complex, their intrinsic binding constants (Kb) have been determined from eqn (1):30| | | [DNA]/(εa − εf) = [DNA]/(εb − εf) + 1/Kb(εb − εf) | (1) |
where, [DNA] is the concentration of DNA in the base pairs, εa is the apparent absorption coefficient corresponding to Aobs/[compound], εf is the extinction coefficient of the free compound and εb is the extinction coefficient of the compound when fully bound to DNA. From the plot of [DNA]/(εa − εf) vs. [DNA] (Fig. 4), Kb was calculated from the ratio of the slope and the intercept. The intrinsic binding constant (Kb) values have been found to be (0.90 ± 0.10) × 104 M−1, (1.52 ± 0.06) × 104 M−1, (2.47 ± 0.34) × 104 M−1, (3.67 ± 0.07) × 104 M−1 and (3.26 ± 0.10) × 104 M−1 for complexes 1, 2, 3, 4 and 5 respectively. The observed values of Kb suggest that new nickel complexes bind to DNA via an intercalative mode. From the results obtained it has been found that complex 4 binds more strongly with CT-DNA compared to the remaining complexes and the order of binding affinity is 1 < 2 < 3 < 5 < 4. Although, results of the electronic spectral studies suggest that the complexes bind to DNA via intercalation, the actual binding mode needs to be proved through further experiments.
![Electronic spectra of complex 4 in Tris-HCl buffer upon addition of CT-DNA: [Complex] = 25 μM, [DNA] = 0–50 μM. The arrow shows that the absorption intensities decrease upon increasing DNA concentration.](/image/article/2012/RA/c2ra21199h/c2ra21199h-f3.gif) |
| | Fig. 3 Electronic spectra of complex 4 in Tris-HCl buffer upon addition of CT-DNA: [Complex] = 25 μM, [DNA] = 0–50 μM. The arrow shows that the absorption intensities decrease upon increasing DNA concentration. | |
![Plots of [DNA]/(εa − εf) vs. [DNA] for the nickel(ii) complexes 1–5 with CT-DNA.](/image/article/2012/RA/c2ra21199h/c2ra21199h-f4.gif) |
| | Fig. 4 Plots of [DNA]/(εa − εf) vs. [DNA] for the nickel(II) complexes 1–5 with CT-DNA. | |
2.3.2. Ethidium bromide (EB) displacement studies.
Though the absorption titration results indicate that the new nickel(II) complexes effectively bind to DNA, in order to further confirm the binding mode and to compare their binding affinities, ethidium bromide displacement experiments were carried out. EB is a planar cationic dye which is widely used as a sensitive fluorescence probe for native DNA. Usually, EB emits intense fluorescent light in the presence of DNA due to its strong intercalation between the adjacent DNA base pairs.31,32 Hence, EB displacement technique can be used to obtain indirect evidence for the DNA binding mode. The displacement technique is based on the decrease of fluorescence resulting from the displacement of EB from a DNA sequence by a quencher, and the quenching is due to the reduction of the number of binding sites on the DNA that is available to the EB. The fluorescence quenching spectra of DNA-bound EB in the presence of complexes are shown in Fig. 5 and Fig. S4 (ESI†) which illustrate that as the concentration of the complexes increase, the observed fluorescence intensity decreases, clearly indicating that the EB molecules are displaced from their DNA binding sites, and are replaced by the complexes under investigation.33 The quenching parameter has been analyzed according to the Stern–Volmer equation (eqn (2)): where F0 is the emission intensity in the absence of compound, F is the emission intensity in the presence of compound, Kq is the quenching constant, and [Q] is the concentration of the compound. The Kq values have been obtained as a slope from the plot of F0/F vs. [Q]. From the Stern–Volmer plot (Fig. 6) of F0/F vs. [Q], the quenching constants (Kq) were obtained from the slopes. The obtained values were (5.59 ± 0.01) × 103 M−1, (7.48 ± 0.02) × 103 M−1, (8.17 ± 0.04) × 103 M−1, (2.65 ± 0.05) × 104 M−1 and (1.03 ± 0.03) × 104 M−1 for complexes 1–5, respectively. Further, the apparent DNA binding constants (Kapp) were calculated using eqn (3):| | | KEB[EB] = Kapp[complex] | (3) |
where [complex] is the value at 50% reduction in the fluorescence intensity of EB, KEB (1.0 × 10⁷ M−1) is the DNA binding constant of EB, [EB] is the concentration of EB = 12 μM). Kapp values were 2.80 × 10⁵ M−1, 3.74 × 10⁵ M−1, 4.09 × 10⁵ M−1, 1.33 × 10⁶ M−1 and 5.15 × 10⁵ M−1 for complexes 1–5 respectively. From these experimental data, it is seen that the nickel(II) complex 4 replaces the EB more effectively than the other complexes, which is in agreement with the results observed from the electronic absorption spectra. Since these changes indicate only one kind of quenching process, it may be concluded that the all complexes can bind to DNA via the intercalation mode. Furthermore, the observed quenching constants and binding constants of the new complexes suggest that the interaction of all the complexes with DNA should be intercalative.34,35
![The emission spectra of the DNA–EB system (λexc = 515 nm, λem = 530–750 nm), in the presence of complex 4. [DNA] = 12 μM, [Complex] = 0–75 μM, [EB] = 12 μM. The arrow shows the emission intensity changes upon increasing complex concentration.](/image/article/2012/RA/c2ra21199h/c2ra21199h-f5.gif) |
| | Fig. 5 The emission spectra of the DNA–EB system (λexc = 515 nm, λem = 530–750 nm), in the presence of complex 4. [DNA] = 12 μM, [Complex] = 0–75 μM, [EB] = 12 μM. The arrow shows the emission intensity changes upon increasing complex concentration. | |
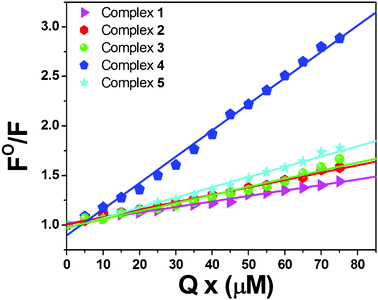 |
| | Fig. 6 Stern–Volmer plots of the EB–DNA fluorescence titration for complexes 1–5. | |
2.4. Protein binding studies
2.4.1. Fluorescence quenching of BSA by ligand and its corresponding nickel complex.
The binding of drugs with plasma proteins is an important step in the transport of metal ions and metal complexes with drugs through the bloodstream. Binding of these compounds to the proteins may lead to either a loss or enhancement of the biological properties of the original drug and provide paths for drug transportation. An analysis of the binding of chemical compounds to BSA is commonly detected by examining the fluorescence spectra. It is known that the fluorescence of BSA is caused by two intrinsic amino acids of the protein, namely tryptophan and tyrosine. Usually, changes in the emission spectra of tryptophan can be seen in response to protein conformational transitions, subunit associations, substrate binding, or denaturation. Therefore, the intrinsic fluorescence of BSA can provide considerable information on its structure and dynamics and it can be utilized in the study of protein folding and association reactions. We have studied the interaction of BSA with the new nickel(II) complexes by fluorescence measurement at room temperature. A solution of BSA (1 μM) was titrated with various concentrations of the complexes (0–25 μM). Fluorescence spectra were recorded in the range of 290–450 nm upon excitation at 280 nm. The changes observed on the fluorescence emission spectra of a solution of BSA on the addition of increasing amounts of the nickel complexes are shown in Fig. 7 and Fig. S5 (ESI†). Upon the addition of complexes 1–5 to BSA, a significant decrease of the fluorescence intensity of BSA at 346 nm of up to 87.96, 90.50, 92.12, 95.59 and 93.84% from the initial fluorescence intensity was observed accompanied by a hypsochromic shift of 9, 12, 13, 8 and 6 nm, respectively. The observed blue shift is mainly due to the fact that the active site in protein is buried in a hydrophobic environment. These results suggested a definite interaction of all of the complexes with the BSA protein.19,20 Further, fluorescence quenching data were analysed with the Stern–Volmer equation and Scatchard equation. The quenching constant (Kq) was calculated using the plot of F0/F vs. [Q] (Fig. 8). If it is assumed that the binding of complexes with BSA is measured under equilibrium conditions, the equilibrium binding constant can be analysed according to the Scatchard equation (eqn (4)):| | log[(F0 − F)/F] = log![[thin space (1/6-em)]](https://www.rsc.org/images/entities/char_2009.gif) Kbin + n Kbin + n![[thin space (1/6-em)]](https://www.rsc.org/images/entities/char_2009.gif) log[Q] log[Q] | (4) |
where Kbin is the binding constant of the compound with BSA and n is the number of binding sites. The number of binding sites (n) and the binding constant (Kbin) have been obtained from the plot of log[(F0 − F)/F] vs. log[Q] (Fig. 9). The calculated Kq and Kbin values of complexes 1–5 are given in Table 4. The calculated values of Kq and Kbin for all of the complexes suggested that the complexes interact more strongly with BSA than CT-DNA.
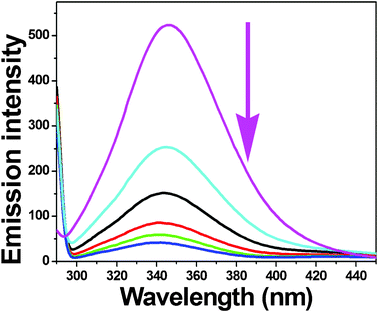 |
| | Fig. 7 The emission spectrum of BSA (1 μM; λexc = 280 nm; λem = 346 nm) in the presence of increasing amounts of complex 4 (0–25 μM). The arrow shows the emission intensity changes upon increasing complex concentration. | |
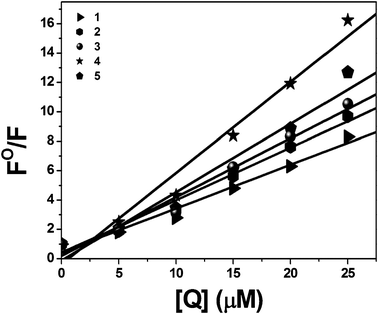 |
| | Fig. 8 Stern–Volmer plot of BSA fluorescence titration for complexes 1–5. | |
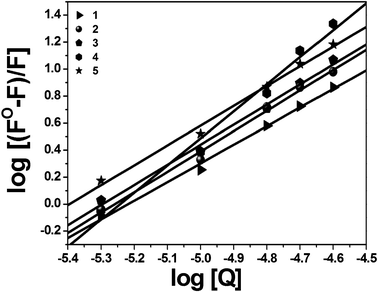 |
| | Fig. 9 Scatchard plot of BSA fluorescence titration for complexes 1–5. | |
Table 4 Quenching constant (Kq), binding constant (Kbin) and number of binding sites (n) for the interactions of complexes 1–5 with BSA
| Complex |
10−5Kq/M−1 |
10−7Kbin/M−1 |
n
|
|
1
|
2.97 ± 0.48 |
1.59 ± 0.03 |
1.59 |
|
2
|
3.59 ± 0.46 |
3.20 ± 0.08 |
1.42 |
|
3
|
3.99 ± 0.86 |
7.55 ± 0.04 |
1.46 |
|
4
|
6.20 ± 0.12 |
8.36 ± 0.48 |
1.48 |
|
5
|
4.66 ± 0.05 |
8.13 ± 0.04 |
1.51 |
Usually, quenching can occur by different mechanisms and are classified as either dynamic quenching or static quenching. A dynamic quenching refers to a process in which the fluorophore and the quencher come into contact during the transient existence of the excited state, while static quenching refers to fluorophore–quencher complex formation in the ground state. A simple method to examine the type of quenching is UV-visible absorption spectroscopy. UV-visible spectra of BSA in the absence and presence of the complexes (Fig. 10) show that the absorption intensity of BSA was enhanced as the complexes were added, and there was a small blue shift of about 1–2 nm in the presence of the complexes. This indicated only a static interaction between BSA and the added complexes due to the formation of the ground state complex of the type BSA–complex reported earlier.36
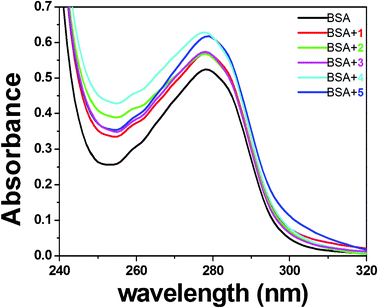 |
| | Fig. 10 UV absorption spectra of BSA (10 μM) in the absence and presence (5 μM) of complexes 1 (A), 2 (B), 3 (C), 4 (D) and 5 (E). | |
2.4.2. Characteristics of synchronous fluorescence spectra.
To obtain reasonable information on the molecular microenvironment, particularly in the vicinity of the fluorophore functional groups, the structural changes occurring to BSA upon the addition of the new complexes were studied through synchronous fluorescence spectra.37 It is well-known that the fluorescence of BSA is normally due to the presence of tyrosine, tryptophan and phenylalanine residues and hence spectroscopic methods are usually applied to study the conformation of serum protein. According to Miller,38 the difference between the excitation wavelength and emission wavelength (Δλ = λem − λexc) indicates the type of chromophore involved. While a higher Δλ value such as 60 nm is indicative of the characteristic of a tryptophan residue, a lower Δλ value such as 15 nm is characteristic of a tyrosine residue.39 The synchronous fluorescence spectra of BSA with various concentrations of complexes 1–5 recorded at Δλ = 15 nm and Δλ = 60 nm are shown in Fig. 11 and S6 (ESI†) and Fig. 12 and S7 (ESI†), respectively. In the synchronous fluorescence spectra of BSA at Δλ = 15, addition of the complexes to the solution of BSA resulted in a small decrease of the fluorescence intensity of BSA at 302 nm, of up to 52.12, 65.49, 70.65, 80.69 and 79.94% of the initial fluorescence intensity of BSA for the nickel(II) complexes 1–5, respectively. However, in the case of synchronous fluorescence spectra of BSA at Δλ = 60, addition of the complexes to the solution of BSA resulted in a significant decrease of the fluorescence intensity of BSA at 343 nm, of up to 85.84, 91.32, 92.76, 94.80 and 93.31% of the initial fluorescence intensity of BSA accompanied by a small blue shift of 1 nm for all the complexes. Hence, the synchronous fluorescence spectral studies clearly suggested that the fluorescence intensities of both the tryptophan and tyrosine were decreased but the emission wavelength of the tryptophan residues is blue shifted with increasing concentration of complexes. However, there was no change in the emission wavelength of tyrosine. This suggests that the interaction of complexes with BSA affects the conformation of the tryptophan microregion19 revealing that the hydrophobicity around the tryptophan residues is strengthened. The hydrophobicity observed in fluorescence and synchronous measurements confirmed the effective binding of all the complexes with BSA. Hence, the strong interaction of these new nickel(II) octahedral complexes with BSA suggested that the complexes may be suitable for anticancer studies.
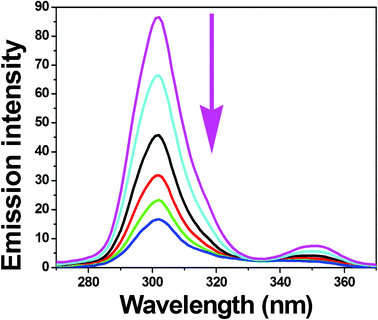 |
| | Fig. 11 Synchronous spectra of BSA (1 μM) in the presence of increasing amounts of complex 4 (0–25 μM) for a wavelength difference of Δλ = 15 nm. The arrow shows the emission intensity changes upon increasing concentration of complex. | |
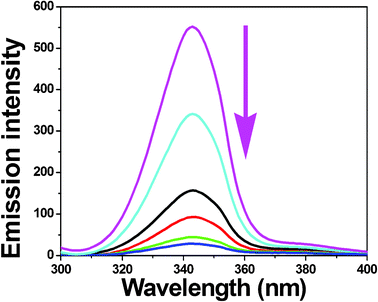 |
| | Fig. 12 Synchronous spectra of BSA (1 μM) in the presence of increasing amounts of complex 4 (0–25 μM) for a wavelength difference of Δλ = 60 nm. The arrow shows the emission intensity changes upon increasing concentration of complex. | |
2.5. Antioxidant activity
Since the binding experiments conducted so far revealed that the complexes exhibit a good DNA and protein binding affinity, it was considered worthwhile to study the antioxidant activity of these complexes. The antioxidant properties of quinoline derivatives and its corresponding transition-metal complexes have attracted substantial interest and have been extensively investigated, though mainly in in vitro systems.19,20 DPPH assay is widely used for assessing the ability of radical scavenging activity and is measured in terms of IC50 values (the concentration of the compound required to inhibit 50% of DPPH˙ concentration). Because of the presence of an unpaired electron, DPPH shows a strong absorption band at 517 nm in the visible spectrum. Since antioxidants donate protons to this radical, the initial absorbance of DPPH solution decreases as the concentration of added antioxidant increases. The DPPH assay results for our complexes are given in Table 5. It is seen from the results that the complexes 2, 3 and 5 exhibited good activities compared to the standards butylated hydroxyanisole (BHA) and butylated hydroxytoluene (BHT). However, complex 5 showed better activity when compared to other complexes (Table 5) which may be due to the more electron donating group present at terminal nitrogen of the thiosemicarbazone ligand. The determinations were performed at various concentrations and the radical scavenging activity of the complexes was expressed as the percentage inhibition of the absorbance of the initial ABTS solution. From the results obtained through the ABTS assays, it is seen that the all the complexes showed higher radical scavenging activity when compared to the standards.
Table 5 IC50 values (μM) calculated from DPPH and ABTS assays of Ni(II) complexes 1–5 and standards (BHA and BHT)
| Complex |
DPPH |
ABTS |
|
1
|
25.45 |
21.30 |
|
2
|
12.16 |
15.52 |
|
3
|
10.12 |
16.40 |
|
4
|
27.01 |
22.24 |
|
5
|
8.10 |
14.24 |
| BHA |
25.58 |
21.58 |
| BHT |
45.99 |
37.99 |
2.6. Cytotoxic activity studies
2.6.1. MTT assay.
Cytotoxicity assay for the new Ni(II) complexes was assessed using the method of MTT reduction with cisplatin used as a positive control. The complexes were found to be cytotoxic to lung cancer cell line (A549). The IC50 values (50% inhibition of cell growth for 48 h) of the nickel complexes are shown in Table 6. The new nickel(II) complexes exhibited high cytotoxic effects on lung cancer cells with low IC50 values indicating their efficiency in killing cancer cells even at low concentrations. The cytotoxic effectiveness of complexes 4 and 5 with IC50 values of 12 and 15 μM were higher than that of cisplatin (IC50 = 25 μM). There are reports in the literature on the cytotoxic effects of the complexes with longer incubation time periods and such longer incubation period may result in the development of cellular resistance for that particular complex. However, the data obtained for our complexes showed higher cytotoxicity with short incubation period which is highly significant when compared to the results of Beckford et al.40 Furthermore, the IC50 values of 12 and 15 μM for complexes 4 and 5 showed a higher cytotoxic effect when compared to the other Ni(II) complexes indicating that the phenyl and dimethyl substitution at terminal nitrogen of the ligand and the cationic nature of the complex played a vital role for the enhanced antitumor activities.
Table 6 Cytotoxic activities of Ni(II) complexes 1–5. Results quoted are mean ± SD (n = 9) of the IC50 value in MTT assay, percentage of lactate dehydrogenase (LDH) released and moles of nitrite released in nitric oxide assay (n). Results are from three separate experiments performed in triplicate
| Complex |
IC50/μM |
LDHrel (%) |
n/mol |
|
1
|
39 ± 1.02 |
35 |
15.689 |
|
2
|
38 ± 0.99 |
37 |
17.352 |
|
3
|
32 ± 1.35 |
39 |
18.472 |
|
4
|
12 ± 0.58 |
46 |
18.819 |
|
5
|
15 ± 0.26 |
45 |
16.269 |
| Cisplatin |
25 ± 1.79 |
— |
— |
| Control |
— |
0 |
8.966 |
2.6.2. Lactate dehydrogenase release.
To further evaluate the toxicity, activity of LDH, a cytoplasmic enzyme released into surrounding media during cell death was also measured. Cell death by apoptosis generally leads to the release of cytoplasmic enzymes such as alkaline and acid phosphatase, glutamate-oxalacetate transaminase, glutamate pyruvate transaminase and arginosuccinatelyase. However, quantification has been limited due to the presence of low amounts in many cells and requirement of an elaborate kinetic assay. On the other hand, LDH is a stable cytoplasmic enzyme which is released into the culture medium following loss of membrane integrity resulting from apoptosis. LDH activity, therefore, can be used as an indicator of cell membrane integrity and serves as a general means to assess cytotoxicity resulting from chemical compounds or environmental toxic factors.41,42 As can be seen from Table 6, a significant difference was observed between the control cells and cells treated with complexes 1–5 after 48 h of treatment, indicating that the new Ni(II) complexes leads to the release of a significant level of lactate dehydrogenase by A549 cell line into the culture medium.
2.6.3. Nitric oxide assay.
Nitric oxide (NO) has been assumed to have an important functional role in a variety of physiological systems. Generally, NO is derived from L-arginine by the action of NO synthase (NOS), an enzyme existing in three isoforms. Among them, two isoforms exist constitutively while the third isoform is an inducible form (iNOS) which is expressed in response to stress. NO is a gaseous signaling molecule and its stable product is nitrite. Nitric oxide is a well-known short lived free radical produced non-enzymatically by iNOS which causes damage in most biomolecules, including DNA and proteins.43 The level of nitrite was found to increase significantly in the nickel complexes treated cells compared to the control (Table 6). The increased level of nitrite in the cell culture medium further confirms the cytotoxic effects of the presently studied complexes.
3. Conclusion
Five new nickel(II) complexes of 6-methoxy-2-oxo-1,2-dihydroquinoline-3-carbaldehyde 4N-substituted thiosemicarbazone complexes have been synthesized and characterized. The molecular structure of one of the complexes 5 has been confirmed by single-crystal X-ray diffraction methods. The DNA interaction of the compounds has been evaluated by UV-visible and fluorescence spectroscopy which revealed that all the complexes can bind to DNA via intercalation in the order of 1 < 2 < 3 < 5 < 4. The experimental results suggested that the complex 4 can bind to DNA more strongly than the other four complexes. Binding affinity of the nickel complexes with BSA was significant and the synchronous spectral studies of the compounds showed that the complexes bound with BSA in both tyrosine and tryptophan residues. From the above studies we observed that the DNA interaction and protein binding has been enhanced while increasing the size of the substituent at the terminal nitrogen of the thiosemicarbazone ligand. The results of antioxidant studies indicate that the new nickel complexes possess significant antioxidant activity. In addition, the new complexes 4 and 5 showed excellent cytotoxicity against lung cancer cell line (A549) compared to cisplatin, which may be due to the cationic nature of the complex and aromatic group (complex 4), or electron donating dimethyl group (complex 5) present at the terminal nitrogen atom of the ligand.
4. Experimental section
4.1. Materials and instrumentation
All starting materials used throughout the experiments were of analytical or chemically pure grade. 6-Methoxy-2-oxo-1,2-dihydro-quinoline-3-carbaldehyde and the ligand were prepared according to the literature procedures.44,28 Solvents were purified and dried according to standard procedures.45 The reagents were purchased commercially and used without further purification unless otherwise noted. CT-DNA, BSA, Agarose and EB were obtained from Sigma-Aldrich and used as received. Elemental analyses (C, H, N, S) were performed on Vario EL III Elemental analyzer instrument. IR spectra (400–0400 cm−1) for KBr disks were recorded on a Nicolet Avatar Model FT-IR spectrophotometer. Melting points were determined with a Lab India instrument. Electronic absorption spectra were recorded using a Jasco V-630 spectrophotometer. Emission spectra were measured with a Jasco FP 6600 spectrofluorometer.
4.2. Preparation of the complexes
4.2.1. [Ni(H2L1)2]NO3·4H2O (1).
A warm methanolic solution (20 mL) containing 6-methoxy-2-oxo-1,2-dihydroquinoline-3-carbaldehydethiosemicarbazone (H2L1) (138 mg, 0.5 mmol) was added to a methanolic solution (20 mL) of Ni(NO3)2·6H2O (145 mg, 0.5 mmol). The resulting red solution was refluxed for 1 h and a red crystalline powder was obtained on slow evaporation. This was filtered off, washed with cold methanol and dried under vacuum. Yield: 87%, mp 239–241 °C. Calc. for C24H32N10NiO14S2: C, 35.70; H, 3.99; N, 17.35; S, 7.94. Found: C, 35.81; H, 3.86; N, 17.42; S, 7.89%. IR (KBr, cm−1): 3342(ms) ν(NH); 1631(s) ν(C![[double bond, length as m-dash]](https://www.rsc.org/images/entities/char_e001.gif) O); 1600(s) ν(C
O); 1600(s) ν(C![[double bond, length as m-dash]](https://www.rsc.org/images/entities/char_e001.gif) N); 825(m) ν(C
N); 825(m) ν(C![[double bond, length as m-dash]](https://www.rsc.org/images/entities/char_e001.gif) S). UV-visible (solvent DMSO, λ/nm (ε/M−1 cm−1)): 265 (13
S). UV-visible (solvent DMSO, λ/nm (ε/M−1 cm−1)): 265 (13![[thin space (1/6-em)]](https://www.rsc.org/images/entities/char_2009.gif) 242) (ILCT); 412 (19
242) (ILCT); 412 (19![[thin space (1/6-em)]](https://www.rsc.org/images/entities/char_2009.gif) 932) (LMCT).
932) (LMCT).
4.2.2. [Ni(H2L2)2]NO3·4H2O (2).
Complex 2 was prepared using the same procedure as described for 1 with 6-methoxy-2-oxo-1,2-dihydroquinoline-3-carbaldehyde-4N-methylthiosemicarbazone (145 mg, 0.5 mmol) and Ni(NO3)2·6H2O (145 mg, 0.5 mmol). A red crystalline powder was obtained. Yield: 83%, mp 256–258 °C. Calc. for C26H36N10NiO14S2: C, 37.37; H, 4.34; N, 16.76; S, 7.71. Found: C, 37.45; H, 4.21; N, 16.69; S, 7.83%. IR (KBr, cm−1): 3351(ms) ν(NH); 1654(s) ν(C![[double bond, length as m-dash]](https://www.rsc.org/images/entities/char_e001.gif) O); 1506(s) ν(C
O); 1506(s) ν(C![[double bond, length as m-dash]](https://www.rsc.org/images/entities/char_e001.gif) N); 824(m) ν(C
N); 824(m) ν(C![[double bond, length as m-dash]](https://www.rsc.org/images/entities/char_e001.gif) S). UV-visible (solvent DMSO, λ/nm (ε/M−1 cm−1)): 265 (18
S). UV-visible (solvent DMSO, λ/nm (ε/M−1 cm−1)): 265 (18![[thin space (1/6-em)]](https://www.rsc.org/images/entities/char_2009.gif) 492) (ILCT); 413 (27
492) (ILCT); 413 (27![[thin space (1/6-em)]](https://www.rsc.org/images/entities/char_2009.gif) 672) (LMCT).
672) (LMCT).
4.2.3. [Ni(H2L3)2]NO3·4H2O (3).
Complex 3 was prepared using the same procedure as described for 1 with 6-methoxy-2-oxo-1,2-dihydroquinoline-3-carbaldehyde-4N-ethylthiosemicarbazone (152 mg, 0.5 mmol) and Ni(NO3)2·6H2O (145 mg, 0.5 mmol). A red crystalline powder was obtained. Yield 89%, mp 281–283 °C. Calc. for C28H40N10NiO14S2: C, 38.95; H, 4.67; N, 16.22; S, 7.43. Found: C, 38.73; H, 4.59; N, 16.31; S, 7.37%. IR (KBr, cm−1): 3394(ms) ν(NH); 1645(s) ν(C![[double bond, length as m-dash]](https://www.rsc.org/images/entities/char_e001.gif) O); 1563(s) ν(C
O); 1563(s) ν(C![[double bond, length as m-dash]](https://www.rsc.org/images/entities/char_e001.gif) N); 826(m) ν(C
N); 826(m) ν(C![[double bond, length as m-dash]](https://www.rsc.org/images/entities/char_e001.gif) S). UV-visible (solvent DMSO, λ/nm (ε/M−1 cm−1)): 265 (18
S). UV-visible (solvent DMSO, λ/nm (ε/M−1 cm−1)): 265 (18![[thin space (1/6-em)]](https://www.rsc.org/images/entities/char_2009.gif) 447) (ILCT); 413 (27
447) (ILCT); 413 (27![[thin space (1/6-em)]](https://www.rsc.org/images/entities/char_2009.gif) 952) (LMCT).
952) (LMCT).
4.2.4. [Ni(H2L4)2]NO3·4H2O (4).
Complex 4 was prepared using the same procedure as described for 1 with 6-methoxy-2-oxo-1,2-dihydroquinoline-3-carbaldehyde-4N-phenylthiosemicarbazone (176 mg, 0.5 mmol) and Ni(NO3)2·6H2O (145 mg, 0.5 mmol). A red coloured crystalline powder was obtained. Yield: 78%, mp 294–296 °C. Calc. for C36H40N10NiO14S2: C, 45.06; H, 4.20; N, 14.60; S, 6.68. Found: C, 45.11; H, 4.16; N, 14.57; S, 6.73%. IR (KBr, cm−1): 3388(ms) ν(NH); 1628(s) ν(C![[double bond, length as m-dash]](https://www.rsc.org/images/entities/char_e001.gif) O); 1564(s) ν(C
O); 1564(s) ν(C![[double bond, length as m-dash]](https://www.rsc.org/images/entities/char_e001.gif) N); 827(m) ν(C
N); 827(m) ν(C![[double bond, length as m-dash]](https://www.rsc.org/images/entities/char_e001.gif) S). UV-visible (solvent DMSO, λ/nm (ε/M−1 cm−1)): 265 (48
S). UV-visible (solvent DMSO, λ/nm (ε/M−1 cm−1)): 265 (48![[thin space (1/6-em)]](https://www.rsc.org/images/entities/char_2009.gif) 207) (ILCT); 414 (50
207) (ILCT); 414 (50![[thin space (1/6-em)]](https://www.rsc.org/images/entities/char_2009.gif) 606) (LMCT).
606) (LMCT).
4.2.5. [Ni(H2L)2](NO3)2·4H2O (5).
Complex 5 was prepared using the same procedure as described for 1 with 6-methoxy-2-oxo-1,2-dihydroquinoline-3-carbaldehyde-4N,N-dimethyl thiosemicarbazone (148 mg, 0.5 mmol) and Ni(NO3)2·6H2O (145 mg, 0.5 mmol). The resulting red solution was refluxed for 1 h. Dark red crystals were obtained on slow evaporation which were found to be suitable for X-ray diffraction. They were filtered off, washed with cold methanol, and dried under vacuum. Yield: 81%, mp 321–323 °C. Calc. for C28H40N10NiO14S2: C, 38.95; H, 4.67; N, 16.22; S, 7.43. Found: C, 38.86; H, 4.73; N, 16.17; S, 7.35%. IR (KBr, cm−1): 3414(ms) ν(NH); 1643(s) ν(C![[double bond, length as m-dash]](https://www.rsc.org/images/entities/char_e001.gif) O); 1587(s) ν(C
O); 1587(s) ν(C![[double bond, length as m-dash]](https://www.rsc.org/images/entities/char_e001.gif) N); 829(m) ν(C
N); 829(m) ν(C![[double bond, length as m-dash]](https://www.rsc.org/images/entities/char_e001.gif) S). UV-visible (solvent DMSO, λ/nm (ε/M−1 cm−1)): 261(31
S). UV-visible (solvent DMSO, λ/nm (ε/M−1 cm−1)): 261(31![[thin space (1/6-em)]](https://www.rsc.org/images/entities/char_2009.gif) 311) (ILCT); 328(15
311) (ILCT); 328(15![[thin space (1/6-em)]](https://www.rsc.org/images/entities/char_2009.gif) 802), 429 (30
802), 429 (30![[thin space (1/6-em)]](https://www.rsc.org/images/entities/char_2009.gif) 480) (LMCT).
480) (LMCT).
4.3. Single-crystal X-ray diffraction studies
Diffraction data were collected on a Bruker AXS SMART APEX CCD diffractometer at 100 K using monochromated Mo-Kα radiation with the ω-scan technique. Data for the nickel complex were collected, its unit cell determined, and the data integrated and corrected for absorption and other systematic errors using the Apex2 suite of programs.46 The structure was solved by Patterson methods and refined by full-matrix least squares against F2 with all reflections using SHELXTL.47 Reflection −1 1 1 was obstructed by the beam stop and was omitted from the refinement.
4.4. DNA binding studies
All of the experiments involving the binding of compounds with CT-DNA were carried out in double distilled water with tris(hydroxymethyl)aminomethane (Tris, 5 mM) and sodium chloride (50 mM) and adjusted to pH 7.2 with hydrochloric acid. A solution of CT-DNA in the buffer gave a ratio of UV absorbance of about 1.9 at 260 and 280 nm, indicating that the DNA was sufficiently free of protein. The DNA concentration per nucleotide was determined by absorption spectroscopy using a molar extinction coefficient value of 6600 M−1 cm−1 at 260 nm. The complexes were dissolved in a mixed solvent of 5% DMSO–95% Tris-HCl buffer for all of the experiments. Absorption titration experiments were performed with a fixed concentration of the compounds (25 μM) while gradually increasing the concentration of DNA (0–50 μM). While measuring the absorption spectra, an equal amount of DNA was added to both the test solution and the reference solution to eliminate the absorbance of DNA itself. The same experimental procedure was also followed for the emission studies. Further support for the binding of complexes to DNA via intercalation is given through emission quenching experiments. DNA was pretreated with ethidium bromide for 30 min, then the test solutions were added to this mixture of EB-DNA, and the change in the fluorescence intensity was measured. The excitation and the emission wavelength were 515 and 604–605 nm, respectively.
4.5. Protein binding studies
The excitation wavelength of BSA at 280 nm and the emission at 345 nm were monitored for the protein binding studies. The excitation and emission slit widths and scan rates were maintained constant for all the experiments. Samples were carefully degassed using pure nitrogen gas for 15 min. Quartz cells (4 × 1 × 1 cm) with high vacuum Teflon stopcocks were used for degassing. A stock solution of BSA was prepared in 50 mM phosphate buffer (pH = 7.2) and stored in the dark at 4 °C for further use. Concentrated stock solution of the complexes were prepared as mentioned for the DNA binding experiments except that phosphate buffer was used instead of Tris-HCl buffer for all the experiments. Titrations were manually done by using a micropipette for the addition of the complexes. For synchronous fluorescence spectra measurements, the same concentration of BSA and the complexes were used and the spectra were measured at two different Δλ (difference between the excitation and emission wavelengths of BSA) values of 15 and 60 nm.
4.6. Antioxidant assays
The DPPH radical scavenging activity of the complexes was measured according to the method of Blois.48 The complexes at various concentrations were taken and the volume was adjusted to 100 μL with methanol. About 5 mL of a 0.1 mM methanolic solution of DPPH was added to the aliquots of complex and standards (BHA, BHT) and shaken vigorously. A negative control was prepared by adding 100 μL of methanol in 5 mL of a 0.1 mM methanolic solution of DPPH. The tubes were allowed to stand for 20 min at 27 °C. The absorbance of the sample was measured at 517 nm against the blank (methanol). Radical scavenging activity of the samples was expressed as IC50 (the concentration of the compound required to inhibit 50% of DPPH˙ concentration).
The total antioxidant activity of the samples was measured by ABTS radical cation decolorization assay according to the method of Re et al.49 ABTS˙+ (2,2′-azino-3-ethylbenzthiazoline-6-sulfonic acid diammonium salt) was produced by reacting 7 mM ABTS aqueous solution with 2.4 mM potassium persulfate in the dark for 12–16 h at room temperature. Prior to assay, this solution was diluted in ethanol (about 1![[thin space (1/6-em)]](https://www.rsc.org/images/entities/char_2009.gif) :
:![[thin space (1/6-em)]](https://www.rsc.org/images/entities/char_2009.gif) 89 v/v) and equilibrated at 30 °C to give an absorbance of 0.700 ± 0.02 at 734 nm. After the addition of 1 mL of diluted ABTS solution to various concentrations of the complexes in ethanol, the absorbance was measured at 30 °C exactly 30 min after the initial mixing.
89 v/v) and equilibrated at 30 °C to give an absorbance of 0.700 ± 0.02 at 734 nm. After the addition of 1 mL of diluted ABTS solution to various concentrations of the complexes in ethanol, the absorbance was measured at 30 °C exactly 30 min after the initial mixing.
4.7. Cytotoxicity assays
4.7.1. MTT assay.
The cytotoxic effect of the five new complexes on human lung cancer cells (A549) were assayed by the 3-(4,5-dimethylthiazol-2-yl)-2,5-diphenyltetrazolium bromide (MTT) assay.50 The cells were seeded at a density of 10![[thin space (1/6-em)]](https://www.rsc.org/images/entities/char_2009.gif) 000 cells per well in 200 μL and then the complexes were added to the cells at a final concentration of 1, 10, 25 and 50 μM in the cell culture media. After 48 h, the wells were treated with 20 μL MTT (5 mg ml−1 PBS) and incubated at 37 °C for 4 h. The purple formazan crystals formed were dissolved in 200 μL DMSO and read at 570 nm in a microplate reader.
000 cells per well in 200 μL and then the complexes were added to the cells at a final concentration of 1, 10, 25 and 50 μM in the cell culture media. After 48 h, the wells were treated with 20 μL MTT (5 mg ml−1 PBS) and incubated at 37 °C for 4 h. The purple formazan crystals formed were dissolved in 200 μL DMSO and read at 570 nm in a microplate reader.
4.7.2. Release of lactate dehydrogenase (LDH).
LDH activity was determined by the linear region of a pyruvate standard graph using regression analysis and expressed as percentage leakage as described previously.51 Briefly, to a set of tubes, 1 mL of buffered substrate (lithium lactate) and 0.1 mL of the media or cell extract were added and tubes were incubated at 37 °C for 30 min. After adding 0.2 mL of NAD solution, the incubation was continued for another 30 min. The reaction was then arrested by adding 0.1 mL of 2,4-dinitrophenylhydrazine (DNPH) reagent and the tubes were incubated for a further period of 15 min at 37 °C. 0.1 mL of media or cell extract was added to blank tubes after arresting the reaction with DNPH. Then 3.5 mL of 0.4 M sodium hydroxide was added to all the tubes. The colour developed was measured at 420 nm with a UV-visible spectrophotometer. The amount of LDH released was expressed as a percentage.
4.7.3. Nitric oxide (NO) assay.
The amount of nitrite was determined by the literature method.52 Nitrite reacts with Griess Reagent to give a coloured complex measured at 540 nm. To 100 μL of the medium, 50 μL of Griess reagent I was added, mixed and allowed to react for 10 min. This was followed by the addition of 50 μL of Griess reagent II and the reaction mixture was mixed well and incubated for another 10 min at room temperature. The pink colour developed was measured at 540 nm in a microquant plate reader (Biotek Instruments).
Acknowledgements
Council of Scientific and Industrial Research, New Delhi, India [Grant No. 21(0745)/09/EMR-II] for the financial assistance received and the award of CSIR-SRF to E. Ramachandran is gratefully acknowledged. The X-ray diffractometer was funded by NSF Grant 0087210, Ohio Board of Regents Grant CAP-491, and by Youngstown State University.
References
-
L. R. Kelland, N. P. Farell and S. Spinelli, in, Uses of Inorganic Chemistry in Medicine, ed. N. P. Farrell, RSC, Cambridge, 1999, pp. 109–134 Search PubMed.
- T. Boulikas and M. Vougiouka, Oncol. Rep., 2003, 10, 1663–1682 CAS.
- E. Wong and C. M. Giandomenico, Chem. Rev., 1999, 99, 2451–2466 CrossRef CAS.
- M. Galanski, V. B. Arion, M. A. Jakupec and B. K. Keppler, Curr. Pharm. Des., 2003, 9, 2078–2089 CrossRef CAS.
- D. Wang and S. J. Lippard, Nat. Rev. Drug Discovery, 2005, 4, 307–320 CrossRef CAS.
- A. M. Angeles-Boza, P. M. Bradley, P. K. Fu, S. E. Wicke, J. Bacsa, K. M. Dunbar and C. Turro, Inorg. Chem., 2004, 43, 8510–8519 CrossRef CAS.
- D. X. West, A. E. Liberta, S. B. Padhye, R. C. Chikate, P. B. Sonawane, A. S. Kumbhar and R. G. Xerande, Coord. Chem. Rev., 1993, 123, 49–71 CrossRef CAS.
- M. Baldini, M. B. Ferrari, F. Bisceglie, G. Pelosi, S. Pinelli and P. Tarasconi, Inorg. Chem., 2003, 42, 2049–2055 CrossRef CAS.
- X. Du, C. Guo, E. Hansel, P. S. Doyle, C. R. Caffrey, T. P. Holler, J. H. McKerrow and F. E. Cohen, J. Med. Chem., 2002, 45, 2695–2707 CrossRef CAS.
- C. R. Kowol, R. Trondl, V. B. Arion, M. A. Jakupec, I. Lichtscheidl and B. K. Keppler, Dalton Trans., 2010, 39, 704–706 RSC.
- J. E. Karp, F. J. Giles, I. Gojo, L. Morris, J. Greer, B. Johnson, M. Thein, M. Sznol and J. Low, Leuk. Res., 2008, 32, 71–78 CrossRef CAS.
- A. Mishra, N. K. Kaushik, A. K. Verma and R. Gupta, Eur. J. Med. Chem., 2008, 43, 2189–2196 CrossRef CAS.
- A. R. Cowley, J. R. Dilworth, P. S. Donnelly, E. Labisbal and A. Sousa, J. Am. Chem. Soc., 2002, 124, 270–5271 CrossRef.
- H. Beraldo and D. Gambino, Mini-Rev. Med. Chem., 2004, 4, 31–39 CrossRef CAS.
- R. Prabhakaran, P. Kalaivani, R. Jayakumar, M. Zeller, A. D. Hunter, S. V. Renukadevi, E. Ramachandran and K. Natarajan, Metallomics, 2011, 3, 42–48 RSC.
- P. Kalaivani, R. Prabhakaran, F. Dallemer, P. Poornima, E. Vaishnavi, E. Ramachandran, V. V. Padma, R. Renganathan and K. Natarajan, Metallomics, 2012, 4, 101–113 RSC.
- E. Ramachandran, P. Kalaivani, R. Prabhakaran, N. P. Rath, S. Brinda, P. Poornima, V. V. Padma and K. Natarajan, Metallomics, 2012, 4, 218–227 RSC.
- P. Kalaivani, R. Prabhakaran, E. Ramachandran, F. Dallemer, G. Paramaguru, R. Renganathan, P. Poornima, V. V. Padma and K. Natarajan, Dalton Trans., 2012, 41, 2486–2499 RSC.
- D. Senthil Raja, G. Paramaguru, N. S. P. Bhuvanesh, J. H. Reibenspies, R. Renganathan and K. Natarajan, Dalton Trans., 2011, 40, 4548–4559 RSC.
- D. Senthil Raja, N. S. P. Bhuvanesh and K. Natarajan, Eur. J. Med. Chem., 2011, 46, 4584–4594 CrossRef.
- E. Ramachandran, P. Kalaivani, R. Prabhakaran, M. Zeller, J. H. Bartlett, P. O. Adero, T. R. Wagner and K. Natarajan, Inorg. Chim. Acta, 2012, 385, 94–99 CrossRef CAS.
- E. Ramachandran, S. P. Thomas, P. Poornima, P. Kalaivani, R. Prabhakaran, V. V. Padma and K. Natarajan, Eur. J. Med. Chem., 2012, 50, 405–415 CrossRef CAS.
- D. Senthil Raja, N. S. P. Bhuvanesh and K. Natarajan, Inorg. Chem., 2011, 50, 12852–12866 CrossRef.
- M. C. Prabahkara and H. S. B. Naik, BioMetals, 2008, 21, 675–684 CrossRef CAS.
- G. Kumar, D. Kumar, S. Devi, R. Johari and C. P. Singh, Eur. J. Med. Chem., 2010, 45, 3056–3062 CrossRef CAS.
- A. F. Tanious, D. Y. Ding, D. A. Patrick, C. Bailly, R. R. Tidwell and W. D. Wilson, Biochemistry, 2000, 39, 12091–12101 CrossRef.
- C. Y. Zhong, J. Zhao, Y. B. Wu, C. X. Yin and P. Yang, J. Inorg. Biochem., 2007, 101, 10–18 CrossRef.
- Z. C. Liu, B. D. Wang, Z. Y. Yang, Y. Li, D. D. Qin and T. R. Li, Eur. J. Med. Chem., 2009, 44, 4477–4484 CrossRef CAS.
- Z. C. Liu, B. D. Wang, B. Li, Q. Wang, Z. Y. Yang, T. R. Li and Y. Li, Eur. J. Med. Chem., 2010, 45, 5353–5361 CrossRef CAS.
- A. Wolf, G. H. Shimer and T. Meehan, Biochemistry, 1987, 26, 6392–6396 CrossRef.
- F. J. Meyer-Almes and D. Porschke, Biochemistry, 1993, 32, 4246–4253 CrossRef CAS.
- G. M. Howe, K. C. Wu and W. R. Bauer, Biochemistry, 1976, 19, 339–347 Search PubMed.
- Y. B. Zeng, N. Yang, W. S. Liu and N. Tang, J. Inorg. Biochem., 2003, 97, 258–264 CrossRef CAS.
- D. Senthil Raja, N. S. P. Bhuvanesh and K. Natarajan, Eur. J. Med. Chem., 2012, 47, 73–85 CrossRef CAS.
- Y. Li, Z. Y. Yang and J. C. Wu, Eur. J. Med. Chem., 2010, 45, 5692–5701 CrossRef CAS.
- Y. Hu, Y. Yang, C. Dai, Y. Liu and X. Xiao, Biomacromolecules, 2010, 11, 106–112 CrossRef CAS.
-
G. Z. Chen, X. Z. Huang, J. G. Xu, Z. B. Wang and Z. Z. Zhang, Method of Fluorescent Analysis, 2nd edn, Science Press, Beijing, 1990 Search PubMed.
- J. N. Miller, Proc. Anal. Div. Chem. Soc., 1979, 16, 203–208 CAS.
- E. A. Brustein, N. S. Vedenkina and M. N. Irkova, Photochem. Photobiol., 1973, 18, 263–279 CrossRef.
- F. A. Beckford, M. Shaloski, G. Leblanc, J. Thessing, L. C. L. Alleyne, A. A. Holder, L. Li and N. P. Seeram, Dalton Trans., 2009, 10757–10764 RSC.
- E. Bonfoco, D. Krainc, M. Ankarcrona, P. Nicotera and S. A. Lipton, Proc. Natl. Acad. Sci. U. S. A., 1995, 92, 7162–7166 CrossRef CAS.
- C. Legrand, J. M. Bour, C. Jacob, J. Capiaumont, A. Martial, A. Marc, M. Wudtke, G. Kretzmer, C. Demangel, D. Duval and J. Hache, J. Biotechnol., 1992, 25, 231–243 CrossRef CAS.
- L. Yu, P. E. Gengaro, M. Niederberger, T. J. Burke and R. W. Schriert, Proc. Natl. Acad. Sci. U. S. A., 1994, 91, 1691–1695 CrossRef CAS.
- M. K. Singh, A. Chandra, B. Singh and R. M. Singh, Tetrahedron Lett., 2007, 48, 5987–5990 CrossRef CAS.
-
A. I. Vogel, Text Book of Practical Organic Chemistry, Longman, London, 5th edn, 1989, p. 268 Search PubMed.
- Apex2 v2011.2-0, 2011, Bruker Advanced X-ray Solutions, Bruker AXS Inc., Madison, WI, USA Search PubMed.
- SHELXTL (Version 6.14) 2000–2003, Bruker Advanced X-ray Solutions, Bruker AXS Inc., Madison, WI, USA Search PubMed.
- M. S. Blois, Nature, 1958, 181, 1199–1200 CrossRef CAS.
- R. Re, N. Pellegrini, A. Proteggente, A. Pannala, M. Yang and C. Rice-Evans, Free Radical Biol. Med., 1999, 26, 1231–1237 CrossRef CAS.
- T. Mossman, J. Immunol. Methods, 1983, 65, 55–63 CrossRef.
- W. E. C. Wacker, D. D. Ulmer and B. L. Valee, N. Engl. J. Med., 1956, 255, 449–455 CrossRef CAS.
- D. J. Stueher and M. A. Marletta, J. Immunol., 1987, 139, 518–525 Search PubMed.
Footnote |
| † Electronic supplementary information (ESI) available: Depiction of the disorder present for the terminal methoxy groups (Fig. S1). Hydrogen bonding interactions and formation of wave-like layers of water molecules and nitrate anions (Fig. S2). Electronic spectra of binding of complexes 1, 2, 3 and 5 with CT-DNA (Fig. S3), Emission spectra of the DNA–EB system, λexc = 515 nm, λem = 530–750 nm, in the presence of complexes 1, 2, 3 and 5 (Fig. S4). Emission spectra of binding of complexes 1, 2, 3 and 5 with protein (Fig. S5) and synchronous spectra (Δλ = 15 nm, Fig. S6; Δλ = 60 nm, Fig. S7) of binding of complexes 1, 2, 3 and 5 with protein. CCDC reference number 817179 (5). For ESI and crystallographic data in CIF or other electronic format see DOI: 10.1039/c2ra21199h |
|
| This journal is © The Royal Society of Chemistry 2012 |
Click here to see how this site uses Cookies. View our privacy policy here. 
![[double bond, length as m-dash]](https://www.rsc.org/images/entities/char_e001.gif) O), ν(C
O), ν(C![[double bond, length as m-dash]](https://www.rsc.org/images/entities/char_e001.gif) N) and ν(C
N) and ν(C![[double bond, length as m-dash]](https://www.rsc.org/images/entities/char_e001.gif) S) frequencies of the complexes with respect to the free ligand indicated the coordination of the ligand to the nickel ion in the complex.25 In all the complexes, it has been observed that the thiosemicarbazones behaved as ONS neutral tridentate ligands and the complexes were neutralised by two nitrate ions. The electronic spectra of all the complexes exhibited bands in the regions of 261–265 and 412–429 nm which are attributed to the intraligand π→π* transitions within the coordinated ligand moiety and ligand-to-metal charge-transfer (LMCT) transitions, respectively.18
S) frequencies of the complexes with respect to the free ligand indicated the coordination of the ligand to the nickel ion in the complex.25 In all the complexes, it has been observed that the thiosemicarbazones behaved as ONS neutral tridentate ligands and the complexes were neutralised by two nitrate ions. The electronic spectra of all the complexes exhibited bands in the regions of 261–265 and 412–429 nm which are attributed to the intraligand π→π* transitions within the coordinated ligand moiety and ligand-to-metal charge-transfer (LMCT) transitions, respectively.18

![[thin space (1/6-em)]](https://www.rsc.org/images/entities/char_2009.gif) 410
410
![Electronic spectra of complex 4 in Tris-HCl buffer upon addition of CT-DNA: [Complex] = 25 μM, [DNA] = 0–50 μM. The arrow shows that the absorption intensities decrease upon increasing DNA concentration.](/image/article/2012/RA/c2ra21199h/c2ra21199h-f3.gif)
![Plots of [DNA]/(εa − εf) vs. [DNA] for the nickel(ii) complexes 1–5 with CT-DNA.](/image/article/2012/RA/c2ra21199h/c2ra21199h-f4.gif)
![The emission spectra of the DNA–EB system (λexc = 515 nm, λem = 530–750 nm), in the presence of complex 4. [DNA] = 12 μM, [Complex] = 0–75 μM, [EB] = 12 μM. The arrow shows the emission intensity changes upon increasing complex concentration.](/image/article/2012/RA/c2ra21199h/c2ra21199h-f5.gif)

![[thin space (1/6-em)]](https://www.rsc.org/images/entities/char_2009.gif) Kbin + n
Kbin + n![[thin space (1/6-em)]](https://www.rsc.org/images/entities/char_2009.gif) log[Q]
log[Q]


![[double bond, length as m-dash]](https://www.rsc.org/images/entities/char_e001.gif) O); 1600(s) ν(C
O); 1600(s) ν(C![[double bond, length as m-dash]](https://www.rsc.org/images/entities/char_e001.gif) N); 825(m) ν(C
N); 825(m) ν(C![[double bond, length as m-dash]](https://www.rsc.org/images/entities/char_e001.gif) S). UV-visible (solvent DMSO, λ/nm (ε/M−1 cm−1)): 265 (13
S). UV-visible (solvent DMSO, λ/nm (ε/M−1 cm−1)): 265 (13![[thin space (1/6-em)]](https://www.rsc.org/images/entities/char_2009.gif) 242) (ILCT); 412 (19
242) (ILCT); 412 (19![[thin space (1/6-em)]](https://www.rsc.org/images/entities/char_2009.gif) 932) (LMCT).
932) (LMCT).
![[double bond, length as m-dash]](https://www.rsc.org/images/entities/char_e001.gif) O); 1506(s) ν(C
O); 1506(s) ν(C![[double bond, length as m-dash]](https://www.rsc.org/images/entities/char_e001.gif) N); 824(m) ν(C
N); 824(m) ν(C![[double bond, length as m-dash]](https://www.rsc.org/images/entities/char_e001.gif) S). UV-visible (solvent DMSO, λ/nm (ε/M−1 cm−1)): 265 (18
S). UV-visible (solvent DMSO, λ/nm (ε/M−1 cm−1)): 265 (18![[thin space (1/6-em)]](https://www.rsc.org/images/entities/char_2009.gif) 492) (ILCT); 413 (27
492) (ILCT); 413 (27![[thin space (1/6-em)]](https://www.rsc.org/images/entities/char_2009.gif) 672) (LMCT).
672) (LMCT).
![[double bond, length as m-dash]](https://www.rsc.org/images/entities/char_e001.gif) O); 1563(s) ν(C
O); 1563(s) ν(C![[double bond, length as m-dash]](https://www.rsc.org/images/entities/char_e001.gif) N); 826(m) ν(C
N); 826(m) ν(C![[double bond, length as m-dash]](https://www.rsc.org/images/entities/char_e001.gif) S). UV-visible (solvent DMSO, λ/nm (ε/M−1 cm−1)): 265 (18
S). UV-visible (solvent DMSO, λ/nm (ε/M−1 cm−1)): 265 (18![[thin space (1/6-em)]](https://www.rsc.org/images/entities/char_2009.gif) 447) (ILCT); 413 (27
447) (ILCT); 413 (27![[thin space (1/6-em)]](https://www.rsc.org/images/entities/char_2009.gif) 952) (LMCT).
952) (LMCT).
![[double bond, length as m-dash]](https://www.rsc.org/images/entities/char_e001.gif) O); 1564(s) ν(C
O); 1564(s) ν(C![[double bond, length as m-dash]](https://www.rsc.org/images/entities/char_e001.gif) N); 827(m) ν(C
N); 827(m) ν(C![[double bond, length as m-dash]](https://www.rsc.org/images/entities/char_e001.gif) S). UV-visible (solvent DMSO, λ/nm (ε/M−1 cm−1)): 265 (48
S). UV-visible (solvent DMSO, λ/nm (ε/M−1 cm−1)): 265 (48![[thin space (1/6-em)]](https://www.rsc.org/images/entities/char_2009.gif) 207) (ILCT); 414 (50
207) (ILCT); 414 (50![[thin space (1/6-em)]](https://www.rsc.org/images/entities/char_2009.gif) 606) (LMCT).
606) (LMCT).
![[double bond, length as m-dash]](https://www.rsc.org/images/entities/char_e001.gif) O); 1587(s) ν(C
O); 1587(s) ν(C![[double bond, length as m-dash]](https://www.rsc.org/images/entities/char_e001.gif) N); 829(m) ν(C
N); 829(m) ν(C![[double bond, length as m-dash]](https://www.rsc.org/images/entities/char_e001.gif) S). UV-visible (solvent DMSO, λ/nm (ε/M−1 cm−1)): 261(31
S). UV-visible (solvent DMSO, λ/nm (ε/M−1 cm−1)): 261(31![[thin space (1/6-em)]](https://www.rsc.org/images/entities/char_2009.gif) 311) (ILCT); 328(15
311) (ILCT); 328(15![[thin space (1/6-em)]](https://www.rsc.org/images/entities/char_2009.gif) 802), 429 (30
802), 429 (30![[thin space (1/6-em)]](https://www.rsc.org/images/entities/char_2009.gif) 480) (LMCT).
480) (LMCT).
![[thin space (1/6-em)]](https://www.rsc.org/images/entities/char_2009.gif) :
:![[thin space (1/6-em)]](https://www.rsc.org/images/entities/char_2009.gif) 89 v/v) and equilibrated at 30 °C to give an absorbance of 0.700 ± 0.02 at 734 nm. After the addition of 1 mL of diluted ABTS solution to various concentrations of the complexes in ethanol, the absorbance was measured at 30 °C exactly 30 min after the initial mixing.
89 v/v) and equilibrated at 30 °C to give an absorbance of 0.700 ± 0.02 at 734 nm. After the addition of 1 mL of diluted ABTS solution to various concentrations of the complexes in ethanol, the absorbance was measured at 30 °C exactly 30 min after the initial mixing.![[thin space (1/6-em)]](https://www.rsc.org/images/entities/char_2009.gif) 000 cells per well in 200 μL and then the complexes were added to the cells at a final concentration of 1, 10, 25 and 50 μM in the cell culture media. After 48 h, the wells were treated with 20 μL MTT (5 mg ml−1 PBS) and incubated at 37 °C for 4 h. The purple formazan crystals formed were dissolved in 200 μL DMSO and read at 570 nm in a microplate reader.
000 cells per well in 200 μL and then the complexes were added to the cells at a final concentration of 1, 10, 25 and 50 μM in the cell culture media. After 48 h, the wells were treated with 20 μL MTT (5 mg ml−1 PBS) and incubated at 37 °C for 4 h. The purple formazan crystals formed were dissolved in 200 μL DMSO and read at 570 nm in a microplate reader.
