Capturing carbon dioxide from air using a fixed carrier facilitated transport membrane
Muhammad Syukri Abd
Rahaman
ac,
Lin
Zhang
*a,
Li-Hua
Cheng
b,
Xin-Hua
Xu
b and
Huan-Lin
Chen
a
aKey Laboratory of Biomass Chemical Engineering of Ministry of Education, Department of Chemical and Biological Engineering, Zhejiang University, Hangzhou, 310027, P.R. China. E-mail: linzhang@zju.edu.cn (Lin Zhang); Tel: +86-571-87952121; Fax: +86-571-87952121
bDepartment of Environmental Engineering, Zhejiang University, Hangzhou, 310058, P.R. China
cDepartment of Chemical and Process Engineering, National University of Malaysia, 43600 Selangor, Malaysia
First published on 28th August 2012
Abstract
This paper reports the facilitated separation process of carbon dioxide (CO2) from air using polyethylenimine (PEI)–poly(vinyl alcohol) (PVA)/polyethersulphone (PES) hollow fibre composite membranes. The membranes were prepared by coating a thin layer of PEI–PVA on PES hollow fibre membranes. The prepared membranes were assembled and tested for CO2 permeance and CO2/N2 selectivity using compressed air as the feed. The effects of the PEI concentration and drying temperature for the preparation of composite membranes were investigated, the operation conditions were optimised, and the capability of capturing CO2 from air was evaluated using these membranes. The drying temperature for maximising the CO2 reaction was found to be 100 °C. It was found that the separation performance increased when the PEI concentration increased. The highest permeance for a membrane containing 6% PEI was 1.4 × 10⁻⁷ mol m−2 s−1 Pa−1 with a CO2/N2 selectivity of up to 300 at a lower pressure (1 bar). At a higher feed pressure (3 bar), the permeance increased by 300% from 2.6 × 10⁻⁸ mol m−2 s−1 Pa−1 to 7.7 × 10⁻⁸ mol m−2 s−1 Pa−1 when the feed flow rate was increased. By using 6% PEI in the membrane active layer, a CO2 concentration of up to 0.8% was collected on the permeate side at the higher feed pressure (3 bar). These results clearly show that CO2 can be concentrated from air by a facilitated transport mechanism.
1. Introduction
The process of recapturing carbon dioxide (CO2) from the air is a new approach to complete the carbon cycle in the atmosphere. However, the capture of CO2 from air in comparison with capture from a flue gas stream is unfavourable because of the higher thermodynamic barrier due to the lower concentration of CO2 in air.1 Although the process needs high thermodynamic energy, capturing CO2 from ambient air could compensate for all CO2 emissions to the atmosphere in order to achieve stabilisation of global CO2 levels.In general, there are four CO2 separation processes (absorption, membrane gas separation, adsorption, and cryogenic fractionation) for capturing CO2.2 However, the associated cost, including the environmental impact, means that there is a need for other, more efficient separation processes that can be applied to CO2 capture. The use of a novel membrane process can be envisioned as a more energy efficient alternative, such as membrane contactor and facilitated transport. By using liquid absorbents, such as liquid alkanolamines as CO2 contactors, the CO2/N2 selectivity of poly(vinyl alcohol) (PVA) membranes can increase by more than 100-fold.3
Moreover, ionic liquid absorbents also have good feasibility for capturing CO2 from the air in practice,4 because CO2 has high solubility in ionic liquids. However, liquid absorbents always pose difficulties such as liquid degradation, leaking, equipment corrosion, and release of volatile organic compounds.5 Instead of liquid absorbents, our previous work6–8 attempted to use hydrogel-based membranes for the facilitated transport of CO2 to increase the selectivity of CO2 separation at low concentrations (<0.5%). Additionally, according to Xu et al.,9 amines in polymer form such as polyethylenimine (PEI) also demonstrate excellent performance in the capture of CO2. Fig. 1 schematically illustrates the CO2 and N2 transport mechanisms inside a facilitated transport membrane with the amine functional group. N2 transport follows the solution–diffusion mechanism, where N2 dissolves in the membrane material and then diffuses through the membrane along a concentration gradient. Except for the solution–diffusion mechanism, CO2 gas is also facilitated by reversible reactions between CO2 and the amine carrier. In a normal situation, 2 mol of amine groups could absorb 1 mol of CO2. However, by using PEI, numerous –NH functional groups will react with CO2 to form carbamate or bicarbonate under humid conditions, and the carbamate will be hydrolysed by water to regenerate an amine.10Eqn (1) to (6) show the possible reactions of the amine group in PEI with CO2 and H2O:
| 2RNH2 + CO2 → RNHCOO− + RNH3+ | (1) |
| RNHCOO− + H2O → RNH2 + HCO3− | (2) |
| 2R2NH + CO2 → R2NCOO− + R2NH2+ | (3) |
| R2NCOO− + H2O → R2NH + HCO3− | (4) |
| R3N + H2O → R3NH+ + OH− | (5) |
| CO2 + OH− → HCO3− | (6) |
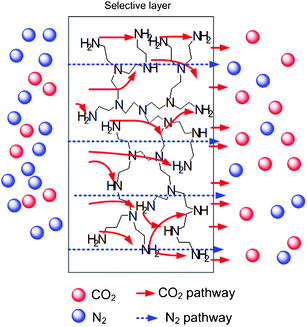 | ||
| Fig. 1 Schematic of CO2 and N2 transport mechanisms in a PEI-facilitated transport membrane (not to scale). The dashed blue line represents the pathway of N2 gases (solution–diffusion mechanism) and the solid red line represents the CO2 pathway (facilitated transport mechanism). | ||
Matsuyama et al.11 showed that PEI can facilitate the transfer of CO2, and they prepared homogenous PEI–PVA blended flat membranes to measure the permeabilities of pure CO2 and N2 gases. It was demonstrated that PEI is able to transfer CO2 very well in this homogenous membrane. Generally, a homogenous flat sheet membrane is thicker and is suitable for measuring the permeance of pure gas. Therefore, based on these results, we expected that if PEI and PVA are coated on the surface of the support membrane, the reactive layer can be made as thin as is reasonable, and it will be able to separate very low concentrations of CO2 from the air. Due to the good stability of PVA polymers and their ability to retain PEI, a thinner PEI–PVA layer on a PES membrane can allow the presence of aggressive feed gases such as turbulent flows and simultaneously reduce the plasticisation of the membrane.12 Additionally, as far as we know, very limited work has been carried out on membrane separation for the capture of CO2 from the air, except in closed spaces.6,7,13 In this work, a facilitated transport membrane composed of a polymeric carrier of PEI and PVA was deposited on a PES hollow fibre membrane. A hollow fibre membrane module was constructed to investigate the ability to capture CO2 from the air.
2. Experimental
2.1 Materials and membrane preparation
A type of branched PEI with a molecular weight (MW) of 25![[thin space (1/6-em)]](https://www.rsc.org/images/entities/char_2009.gif) 000 was purchased from Aldrich (St. Louis, MO, USA). PVA (China Chemical, >98% hydrolysed powder) had an average molecular weight of 63
000 was purchased from Aldrich (St. Louis, MO, USA). PVA (China Chemical, >98% hydrolysed powder) had an average molecular weight of 63![[thin space (1/6-em)]](https://www.rsc.org/images/entities/char_2009.gif) 800–114
800–114![[thin space (1/6-em)]](https://www.rsc.org/images/entities/char_2009.gif) 400. The microfiltration hollow fibres of polyethersulphone (PES) with an average diameter of 150 μm were supplied by Wuxi Geruipuer Membrane Technology Co. Ltd, China.
400. The microfiltration hollow fibres of polyethersulphone (PES) with an average diameter of 150 μm were supplied by Wuxi Geruipuer Membrane Technology Co. Ltd, China.
The PEI–PVA solution was prepared as follows. The dope solutions were prepared by blending PEI and PVA with different weight ratios into water. The PEI–PVA solution was stirred until it formed a completely homogenous solution. Next, the solution was allowed to stand at room temperature without disturbance for 30 min to release the air bubbles within the solution. The PES hollow fibre substrate membrane was immersed in ethanol for 1–5 min to improve its hydrophilicity and then the wet PES membrane was dip-coated with the PEI/PVA solution at room temperature for about 15–20 min. After coating, the membranes were dried at various temperatures (70 to 100 °C) for 1 h, and the resulting PVA–PEI/PES composite hollow fibre membranes were collected for module preparation.
2.2 Membrane characterisation
Attenuated total reflection Fourier transform infrared (ATR–FTIR) spectra were recorded on a Nicolet spectrometer. The ATR accessory contained a zinc selenide (ZnSe) crystal (25 mm × 5 mm × 2 mm) at a nominal incident angle of 45°, yielding about 12 internal reflections at the sample surface. All spectra (100 scans at 4.0 cm−1 resolution) and the ratio to the appropriate background spectra were recorded at 25 μm. A special drying system was constructed to prevent atmospheric moisture from interfering with the spectra.Fibre specimens for scanning electron microscopy (SEM) study were cryogenically fractured in liquid nitrogen and then sputtered with gold to a thickness of 200–300 Å. The morphological structures of the resultant membranes were characterised using an Ultra 55 SEM (Carl Zeiss D, Germany).
2.3 Gas permeation experiment
The module was set up by adding 20 prepared PEI–PVA/PES composite hollow fibres which had a membrane effective area equal to 0.0188 m2. The module casing was made of stainless steel with a length of 20 cm to allow high feed pressure. The gas permeation tests for the CO2 mixtures were carried out by the traditional volumetric technique. Fig. 2 shows a schematic diagram of the experimental setup for the tube side feed CO2 separation process. The gas inlet flow rate and pressure (absolute feed pressure) were changed appropriately using a pressure regulator for feeding the gases.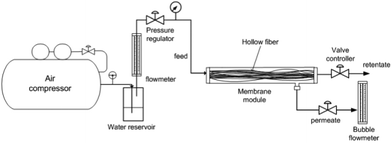 | ||
| Fig. 2 Schematic diagram of the experimental setup for CO2 separation from air by a hollow fibre membrane module. | ||
The feed gas was admitted at a predetermined pressure on one side of the membrane (retentate), and the permeate gas exited at atmospheric pressure from the downstream side of the membrane.
The amount of water was determined using a humidity meter (DT-616CT, CEM China) with the ability to measure 0–100% relative humidity (RH) with an accuracy of ±0.4% RH. The flow rate of the permeate side was measured by a bubble flow meter. For gas mixture permeation, the flow rate of the retentate stream was controlled by a valve controller. The compositions of all the gas streams were analysed by a gas chromatograph (GC, Agilent Model 1790, Agilent Technologies) every 5 to 10 min to acquire stable data. The feed gas stream consisted of a mixture of CO2 and compressed air. The CO2 was collected directly from the open air by an air compressor (Hangzhou Hang Kong Compressor Co., Ltd., China) and was compressed from a concentration of 0.04% to around 0.1–0.2%. The permeation performance of the fabricated membranes was evaluated by two parameters. One was the gas permeance, Ji (mol m−2 s−1 Pa−1), which is given by eqn (7):
 | (7) |
 | (8) |
3. Results and discussion
3.1 Membrane characterisation
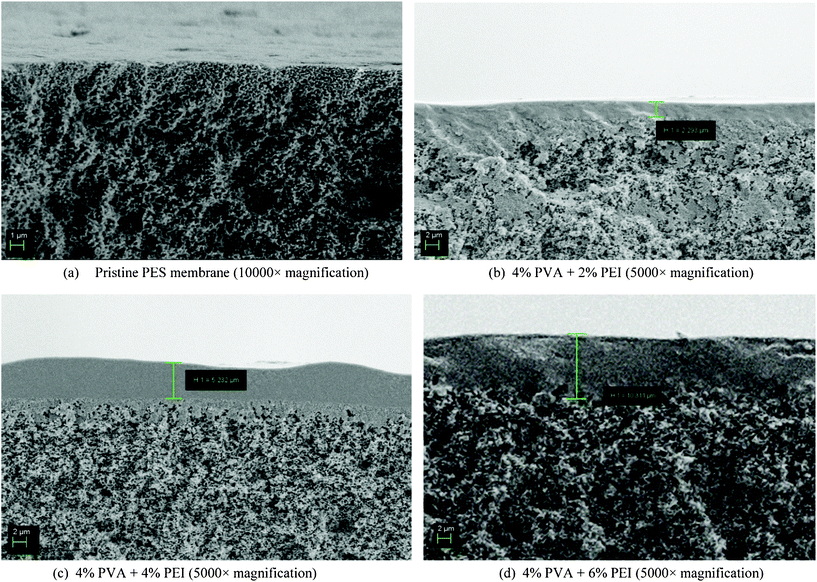 | ||
| Fig. 3 SEM images of the cross-sections of the fabricated membrane (polyvinyl alcohol and polyethylenimine deposited on a microporous polyethersulphone hollow fibre membrane) with different PEI compositions. | ||
It can be seen that the cross-section morphology of the PVA–PEI/PES composite hollow fibre membrane consisted of two parts (Fig. 3(b–d)). The top layer was a dense PVA–PEI active layer, which provided the reaction and gas separation activities, and the bottom layer was the microporous PES supporting layer. This composite structure shows the success of the deposition of PVA–PEI on the PES hollow fibre membrane. Interestingly, the thicknesses of the deposited PVA–PEI layers are different and increased when the PEI composition increased.
From these SEM images, the thickness of the selective layer of 2% PEI and 4% PVA can be observed to be around 2 μm. Based on layer thickness, the amount of PEI deposited on the membrane was approximately 9.71 × 10⁻⁴ g. This layer plays an important role in CO2 separation. Furthermore, when the PEI composition increased to 4% PEI (Fig. 3(c)), the thickness of the selective layer became thicker, about 5 μm at 5000× magnification. This means that the amount of deposited PEI was equal to 3.87 × 10⁻³ g, which could provide more facilitated transport for CO2. In addition, the selective layer increased to around 10 μm when the PEI composition increased to 6%. At this concentration, nearly 0.012 g of PEI was deposited. It is believed that more CO2 reactions with PEI can take place on the selective layer during the separation process. However, the limitation of CO2 breakthrough times given by different PEI compositions could also influence the CO2 separation process.10
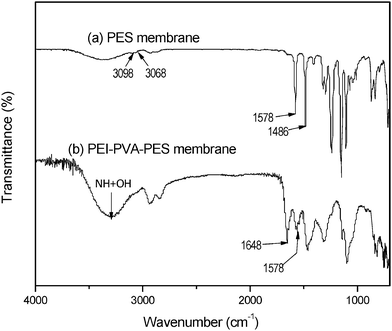 | ||
| Fig. 4 ATR-Fourier transmittance infrared (FTIR) spectroscopy for (a) pristine PES and (b) modified PES (PEI–PVA/PES). | ||
3.2 Separation performance
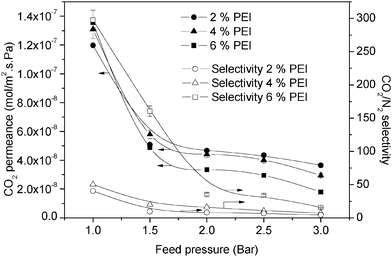 | ||
| Fig. 5 Permeance and selectivity of different PEI compositions with 4% PVA on a PES membrane dried at 100 °C. | ||
Theoretically, when a mixture is brought to a membrane surface by any driving force, there is an accumulation of the less permeable species and a depletion of the more permeable components in the boundary layer adjacent to the membrane. This causes a concentration gradient to build up in the boundary layer, as shown in Fig. 6. This phenomenon is referred to as concentration polarisation. Concentration polarisation exists in all membrane separation processes because of the selective permeability of the membrane.15 It has been reported that mass transfer is influenced not only by resistance from the membrane, but also by resistance from the flow stream in the gas separation membrane.16 Transport through this boundary layer is usually described in terms of a mass transfer coefficient, as shown in eqn (9) and (10).17
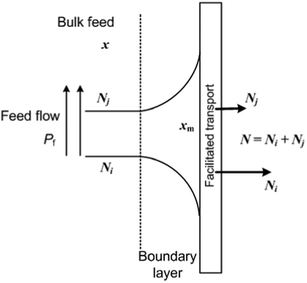 | ||
| Fig. 6 Molar fraction profiles for gas separation in the boundary layer under steady state conditions. | ||

| (9) |

| (10) |
At low feed pressures (Pf = 1 bar), the gas will not be compressed at the membrane upstream. In this condition, the effect of the boundary layer is minimal. Therefore, the separation of CO2 is dominated by facilitating transport mechanisms. This is in agreement with the facilitation factor, F, calculated using eqn (11).18
 | (11) |
At a lower feed pressure (1 bar), the facilitation factor is around 15, which is considerably high. Thus, gas facilitation can occur easily. While at higher pressure, the facilitation factor reduces to less than 5, which indicated a saturated facilitation phenomenon as determined previously. In addition, although permeation may be high at lower pressures, in open air, the downstream side CO2 concentration cannot be increased to more than 0.1%. This is because the molar fraction on the surface, xm, is similar to the molar fraction, x in the bulk feed. Thus, less concentrated CO2 will be permeated.
In comparison, at high feed pressures, the gases are already compressed at the upstream side of the membrane. Thus, the mass transport of CO2 through the boundary layer will be reduced. While, regarding eqn (10), the mass transport of the other gas, N2, would be greater through the boundary layer. Although the mass transport of N2 is greater, N2 permeance in the facilitated transport membrane is usually considered independent of the feed pressure.11,19 Hence, by relatively maintaining the permeance of N2, the CO2 permeance will be decreased, resulting in decreased CO2/N2 selectivity. By using 2% PEI with 4% PVA at a lower feed pressure (1 bar), it was possible to achieve a CO2 permeance of about 1.2 × 10⁻⁷ mol m−2 s−1 Pa−1 and CO2/N2 selectivity of 40. This performance decreased as the facilitation factor was reduced to less than 10 when the feed pressure increased from 1 bar to 3 bar.
With regard to the ability of PEI to facilitate transport, increasing the PEI content is believed to improve CO2 separation performance. Therefore in Fig. 5 the separation performance improved when the PEI composition increased. Similarly, the separation performance of the resulting membrane shows the typical characteristics of a fixed-site carrier. The separation performance of 4% PEI appeared to be higher by 20% compared to that of 2% PEI. The selectivity was higher since more reactions can occur on the membrane surface of 4% PEI compared to 2% PEI. Besides these reactions, the capabilities of different PEI compositions to absorb CO2 also affect the saturation of the selective membrane layer with CO2.
In our process, the compressed air contained around 0.006 mmol CO2/min for every 100 mL min−1 of feed flow. According to Xu et al.,9 1 g of PEI is able to absorb 2.55 mmol of CO2. Therefore, the deposited 2% PEI would have been saturated with CO2 after about 30 s. The time taken for 4% PEI (3.87 × 10⁻³ g) to become saturated would be longer and could reach about 3 min. Li et al.10 revealed that with a lower PEI composition (∼5%) the CO2 breakthrough time was less than 5 min. Thus, it is expected that when using 4% PEI, the CO2 would have enough time to react with PEI before the layer became saturated. However, when the PEI composition increased to 6%, the permeance of CO2 decreased to about 90% when pressure higher than 1 bar was applied. This is because increasing selective thickness will increase the resistance of gas passing through the membrane, and the mass transport of CO2 through the membrane layer will be decreased.
In addition, although a higher PEI content resulted in more reactions, when the PEI content was increased for capturing CO2, the breakthrough time taken for CO2 to be released became longer.10 When 6% PEI was used, the membrane was able to absorb up to 0.031 mmol of CO2 at one time. At this concentration, the CO2 breakthrough time increased to more than 5 min. Therefore, under these conditions, the membrane (6% PEI) was less saturated with CO2 compared with 2% and 4% PEI. Meanwhile, at low feed pressure (1 bar), the CO2 permeance of 6% PEI was slightly greater than that of 4% PEI. In this situation, the reaction activity might affect the separation performance since the feed pressure was close to atmospheric pressure (1 atm). The reduced saturation of 6% PEI will facilitate more CO2 release from the surface and reduce the molar fraction of xm on the surface. With a high PEI content (6%), a permeance of up to 1.4 × 10⁻⁷ mol m−2 s−1 Pa−1 was achieved along with a CO2/N2 selectivity of up to 300 at lower pressure, while 4% PEI gave a permeance of 1.35 × 10⁻⁷ mol m−2 s−1 Pa−1. Furthermore, the CO2/N2 selectivity of 6% PEI was still high even when the feed pressure was higher. The selectivity still reached up to 30 at feed pressures higher than 2.0 bar. This could be because the saturation of 6% PEI for CO2 was still not complete, and thus there may be more reactions for CO2 to be absorbed and released on the permeate side.
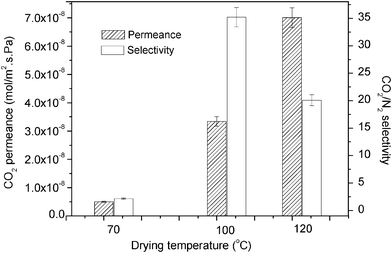 | ||
| Fig. 7 CO2 permeability and selectivity of 4% PVA + 6% PEI at different drying temperatures for 2 bar feed pressure. | ||
Generally, the separation performance of the prepared fibres for all the temperatures selected showed typical membrane separation performance. However, the membrane that was dried at 70 °C had the lowest CO2 separation performance. The CO2/N2 selectivity at this temperature was less than 2 because of the larger N2 mass transfer. Therefore, it is believed that the lowest CO2 separation performance at a drying temperature of 70 °C might be due to swelling of the selective layer (PEI and PVA).
By increasing the drying temperature to 100 °C, the PVA cross-link performance might be increased. Thus, higher CO2 separation performance was observed compared to that obtained with a drying temperature of 70 °C. After the drying temperature reached 120 °C, the CO2/N2 selectivity decreased while the permeance increased. The reduction in selectivity compared with the drying temperature of 100 °C might be because of the decline in –OH groups in PVA at higher drying temperatures (120 °C).20,21 The –OH elimination reaction has been reported by Gilman et al.,20 where changes in the carbonyl region of the PVA polymer took place simultaneously with water elimination (Fig. 8). As shown by Gohil et al.,22 PVA lost nearly 1% of its weight at a temperature of around 100 °C and lost almost 5% of its weight, becoming semi-stable, when the temperature rose to 120 °C. This phenomenon would lead to a decline in the reaction of CO2 with the selective layer, as indicated by Xing and Ho19 and, consequently, would reduce the CO2/N2 selectivity. However, the increase in CO2 permeance with a drying temperature of 120 °C might be due to the reduction in membrane thickness at higher temperatures. Reducing the membrane thickness by increasing the drying temperature to 120 °C would result in a decrease in the transmembrane pressure by about 50%. Therefore, the permeance of the membrane dried at 120 °C was higher than that of the membrane dried at 100 °C. From this measurement, it was found that although high temperatures may cross-link the PVA, the reduction in the amount of water in PVA at temperatures higher than 100 °C may reduce CO2 capture performance.
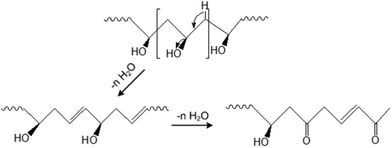 | ||
| Fig. 8 Schematic of the elimination of water from polyvinyl alcohol (PVA) by elevating the drying temperature. | ||
3.2.3.1 Increasing humidity by the feed flow rate. By increasing the feed flow rate, the water content (moisture) in the flow stream was increased, so the separation performance was improved by increasing the reactions between CO2 and PEI. Fig. 9 shows the water content (moisture) when the feed flow rate was increased. The moisture content increased linearly from 30% at a feed flow rate of 50 mL min−1 to almost 50% when the flow rate reached 200 mL min−1. Then, the gradient of the moisture content decreased by 25% when the flow rate exceeded 250 mL min−1. This behaviour of water content according to feed flow rate can be used to measure the performance of the membrane facilitated separation process.
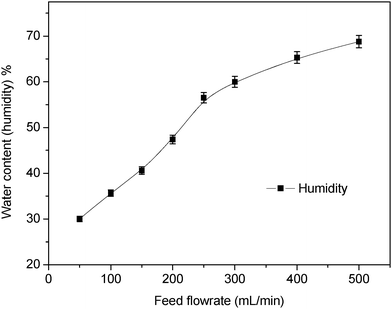 | ||
| Fig. 9 Effect of flow rate on the moisture content of the gas flow stream. | ||
3.2.3.2 Effect on separation performance by the feed flow rate. The effect of flow rate was observed for membrane separation performance. At 2% PEI with 4% PVA, 1 bar feed pressure was used to measure the separation performance of CO2 where the mass transfer through the boundary layer was the highest (Fig. 10). Meanwhile, 3 bar was used on 6% PEI for measuring the effect of flow rate where the mass transfer through boundary layer was the lowest (Fig. 11). In Fig. 10, it can be seen that the permeance of CO2 increased up to 4.5 × 10⁻⁷ mol m−2 s−1 Pa−1, whereas the CO2/N2 selectivity reached nearly 100 at a feed flow rate of 350 mL min−1. Increasing the feed flow rate led to an increase in the amount of CO2 to be separated. At 350 mL min−1, the flow of CO2 increased to 0.017 mmol min−1. Therefore, more reactions took place, which increased the permeation performance. In addition, increasing the feed flow rate could be favourable for the facilitated transport phenomenon since the water content on the membrane surface increased.23 Moreover, we predicted that the change in membrane performance with the feed flow rate could obviously be a result of concentration polarisation occurring in the boundary layer. For slower feed flow, the thickness of the boundary layer was greater and the resistance of the boundary layer was much higher.
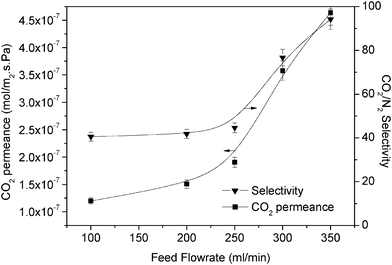 | ||
| Fig. 10 Permeability and selectivity of 4% PVA + 2% PEI at different feed flow rates (1 bar feed pressure). | ||
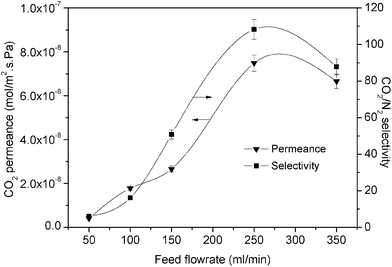 | ||
| Fig. 11 Permeability and selectivity of 4% PVA + 6% PEI at different feed flow rates (3 bar feed pressure). | ||
Increasing the feed flow rate increased the permeance and selectivity due to a reduction in concentration polarisation occurring in the boundary layer of the feed side. As a result, more CO2 was separated, leading to increased CO2 permeance and selectivity. This phenomenon was also attractive since no sweeping gas was allowed to synergise the separation. Avoiding sweeping gas also benefits the separation process in other ways; for example, no addition of gas is needed and the outlet CO2 can be concentrated directly.
In terms of the effect of the flow rate where the CO2 mass transfer through the boundary layer was the lowest, we found similar characteristics of CO2 permeation as mentioned above. Fig. 11 shows the performance of a higher PEI content (6%) at a higher feed pressure when various feed flow rates were applied. From this figure, it can be seen that the CO2 permeance could increase by 300% to reach up to 7.7 × 10⁻⁸ mol m−2 s−1 Pa−1 with a CO2/N2 selectivity of 110 although a high feed pressure was applied. This observation confirmed that a larger amount of CO2 will react with PEI when the feed flow rate is increased. However, both CO2 permeance and CO2/N2 selectivity decreased after the feed flow rate reached 300 mL min−1. This might be due to the fact that the residence time of the gas mixture in the separation module had decreased and consequently reduced the reaction of PEI with CO2.23
3.3. Performance in the concentrating of CO2 from air and recovering capacity
Most studies on the separation of low CO2 concentrations have focused on removing CO2 from specific areas.2 Despite removing low concentrations of CO2, the purpose of storing CO2 should be viewed as a significant opportunity for integration with the CO2 separation process.Fig. 12 shows the CO2 concentration that could be obtained from 4% and 6% PEI with 4% PVA. Generally, the resulting CO2 recovery decreased when the feed pressure increased. Moreover, the recovery was reduced since the permeance of the gases was reduced. In Fig. 12, it can be seen that 4% PEI could recover up to 40% of the CO2 even at a feed pressure of 3 bar, while 6% PEI showed only 30% CO2 recovery and dropped to 25% at 3 bar. Although 6% PEI could only recover 30% of the CO2, the concentration of CO2 was higher than with 4% PEI.
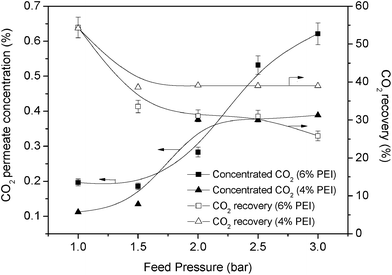 | ||
| Fig. 12 Concentration of CO2 and CO2 recovery (4% and 6% PEI with 4% PVA) at different feed pressures. | ||
As the feed pressure increased, membranes with 6% PEI could obtain a CO2 concentration of nearly 0.7%, whereas 4% PEI could only achieve a CO2 concentration of up to 0.4%. The CO2 concentration with 4% PEI plateaued after the feed pressure was increased to more than 2.0 bar. Huang et al.23 also showed that a higher feed pressure could increase the concentration of the targeted gas at the permeate side.
Although the CO2 concentration was not very high (∼1%), this is an excellent finding since this outlet concentration could be applied to integration with microalgal cultivation.2 According to our previous work,24 the cultivation of Chlorella vulguris is promising as it has a high CO2 consumption when 1% CO2 is fed into the culture. Therefore, by using the outlet CO2 concentration from this experiment, complete CO2 fixation can be achieved. It is believed that by concentrating more CO2 from the air, more purposes can be fulfilled.2,24
To increase the permeate CO2 concentration, we managed to verify the feed flow rate at a high feed pressure. Fig. 13 shows the effect of the feed flow rate on the CO2 concentration performance. In this figure, it can be seen that CO2 was concentrated when the feed flow rate increased. The concentration clearly increased to nearly 0.8% at a feed flow rate of 250 mL min−1. In addition, the recovery could be increased when an appropriate flow rate was applied. In this experiment, the recovery increased by more than 40% when the flow rate reached 250 mL min−1. However, after 300 mL min−1, the concentration and recovery were reduced. This phenomenon is similar to the previously mentioned decrease in separation performance. This high feed flow rate might be favourable for carrying more CO2 to the retentate side.
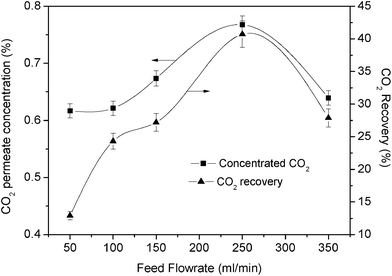 | ||
| Fig. 13 Effect of feed flow rate on CO2 concentration performance at high feed pressure (3 bar) (6% PEI + 4% PVA). | ||
In this work, the maximum CO2 concentration and recovery obtained at a feed pressure of 3 bar were 0.78% and 42%, respectively, at 250 mL min−1.
4. Conclusion
The capture of CO2 from air using PEI–PVA/PES composite hollow fibre membranes was investigated. The results reveal that the CO2 permeance with a lower PEI content (2%) reached up to 1.2 × 10⁻⁷ mol m−2 s−1 Pa−1 with a CO2/N2 selectivity of 40. The performance increased to 1.4 × 10⁻⁷ mol m−2 s−1 Pa−1 with a CO2/N2 selectivity of nearly 300 when the PEI concentration was increased to 6%. Although the separation performance decreased when the feed pressure increased, it increased again when the feed flow rate was increased. At 6% PEI with 4% PVA content, it was possible to increase CO2 permeance compared to the lower feed flow rate (100 mL min−1), achieving up to 7.7 × 10⁻⁸ mol m−2 s−1 Pa−1 with a CO2/N2 selectivity of up to 110, even at a high feed pressure. The best drying temperature for optimum PVA cross-linking and high CO2 separation performance was found to be 100 °C. Attractively, at a 6% PEI content, this separation could obtain a CO2 concentration of 0.8%. This CO2 concentration is a good start for the application of these membranes for integration or other purposes.Acknowledgements
This work is based upon research supported by the National Natural Science Foundation of China (No. 21076177, No. 21106130), the Fundamental Research Funds for the Central Universities, the Zhejiang Provincial Natural Science Foundation of China (Y4100222) and the Doctoral Foundation for Young Teachers in the Higher Education Institutions of Ministry of Education (2011010111120074).References
- D. Keith, Why capture CO2 from the atmosphere, Science, 2009, 325, 1654 CrossRef CAS.
- M. S. A. Rahaman, L. H. Cheng, X. H. Xu, L. Zhang and H. L. Chen, A review of carbon dioxide capture and utilization by membrane integrated microalgal cultivation processes, Renewable Sustainable Energy Rev., 2011, 15, 4002 CrossRef.
- G. J. Francisco, A. Chakma and X. Feng, Membranes comprising of alkanolamines incorporated into polyvinyl alcohol matrix for CO2/N2 separation, J. Membr. Sci., 2007, 303, 54 CrossRef CAS.
- H. M. Rahman, M. Siaj and F. Larachi, Ionic liquids for CO2 capture–Development and progress, Chem. Eng. Process., 2010, 49, 313 CrossRef.
- J. Tang, W. Sun, H. Tang, M. Radosz and Y. Shen, Enhanced CO2 absorption of poly(ionic liquid)s, Macromolecules, 2005, 38, 2037 CrossRef CAS.
- L. H. Cheng, L. Zhang, H. L. Chen and C. J. Gao, Hollow fiber contained hydrogel–CA membrane contactor for carbon dioxide removal from the enclosed spaces, J. Membr. Sci., 2008, 324, 33 CrossRef CAS.
- L. Xu, L. Zhang and H. L. Chen, Study on CO2 removal in air by hydrogel membranes, Desalination, 2002, 148, 309 CrossRef CAS.
- Y. T. Zhang, L. Zhang, H. L. Chen and H. M. Zhang, Selective separation of low concentration CO2 using hydrogel immobilized CA enzyme based hollow fiber membrane reactors, Chem. Eng. Sci., 2010, 65, 3199 CrossRef CAS.
- X. Xu, C. Song, M. J. Andresen, G. B. Miller and W. A. Scaroni, Novel polyethylenimine-modified mesoporous molecular sieve of MCM–41 type as high–capacity adsorbent for CO2 capture, Energy Fuels, 2002, 16, 1463 CrossRef CAS.
- P. Li, B. Ge, S. Zhang, S. Chen, Q. Zhang and Y. Zhao, CO2 Capture by polyethylenimine-modified fibrous adsorbent, Langmuir, 2008, 24, 6567 CrossRef CAS.
- H. Matsuyama, A. Terada, T. Nakagawara, Y. Kitamura and M. Teramoto, Facilitated transport of CO2 through polyethylenimine/poly(vinylalcohol) blend membrane, J. Membr. Sci., 1999, 163, 221 CrossRef CAS.
- W. J. Koros and R. Mahajan, Pushing the limits on possibilities for large scale gas separation: which strategies, J. Membr. Sci., 2000, 175, 181 CrossRef CAS.
- H. Chen, G. Obuskovic, S. Majumdar and K. K. Sirkar, Immobilized glycerol-based liquid membranes in hollow fibers for selective CO2 separation from CO2–N2 mixtures, J. Membr. Sci., 2001, 183, 75 CrossRef CAS.
- M. Ostwal, R. P. Singh, S. F. Dec, M. T. Lusk and J. D. Way, 3–Aminopropyltriethoxysilane functionalized inorganic membranes for high temperature CO2/N2 separation, J. Membr. Sci., 2011, 369, 139 CrossRef CAS.
- O. Lüdtke, R. D. Behling and K. Ohlrogge, Concentration polarization in gas permeation, J. Membr. Sci., 1998, 146, 145 CrossRef.
- K. L. Wang, S. H. McCray, D. D. Newbold and E. L. Cussler, Hollow fiber air drying, J. Membr. Sci., 1992, 72, 231 CrossRef CAS.
- G. He, Y. Mi, P. L. Yue and G. Chen, Theoretical study on concentration polarization in gas separation membrane processes, J. Membr. Sci., 1999, 153, 243 CrossRef CAS.
- W. J. Koros, Y. H. Ma and T. Shimidzu, Terminology for membranes and membrane processes, Pure Appl. Chem., 1996, 68, 1479 CrossRef CAS.
- R. Xing and W. S. W. Ho, Crosslinked polyvinylalcohol–polysiloxane/fumed silica mixed matrix membranes containing amines for CO2/H2 separation, J. Membr. Sci., 2011, 367, 91 CrossRef CAS.
- J. W. Gilman, V. Hart, L. David and T. Kashiwagi, Thermal decomposition chemistry of poly(vinylalcohol) char characterization and reactions with bismaleimides. ACS Symposium, 1994, Series 599, August 21–26, Washington, DC. Search PubMed.
- Y. Ueda, Y. T. Tanaka, A. Iizuka, Y. Sakai, T. Kojima, S. Satokawa and A. Yamasaki, Membrane separation of ethanol from mixtures of gasoline and bioethanol with heat–treated PVA membranes, Ind. Eng. Chem. Res., 2011, 50, 1023 CrossRef CAS.
- J. M. Gohil, A. Bhattacharya and P. Ray, Studies on the cross-linking of poly(vinyl alcohol), J. Polym. Res., 2006, 13, 161 CrossRef CAS.
- J. Huang, J. Zou and W. S. W. Ho, Carbon dioxide capture using a CO2–selective facilitated transport membrane, Ind. Eng. Chem. Res., 2008, 47, 1261 CrossRef CAS.
- L. H. Cheng, L. Zhang, H. L. Chen and C. J. Gao, Carbon dioxide removal from air by microalgae cultured in a membrane–photobioreactor, Sep. Purif. Technol., 2006, 50, 324 CrossRef CAS.
| This journal is © The Royal Society of Chemistry 2012 |
