Anatase/rutile TiO2 nanocomposite microspheres with hierarchically porous structures for high-performance lithium-ion batteries†
Junyao
Shen
ab,
Hai
Wang
*ab,
Yu
Zhou
ab,
Naiqing
Ye
a,
Guobao
Li
*c and
Linjiang
Wang
*ab
aState Key Laboratory Breeding Base of Nonferrous Metals and Specific Materials Processing, Guilin University of Technology, Guilin, 541004, China. E-mail: hbwanghai@gmail.com; Fax: +86-773-5896-671; Tel: +86-773-5896-672
bKey Laboratory of New Processing Technology for Nonferrous Metal and Materials, Ministry of Education, Guilin University of Technology, Guilin, 541004, China. E-mail: wlj@glute.edu.cn
cBeijing National Laboratory for Molecular Sciences, Peking University, Beijing, 100871, China. E-mail: liguobao@pku.edu.cn
First published on 31st July 2012
Abstract
A new anatase/rutile TiO2 nanocomposite microspheres (ART) electrode with hierarchically porous structures was successfully synthesized by a one-step route under mild hydrothermal conditions. The morphology, crystal structure and phase composition, specific surface area and pore size distribution of the obtained nanocomposite were systematically investigated by X-ray diffraction (XRD), Raman spectroscopy, field-emission scanning electron microscopy (FESEM), high resolution transmission electron microscopy (HRTEM) and nitrogen adsorption–desorption measurements. The as-synthesized nanocomposite microspheres electrodes exhibited superior specific capacity and high-rate charge–discharge performance for lithium-ion batteries (LIBs) (∼103 mA h g−1 at 30 C after 100 charge–discharge cycles, 1 C = 170 mA g−1) as compared to commercial TiO2 nanoparticles (P25). The improvement is mainly attributed to enhanced Li-ion diffusion and efficient charge transport as evidenced from cyclic voltammetry (CV) and electrochemical impedance spectroscopy (EIS) measurements. Most importantly, the materials architecture used in this study, comprising of dual-phase TiO2 nanocrystals with hierarchically porous structures would be a general concept that could be applicable in the development of other mixed-phase electrode materials for rechargeable lithium-ion batteries and supercapacitors.
1. Introduction
Recently, lithium-ion batteries (LIBs) based on TiO2 nanocrystalline porous films have attracted considerable attention due to their low cost, facile preparation and low strain insertion characteristics during charge–discharge processes.1–4 In particular, the four common polymorphs of TiO2: anatase,5–9 rutile,4,10 brookite11,12 and TiO2(B)1,2,13,14 have been developed by many researchers for high-performance LIBs. Much attention has been focused on enhanced electrochemical properties of the above-mentioned four pure phases by nanosizing15–17 and constructing unique micro/nanostructures, such as hollow8,18–21 and mesoporous materials.1,3,7,21,22 Very recently, TiO2 nanocomposites, such as TiO2(B)/anatase,23 TiO2/Fe2O3,24 TiO2/SnO219,25,26 with hierarchical structures had been reported to show significant improvements in terms of superior electrochemical properties. The electrochemical properties of the two main crystalline TiO2 polymorphs, anatase and rutile, have been well revealed in both experimental and theoretical studies, respectively; however, fewer studies on the high-rate charge–discharge properties and cycling performance of anatase/rutile dual phase TiO2 have been reported, although the mixed anatase/rutile phase has been demonstrated to exhibit better photovoltaic27 and photocatalytic properties28 than the pure single phases. It is well-known that nanosizing is an important strategy for various types of high-performance LIBs. In principle, P25, about 20 wt% rutile and 80 wt% anatase, with a nanocrystal size of about 20–30 nm should be applicable to high-performance LIBs. Unfortunately, however, the cycling performance and high-rate charge–discharge properties of P25 are not entirely satisfactory, due to aggregation of nanoparticles, loss of particle connection and low packing density during the charge–discharge, which thus limits its practical application.5,9,29,30 Up to now, the electrochemical behavior of the mixed anatase/rutile phase is still unclear for high-performance LIBs.Recently, TiO2-based microspheres with mesoporous structured electrode materials have been a very promising alternative to carbon-based anode materials in lithium-ion batteries.1,7,21 This structure combined the two advantages of nanomaterials and mesoporous materials. On one hand, microspheres have high packing density and good particle mobility to form a compact electrode layer, which are beneficial to obtain high volumetric energy and power density as well as uniform electrode layers. On the other hand, the properties of mesoporous materials ensure high contact area between electrolyte and electrode, short diffusion distances for lithium-ion transport, and good accommodation of strain during the charge–discharge process. To further improve the cycling performance and high-rate charge–discharge properties of mixed anatase and rutile electrodes with the above-mentioned disadvantages, constructing microspheres with mesoporous structure may be one of the efficient solutions to overcome this issue.
Constructing anatase/rutile nanocomposite microspheres with mesoporous electrode materials via a simple method for high-performance LIBs is still a challenge. To our knowledge, this no report of anatase/rutile nanocomposite microspheres for high-performance LIBs application. In this work, anatase/rutile TiO2 (ART) with hierarchical porous structures were successfully synthesized by a one-step route under mild hydrothermal conditions and applied to prepare anodes of LIBs, and their rate performance and cycling stability were investigated. Meanwhile, we also analyzed the possible reason how the excellent electrochemical performance of LIBs was effected by the mixed-phase TiO2 electrodes with hierarchically porous structure via cyclic voltammetry (CV) and electrochemical impedance spectroscopy (EIS) methods. Compared to P25, the unique micro/nano-structured materials provided fast electron transport channels and fast Li-ion diffusion, and reduced electronic resistance, of an interconnected single crystal framework. As a result, the electrodes exhibited superior capacity and high-rate performance for LIBs (∼103 mA h g−1 at 30 C after 100 charge–discharge cycles, 1 C = 170 mA g−1).
2. Experimental section
2.1 Material synthesis
All chemical reagents were commercial products used without further purification. For the typical synthesis of anatase/rutile nanocomposites, 3 g of oxalic acid was dissolved in 30 mL of deionized water–ethanol mixed solution (volume ratio = 3![[thin space (1/6-em)]](https://www.rsc.org/images/entities/char_2009.gif) :
:![[thin space (1/6-em)]](https://www.rsc.org/images/entities/char_2009.gif) 1) at room temperature. After the oxalic acid was dissolved a volume of 1 mL of tetrabutyl titanate was added dropwise slowly into the oxalic acid solution with vigorous stirring for 10 min. The resulting suspension was then transferred to a Teflon-lined autoclave and heated at 180 °C for 14 h. The as-prepared powders were collected by filtration and thoroughly washed with water and ethanol and finally dried in air at 70 °C. Finally, the prepared TiO2 samples were annealed at 400 °C for 3 h in air to remove residual organics. Commercial-grade Degussa P25 was purchased from Degussa Co., Ltd and used as-received.
1) at room temperature. After the oxalic acid was dissolved a volume of 1 mL of tetrabutyl titanate was added dropwise slowly into the oxalic acid solution with vigorous stirring for 10 min. The resulting suspension was then transferred to a Teflon-lined autoclave and heated at 180 °C for 14 h. The as-prepared powders were collected by filtration and thoroughly washed with water and ethanol and finally dried in air at 70 °C. Finally, the prepared TiO2 samples were annealed at 400 °C for 3 h in air to remove residual organics. Commercial-grade Degussa P25 was purchased from Degussa Co., Ltd and used as-received.
2.2 Material characterizations
X-Ray diffraction (XRD) data was collected from 20 to 80° 2θ counting for 2 s per step at room temperature on a PANanalytic X'Pert diffractometer (Cu-Kα radiation, λ = 0.15405 nm, voltage 40 kV, current 40 mA) with 1° fixed divergence and antiscatter slits and a 0.2 mm receiving slit. The surface morphologies of the samples were studied using a JEOL JSM6300 (Tokyo, Japan) field emission scanning electron microscope (FESEM). High-resolution transmission electron microscopy (HRTEM) images were obtained with a JEOL JEM-2010F microscope operating at 200 kV with energy-dispersive X-ray spectroscopy (EDX). The specific surface area and the pore size distribution (BJH method, desorption branch) were determined by nitrogen adsorption–desorption isotherms (Micromeritics, ASAP 2010), after evacuation at 200 °C for 12 h. Raman measurements were carried out at room temperature, and the signals were recorded by a DXR Raman Microscope (DXR Microscope, ThermoFisher, USA). The 10 mW output of the 532 nm line of a Nd YAG laser was used as the excitation source. The obtained Raman spectrum was recorded with a resolution of approximately 1 cm−1.2.3 Electrochemical measurements
The electrochemical measurements were carried out using CR2025-type coin cells with pure lithium metal as both the counter electrode and the reference electrode at room temperature. The working electrode consisted of active material, a conductive agent (carbon black, Super-P-Li), and a polymer binder (poly(vinylidene difluoride), PVDF, Aldrich) in a 70![[thin space (1/6-em)]](https://www.rsc.org/images/entities/char_2009.gif) :
:![[thin space (1/6-em)]](https://www.rsc.org/images/entities/char_2009.gif) 20
20![[thin space (1/6-em)]](https://www.rsc.org/images/entities/char_2009.gif) :
:![[thin space (1/6-em)]](https://www.rsc.org/images/entities/char_2009.gif) 10 weight ratio. A Celgard 3400 membrane was used as a separator and 1.0 M LiPF6 in a mixture of ethylene carbonate–diethyl carbonate (1
10 weight ratio. A Celgard 3400 membrane was used as a separator and 1.0 M LiPF6 in a mixture of ethylene carbonate–diethyl carbonate (1![[thin space (1/6-em)]](https://www.rsc.org/images/entities/char_2009.gif) :
:![[thin space (1/6-em)]](https://www.rsc.org/images/entities/char_2009.gif) 1 volume, Novolyte Technologies, USA) was used as the electrolyte. Cell assembly was carried out in an Ar-filled glovebox with concentrations of moisture and oxygen below 1.0 ppm. The charge/discharge cycling and cyclic voltammetry (CV) (1–3 V, 0.2 mV s−1) was performed at room temperature using an electrochemical workstation (CHI 860 D, Beijing) using a battery testing system (NEWARE) at different current rates with a voltage window of 1–3 V. Electrochemical impedance spectroscopy (EIS) measurements were performed at frequencies ranging from 10−2 to 105 Hz. Reference experiments were performed by using Degussa P25 as anode material.
1 volume, Novolyte Technologies, USA) was used as the electrolyte. Cell assembly was carried out in an Ar-filled glovebox with concentrations of moisture and oxygen below 1.0 ppm. The charge/discharge cycling and cyclic voltammetry (CV) (1–3 V, 0.2 mV s−1) was performed at room temperature using an electrochemical workstation (CHI 860 D, Beijing) using a battery testing system (NEWARE) at different current rates with a voltage window of 1–3 V. Electrochemical impedance spectroscopy (EIS) measurements were performed at frequencies ranging from 10−2 to 105 Hz. Reference experiments were performed by using Degussa P25 as anode material.
3. Results and discussion
When the white TiO2 powders were obtained we first checked their morphology by FESEM. Fig. 1a–c show a typical FESEM image with low magnification of the sample, where we can see that the obtained products are microspheres with a diameter of about 4–6 μm, in which some individual hollow microspheres can be distinguished. The hollow cavity of the microspheres is more obvious when an individual broken hollow microsphere is presented in a magnified FESEM image in Fig. 1c. From Fig. 1c, we observe that the microsphere is constructed by numerous nanospheres with a size of the order of tens of nanometers. These nanospheres were densely packed with each other on the surface of the microspheres. The structural phase of the obtained sample was investigated by XRD as shown in Fig. 1d. The results indicated that the obtained TiO2 powder was composed of anatase and rutile phases. The phase fraction by weight was determined to 72% of anatase and 28% of rutile according to the Rietveld method implemented in GSAS software (Fig. S1, ESI†).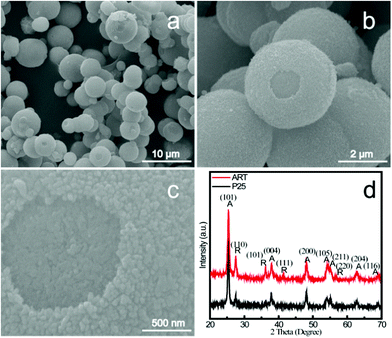 | ||
| Fig. 1 (a)–(c) FESEM images of anatase/rutile TiO2 nanocomposite microspheres via a simple hydrothermal method at different magnifications. (d) Typical XRD patterns of the products obtained at 150 °C; A: anatase; R: rutile. | ||
The coexistence of the two TiO2 phases in the TiO2 nanocomposite microspheres was further proven by Raman spectroscopic analysis (Fig. 2). As anatase and rutile belong to different space groups (I41/amd with Z = 4 for anatase, P42/mnm with Z = 2 for rutile), their characteristic Raman spectra are quite different from each other. In the Raman spectrum of TiO2, the peaks centered at 143 (Eg), 199 (Eg), 396(B1g), 514 (A1g) and 636 cm−1 (Eg), are attributed to the anatase phase,31 while other peaks, located at 235 (second-order Raman scattering), 443 (Eg) and 608 cm−1 (A1g), are characteristic of the rutile phase.32 The Raman spectrum of P25 and TiO2 nanocomposite microspheres consisted of characteristic peaks of anatase and rutile phase. In the TiO2 nanocomposite microspheres, the rutile relative phase composition is higher than that of P25, which is consistent with the result from the XRD pattern above. It should be noted that Raman spectrum is surface sensitive, while XRD is representative of bulk materials. Such difference between the XRD and Raman data indicated that the TiO2 nanocomposite microspheres were composed of anatase and rutile distributed over the entire sphere.
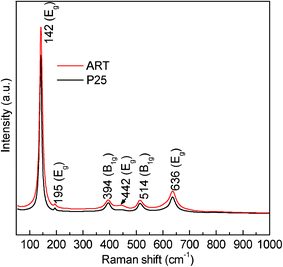 | ||
| Fig. 2 Raman spectra of P25 and anatase/rutile TiO2 nanocomposite microspheres. | ||
To give further insight into the porous structures and pore size distribution of the as-obtained products, HRTEM and Brunauer–Emmett–Teller (BET) measurements were performed to examine the characteristics of the pores. The HRTEM (Fig. 3a) image shows mesoporous structure and obvious grain boundaries (red arrow) in the mixed phase TiO2 nanocrystals. The corresponding selective electron diffraction pattern (SAED) shown in Fig. 3b supported that the hierarchical sphere structure was mixed phase-type TiO2, which corresponded to the XRD and Raman results. The assembly of the nanospheres created interparticle spaces, forming the porous structures. Due to the hierarchical micro/nanostructures of the sample, we expected the product to have a large surface area; thus, in order to study the porosity of the sample, we measured the nitrogen adsorption–desorption isotherm of the sample, which is shown in Fig. 3c. The obtained isotherm of the sample is a typical IUPAC type-IV isotherm, which indicates the presence of mesoporous structures in the sample. The pore sizes are mainly distributed around estimated sizes of 2.3, 4.2 and 17.4 nm. Note that the peak around 2.3 nm is very small, which may be derived from consumption of organic species, and we assume the larger size of the mesopores mainly arises from the explosive release of CO2 in the confined space of the smaller mesopores during the thermal process of formation of mixed-phase TiO2 nanocomposite microspheres. Quantitative calculation showed that the sample possesses a BET surface area of 54.08 m2 g−1, which is comparable to that of P25 (ca. 50 m2 g−1). The surface area is not greatly improved as expected in our experiments, which is obviously related to the fact that the TiO2 nanosphere building blocks are interconnected structures, and the pores embedded in the nanoscale thin layer do not have a very large inner surface area. Fig. 3d presents an illustration scheme of the interconnected structure of mixed phase TiO2 nanocrystals based on the analysis derived from the HRTEM images, nitrogen adsorption–desorption isotherms and Raman spectrum.
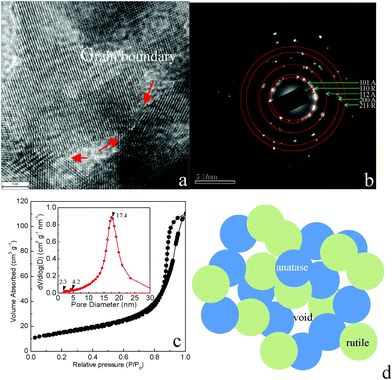 | ||
| Fig. 3 (a) HRTEM image of the obtained TiO2 microspheres; the red arrow highlights the grain boundary; (b) the corresponding SAED patterns of the mixed-phase TiO2 nanocrystals; (c) nitrogen adsorption–desorption isotherms and the corresponding Barrett–Joyner–Halenda (BJH) pore size distribution curve (inset); (d) a schematic of the mixed-phase TiO2 nanocrystals. | ||
Currently, researchers have become increasingly interested in TiO2 materials with mesoporous microstructures within their crystalline framework. For example, Yoon et al. applied mesoporous TiO2 with a pore diameter of 5 nm to fabricate LIBs.33 Mesoporous TiO2 with a pore diameter of 12 nm was prepared by Liu et al. who reported its corresponding cycle performance.1 Shao et al. fabricated LIBs with a 5.4 nm mesoporous TiO2 electrode.7 All the above work is interesting and valuable, but these researches mainly focused on mesoporous electrodes with a small and narrow range of pore diameter. Because the liquid electrolyte percolation is mainly determined by the pore diameter size, the Li-ion diffusion is greatly affected by the pore size of the mesoporous TiO2 electrode. Recently, macropores have been demonstrated to have an obvious effect on the cycle performance, however, mixed-phase mesoporous TiO2 with large pore diameter size has also not well been elucidated in LIBs application in the previously reported literature. Therefore, it is of practical importance to investigate the electrochemical behavior of mixed-phase TiO2 with a large mesoporous size.
The cycling performance of the as-synthesized organized microspheres of the ART were further investigated (Fig. 4). As shown in Fig. 4a, it delivers a discharge capacity of about 112 mA h g−1 at 30 C, which only decreases slightly to 110 mA h g−1 after 100 charge–discharge cycles, corresponding to 98% of its initial capacity. The average coulombic efficiency for the ART cell at 5 C is as high as 99.85%. When compared to state-of-art TiO2 based materials in previous literature,1–4 it was found that the ART exhibits a comparable cycling performance.
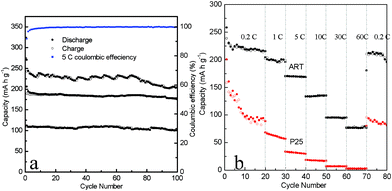 | ||
| Fig. 4 (a) Cycling performance at 1 C, 5 C and 30 C for 100 cycles for the mixed-phase ART electrodes. (b) Rate performance at various rates (0.2–60 C) for ART and P25. | ||
The rate performance of the ART at 0.2–60 C was investigated, as shown in Fig. 4b. As observed from these two curves in Fig. 4b, the ART exhibits excellent rate capability compared to P25 at different current rates. At lower rates, the discharge capacities at 1 and 5 C are about 205 and 170 mA h g−1, respectively, and it can still retain 134 mA h g−1 at 10 C. Even at the highest rate of 60 C, a capacity of 77 mA h g−1 can be delivered. After this high-rate charge–discharge process, the ART could supply again the previously measured value (212 mA h g−1) at 0.2 C rate, as an indication of the high reversibility of the electrode materials. Evidently, the electrochemical performance of ART is superior to that of most previously reported TiO2-based nanomaterials obtained under similar test conditions. Compared with the P25, ART showed a high capacity with relatively low capacity retention in a large cut-off voltage window, which may due to the high electron transfer rate between the active nanocrystals and high diffusion rates. It is noted that P25 showed a similar specific surface area to the as-prepared ART electrode materials, therefore, a surface area effect can be reasonably excluded under the same measurement conditions. It is well-known that, in many instances, the electrochemical properties are influenced by the surface area, and a larger surface area usually results in better properties in LIBs. The electrochemical property of the ART electrodes with relatively low surface area is found to be comparable to those reported in the literature previously. CV and EIS measurements were thus undertaken to reveal the kinetics process of Li-ion diffusion and electron transfer of the ART electrodes.
To further understand the nature and potentials of galvanostaic cycling of the composite electrode materials during the charge–discharge process, cyclic voltammetry was performed. As shown in Fig. S2 (ESI†), the CV patterns are generally consistent with previous reports. In the first discharge curve, the sharp oxidation peak of ART electrode located at ca. 1.68 V (Li/Li+) means an insertion of Li ions. In the charge curve, the electrodes showed a sharp reduction peak at 2.16 V, corresponding to reduction of Li ion from LixTiO2. For anatase/rutile electrodes, the change from the first cycle to the second cycle may be due to the incomplete conversion reaction and irreversible lithium loss due to the formation of the SEI film. The measured value of the ratio for peak currents Ipa/Ipc is nearly the same, indicating that ART exhibited excellent cycling behavior. Moreover, for the 2nd cycle, the peak intensity of the ART electrode was higher than for a previously reported TiO2 electrode, suggesting a fast Li ion diffusion and electron transfer kinetics, as further confirmed in Fig. S2b (ESI†). The measured peak current Ip is proportional to the square root of the scan rate as illustrated in Fig. 5a (inset), indicating a Li ion diffusion-controlled electrochemical process at room temperature. Thus, the peak current Ip can be described by the Randles–Sevcik equation for a reversible system at room temperature. For anatase and rutile electrodes, the diffusion coefficient has been studied.21 Particularly, for rutile, it is believed that Li ion insertion into rutile particles is kinetically limited at room temperature.
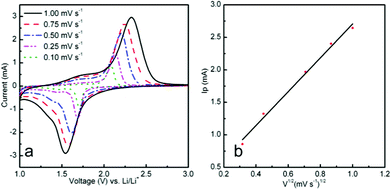 | ||
| Fig. 5 (a) Cyclic voltammograms of ART at different scan rates (0.1–1 mV ns−1) and (b) corresponding voltammetric current densities vs. square root of scan rate. | ||
In our investigation, CV measurements were conducted to investigate Li ion diffusion both in material and in electrolyte near the interface of electrode/electrolyte. Varying scanning rates of 0.1, 0.25, 0.5, 0.75 and 1 mV s−1 were carried out and are plotted in Fig. 5a. It can be seen that current amplitude of the peaks and ΔEp (the separation between the pair of reduction–oxidation peaks) increased as the scanning rate was increased, which is connected with the characteristics of the Li ion interface kinetics process. The Randles–Sevcik formula is used to measure the Li ion diffusion coefficient around two pairs of charge–discharge platforms. Because the intercalation process of Li ions in particles is a diffusion process, the electrode reaction can be assumed to be under the condition of semi-infinite diffusion. Accordingly, the formula can be written as:
| ip = (2.69 × 10⁵)n3/2ACD1/2γ1/2 | (1) |
Nyquist plots of the P25, as-prepared ART and ART-based LIBs (Fig. 6) demonstrates obviously that the ART benefits from the fast charge-transfer, which is reflected by the diameter of the semicircle in the medium-frequency region. After the high-rate test, the charge transfer resistances of both samples increased, but the resistance increase for the ART nanocomposite is much smaller than that for the P25 and as-prepared ART nanocomposite. This means that the ART has superior high-rate cycle stability. Compared to the two CV patterns of as-prepared ART and ART-based LIBs (Fig. S2 and Fig. S3a, ESI†), the CV curve of ART shows two sharp peaks, which indicate that the ART has very good crystallinity quality after a low-temperature sintering process. Fig. S3b (ESI†) shows the different cycles obtained from the P25 and ART materials at 5 C between 1 and 3 V. In contrast to P25, for which the voltage profile of the 50th cycle showed substantial decay, a long plateau was observed for ART between 1.68 and 2.16 V even after the 80th and 100th cycles, leading to high charge–discharge capacity and high-rate cycle stability. Moreover, the Nyquist plots of the ART electrode even after the 100th cycling also shows that the resistance is also smaller than that of P25 electrode.
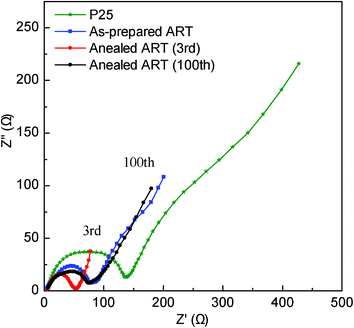 | ||
| Fig. 6 Nyquist plots of P25, as prepared ART and ART-based LIBs (vs. Li/Li+) at 5 C with different cycling number. | ||
For the larger polarizations in Fig. S3a (ESI†), the relatively low power density of lithium-ion batteries based on P25 electrode materials is mainly caused by large polarization at high charging rate, which is mainly due to slow lithium diffusion in active materials of electrodes, resistance of electrolyte and electric resistance of active materials. Fabricating porous electrodes is one of the possible solutions to decrease the large polarization, because the large specific surface area decreases the current density per unit surface area of the electrodes, whereas the small size of nanocrystals decreases the solid-phase diffusion length of lithium-ions in the active materials and finally, the electrolyte is smoothly transported through the large mesopores.
Based on above experimental results, the superior electrochemical properties of ART electrodes can partially be attributed to their dense pack density and tap density that can effectively alleviate the volume variation during high-rate charge–discharge processes. The semicircle located at the high frequency section of the Cole–Cole plot was ascribed to the charge transfer through the surface layer of TiO2 nanocrystals. The LIBs with ART electrodes showed lower total internal resistance, which is in accord with the cell performance. According to the barrier-limited transport equation:34
| σ = σ0exp(−qϕgb/kT) | (2) |
Generally, the LIBs include two primary kinetics processes during charge and discharge (Scheme 1): (1) electron transfer kinetics (K1, K3), (ii) Li-ion diffusion kinetics (K2, K4). It is conceivable that the K1 kinetics is governed by electron transfer through grain boundaries. Combined with the analysis of microstructure of ART in Fig. 3, we considered that the continuous interconnected single crystals facilitated electron transfer in the LIBs. Our assumption is supported by investigations of the cell electrochemical properties. Therefore, we reasonably considered that the interconnected structure of TiO2 nanocrystals are expected to result in a great improvement for fast charge electron transfer. These results are consistent with the CV and EIS analysis. The lower surface charge transfer resistance and the higher Li-ion diffusion coefficient are responsible for the highest rate capability of the ART electrode. Especially, the ART electrode possesses a continuous electron channel between the current collector and active material, which is favorable for electron transfer during the charge–discharge processes. In addition, the high Li-ion diffusion coefficient also is an important factor for high-performance LIBs. An interconnected electrolyte-filled pore network with large mesopores will enable rapid ion transport. As a result, an excellent rate capability and cycling stability of ART material are achieved.
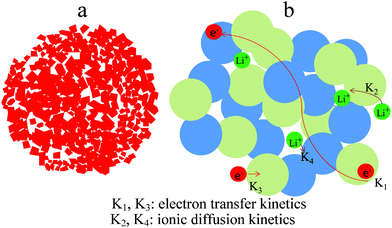 | ||
| Scheme 1 (a) Schematic showing anatase/rutile TiO2 nanocomposite microspheres; (b) simple schematic representations of electron transport and Li-ion diffusion paths in ART electrode. | ||
4. Conclusions
In summary, a new anatase/rutile nanocomposite microsphere anode with hierarchically porous structures was fabricated via a simple hydrothermal method, and it demonstrated excellent cycling stability and fast charge–discharge performance. A stable charge–discharge capacity of ∼103 mA h g−1 was retained after 100 cycles of charge–discharge process at 30 C. As compared to P25, the anatase/rutile nanocomposites integrated with hierarchically porous structures and microspheres are observed to facilitate Li-ion diffusion and charge transport, finally resulting in ART electrodes having high cycling stability and rate properties. This investigation for the first time demonstrates that anatase/rutile TiO2 nanocomposites with hierarchically porous structures have superior electrochemical performance, suggesting that the ART electrode is a promising candidate for high-performance anode materials in advanced LIBs. The material architecture, composed of dual-phase TiO2 nanocrystals with a superior electrochemical behaviour, would be a general concept that could be applicable to the development of other mixed phase electrode materials for rechargeable lithium-ion batteries and supercapacitors.Acknowledgements
This work was supported by NSFC-51064006, Department of Education, Guangxi Zhuang Autonomous Region of China (Grant No. 200103YB061, No. 201010LX188) and the startup fund from Guilin University of Technology.References
- H. S. Liu, Z. H. Bi, X. G. Sun, R. R. Unocic, M. P. Paranthaman, S. Dai and G. M. Brown, Adv. Mater., 2011, 23, 3450–3454 CrossRef CAS.
- Y. Ren, Z. Liu, F. Pourpoint, A. R. Armstrong, C. P. Grey and P. G. Bruce, Angew. Chem., Int. Ed., 2012, 51, 2164–2167 CrossRef CAS.
- K. Saravanan, K. Ananthanarayanan and P. Balaya, Energy Environ. Sci., 2010, 3, 939–939 CAS.
- M. Pfanzelt, P. Kubiak, M. Fleischhammer and M. Wohlfahrt-Mehrens, J. Power Sources, 2011, 196, 6815–6821 CrossRef CAS.
- J. Wang, J. Polleux, J. Lim and B. Dunn, J. Phys. Chem. C, 2007, 111, 14925–14931 CAS.
- J. Xu, C. Jia, B. Cao and W. Zhang, Electrochim. Acta, 2007, 52, 8044–8047 CrossRef CAS.
- J. Wang, Y. Zhou, Y. Hu, R. O. Hayre and Z. Shao, J. Phys. Chem. C, 2011, 115, 2529–2536 CAS.
- Y. Wang, X. Su and S. Lu, J. Mater. Chem., 2012, 22, 1969–1976 RSC.
- J. S. Chen and X. W. Lou, Electrochem. Commun., 2009, 11, 2332–2335 CrossRef CAS.
- Z. Hong, M. Wei, T. Lan, L. Jiang and G. Cao, Energy Environ. Sci., 2012, 5, 5408–5413 CAS.
- D. Dambournet, I. Belharouak and K. Amine, Chem. Mater., 2010, 22, 1173–1179 CrossRef CAS.
- M. A. Reddy, V. Pralong, U. V. Varadaraju and B. Raveau, Electrochem. Solid-State Lett., 2008, 11, A132–A134 CrossRef.
- G. Armstrong, A. R. Armstrong, J. s. Canales and P. G. Bruce, Chem. Commun., 2005, 2454–2456 RSC.
- J. J. Li, W. Wan, H. Zhou and D. Xu, Chem. Commun., 2011, 47, 3439–3441 RSC.
- M. Wagemaker, W. J. H. Borghols, E. R. H. van Eck, A. P. M. Kentgens, G. J. Kearley and F. M. Mulder, Chem.–Eur. J., 2007, 13, 2023–2028 CrossRef CAS.
- W. J. H. Borghols, M. Wagemaker, U. Lafont, E. M. Kelder and F. M. Mulder, Chem. Mater., 2008, 20, 2949–2955 CrossRef CAS.
- M. Wagemaker, W. J. H. Borghols and F. M. Mulder, J. Am. Chem. Soc., 2007, 129, 4323–4327 CrossRef CAS.
- J. S. Chen, D. Luan, C. M. Li, F. Y. Boey, S. Qiao and X. W. Lou, Chem. Commun., 2010, 46, 8252–8254 RSC.
- X. W. Lou and L. A. Archer, Adv. Mater., 2008, 20, 1853–1858 CrossRef CAS.
- B. Song, S. W. Liu, J. K. Jian, M. Lei, X. J. Wang, H. Li, J. G. Yu and X. L. Chen, J. Power Sources, 2008, 180, 869–874 CrossRef CAS.
- F. Zhang, Y. Zhang, S. Song and H. Zhang, J. Power Sources, 2011 Search PubMed.
- K. X. Wang, M. D. Wei, M. A. Morris, H. S. Zhou and J. D. Holmes, Adv. Mater., 2007, 19, 3016–3020 CrossRef CAS.
- Z. X. Yang, G. D. Du, Z. P. Guo, X. B. Yu, Z. X. Chen, T. L. Guo, N. Sharma and H. K. Liu, Electrochem. Commun., 2011, 13, 46–49 CrossRef CAS.
- Y. Luo, J. Luo, J. Jiang, W. Zhou, H. Yang, X. Qi, H. Zhang, H. J. Fan, D. Y. W. Yu, C. M. Li and T. Yu, Energy Environ. Sci., 2012, 5, 6559–6566 CAS.
- Z. X. Yang, G. D. Du, Q. Meng, Z. P. Guo, X. B. Yu, Z. X. Chen, T. L. Guo and R. Zeng, RSC Adv., 2011, 1, 1834–1840 RSC.
- Y. Zhou, C. Jo, J. Lee, C. W. Lee, G. Qao and S. Yoon, Microporous Mesoporous Mater., 2012, 151, 172–179 CrossRef CAS.
- T. K. Yun, S. S. Park, D. Kim, J.-H. Shim, J. Y. Bae, S. Huh and Y. S. Won, Dalton Trans., 2012, 41, 1284–1288 RSC.
- D. Jiang, S. Zhang and H. Zhao, Environ. Sci. Technol., 2007, 41, 303–308 CrossRef CAS.
- P. Kubiak, J. Geserick, N. Hüsing and M. Wohlfahrt-Mehrens, J. Power Sources, 2008, 175, 510–516 CrossRef CAS.
- H. E. Wang, Z. Lu, L. Xi, R. Ma, C. Wang, J. A. Zapien and I. Bello, ACS Appl. Mater. Interfaces, 2012, 4, 1608–1613 CAS.
- T. Ohsaka, F. Izumi and Y. Fujiki, J. Raman Spectrosc., 1978, 7, 321–324 CrossRef.
- R. J. Betsch, H. L. Park and W. B. White, Mater. Res. Bull., 1991, 26, 613–622 CrossRef CAS.
- S. J. Bao, Q. L. Bao, C. M. Li and Z. L. Dong, Electrochem. Commun., 2007, 9, 1233–1238 CrossRef CAS.
- J. Y. W. Seto, J. Appl. Phys., 1975, 46, 5247–5254 CrossRef CAS.
Footnote |
| † Electronic supplementary information (ESI) available: Experimental details and supplementary results. See DOI: 10.1039/c2ra20962d/ |
| This journal is © The Royal Society of Chemistry 2012 |
